Category: Case Study

  • Ford’s Rare Earth Magnet Halt: What the Explorer Shutdown Exposed

    Ford’s Rare Earth Magnet Halt: What the Explorer Shutdown Exposed

    The Day the Assembly Line Stopped: What the Ford Explorer Halt Really Signals

    For more than a decade, rare earths sat in the “strategic risk” slide deck but rarely in the actual production incident log. That changed when, in early 2025, Ford halted Explorer production because it could not secure critical rare earth permanent magnets. At the same time, dysprosium was reported trading at around $1,125/kg and terbium at $4,500/kg in Western spot markets, at massive premiums to Chinese domestic pricing. This was not a debate about export policy in a conference room; it was an empty assembly line.

    Materials Dispatch has seen rare earth issues disrupt margins, delay model launches, and force quiet motor redesigns. A complete halt of a mainstream vehicle program marks a different phase: critical materials are now a direct determinant of civilian industrial output, not just a background geopolitical worry. This briefing separates what is known from what is inferred, and argues that the Explorer halt is a systemic indicator, not an isolated misstep.

    • The Ford Explorer halt in 2025 over rare earth magnet shortages marks a visible operational failure, not just a procurement headache.
    • Dysprosium at $1,125/kg and terbium at $4,500/kg in Western spot markets highlight a bifurcated price system versus Chinese domestic markets.
    • McKinsey projections of rare earth magnet demand rising from about 59,000 to 186,000 metric tons by 2035 point to a structural supply-demand squeeze.
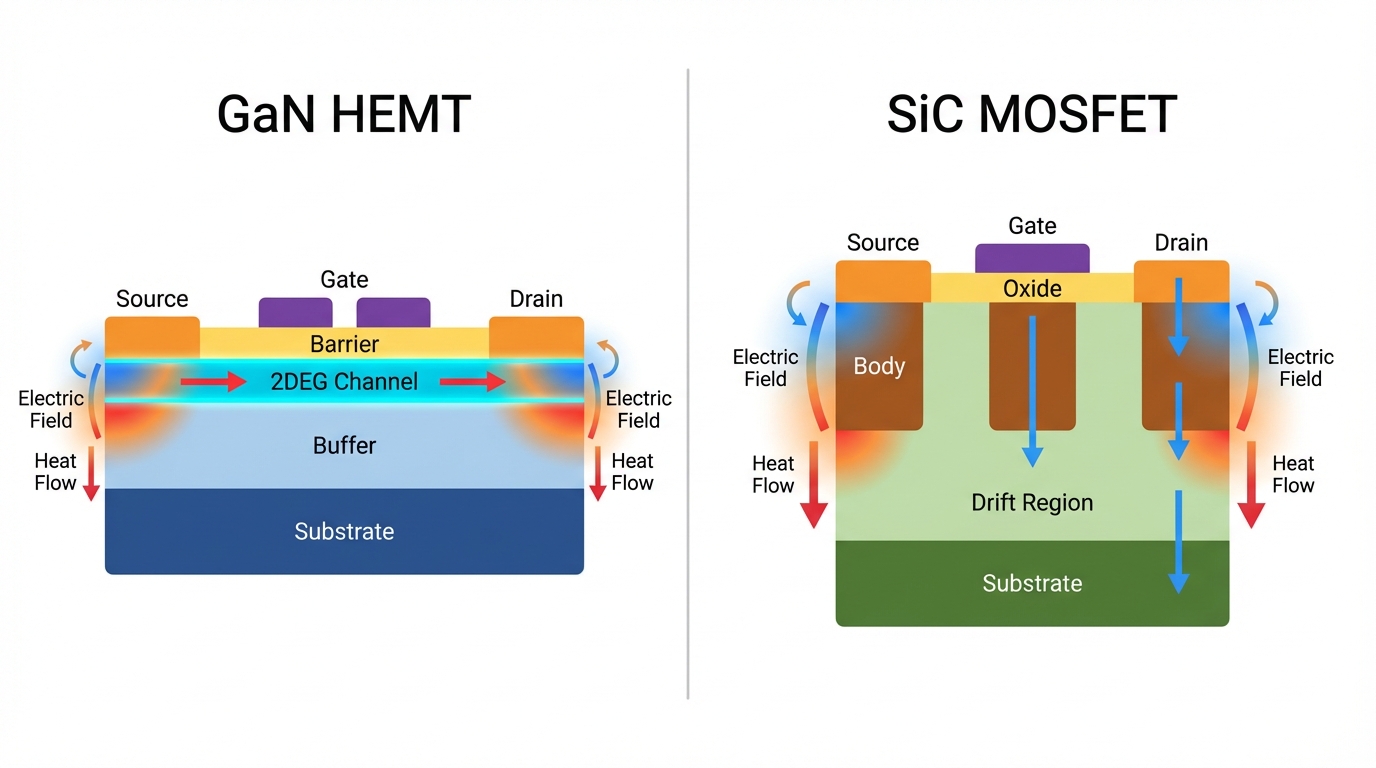
    • NdFeB magnet constraints now sit at the critical path for EV drivetrains and industrial motors, especially where high-temperature performance is non-negotiable.
    • Operationally, magnet supply has moved from a Tier‑2 component issue to a board-level risk, with implications for design, sourcing, and regional industrial competitiveness.

    FACTS: What Can Be Stated with Confidence

    Ford’s 2025 Explorer Production Halt

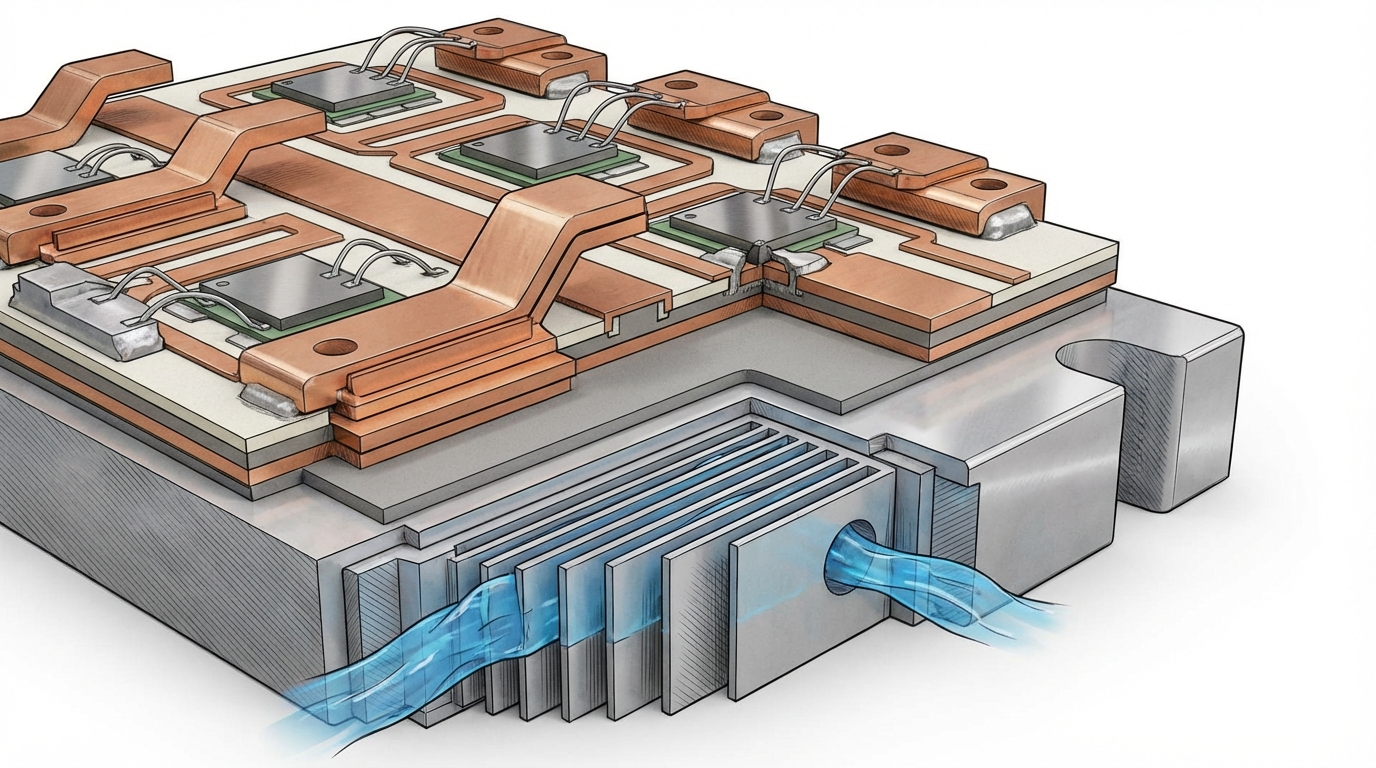
    In early 2025, Ford halted production of its Explorer line because it could not secure sufficient volumes of rare earth permanent magnets for key powertrain and systems components. Reporting around the episode linked the disruption specifically to shortages of neodymium-iron-boron (NdFeB) magnets containing heavy rare earth dopants for high-temperature performance.

    The affected magnets are used in traction motors, power steering, and other critical systems where compact, high-torque, and high-efficiency performance is required. Substitute technologies exist (for example, induction or wound-rotor motors), but they require substantial redesign, validation, and retooling. As a result, the immediate lever available to the OEM was not rapid substitution, but line stoppage.

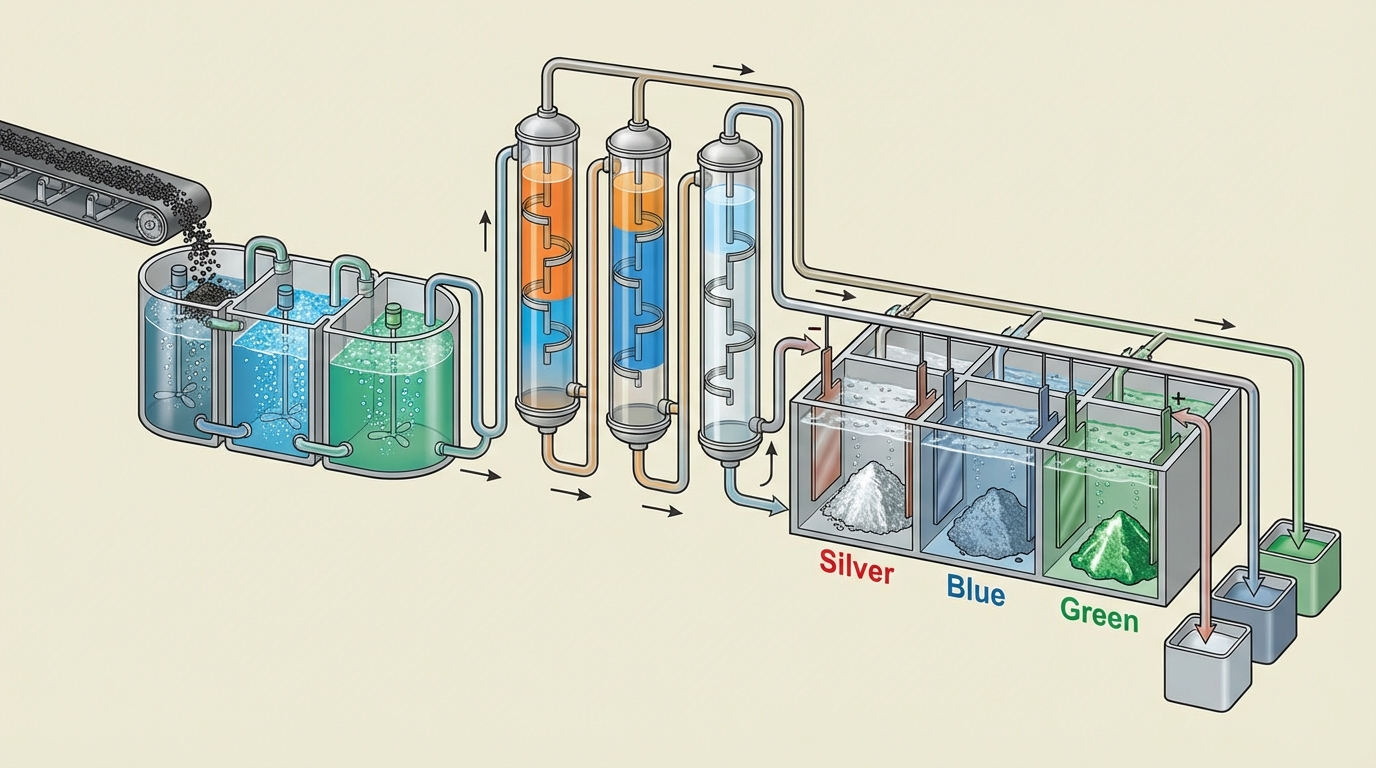
    Dysprosium and Terbium Western Spot Prices in 2025

    At the time of the Explorer halt, dysprosium was reported trading at around $1,125 per kilogram and terbium at approximately $4,500 per kilogram in Western spot markets. These levels represented substantial premiums to contemporary Chinese domestic prices for the same oxides and metals.

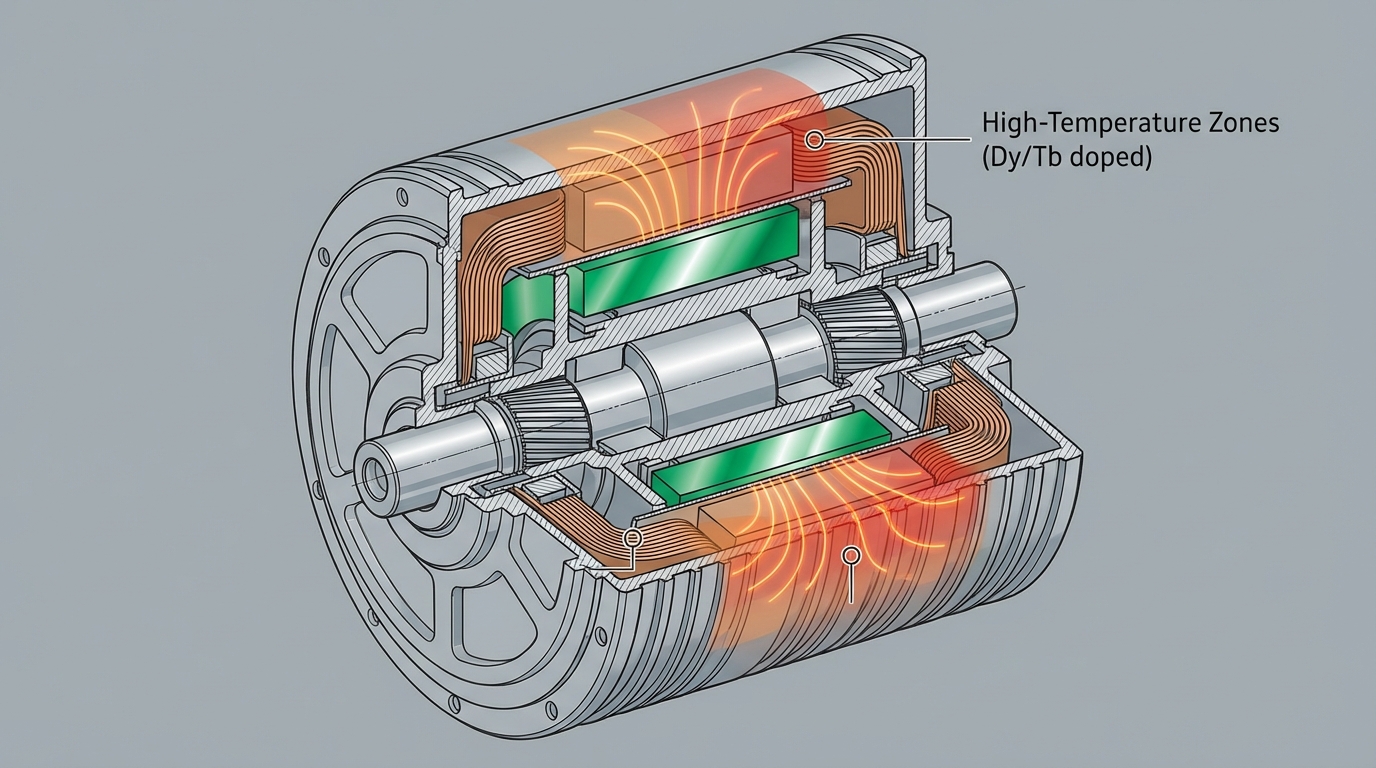
    Dysprosium and terbium are heavy rare earth elements used in small quantities as dopants in NdFeB magnets to maintain coercivity and performance at elevated temperatures. High-temperature traction motors for EVs, hybrid systems, and industrial drives are typical applications. The price spike and premium over Chinese domestic levels are consistent with a situation in which:

    • Chinese producers and consumers operate in a protected or semi-insulated domestic price environment.
    • Export availability is constrained by a mix of policy, licensing, and internal demand prioritization.
    • Western and allied buyers compete in a residual, thinner, higher-priced pool of material and finished magnets.

    McKinsey Rare Earth Magnet Demand Projections to 2035

    McKinsey analysis referenced in industry discussions projects that demand for rare earths used in permanent magnets could rise from roughly 59,000 metric tons to about 186,000 metric tons by 2035. The central drivers identified are:

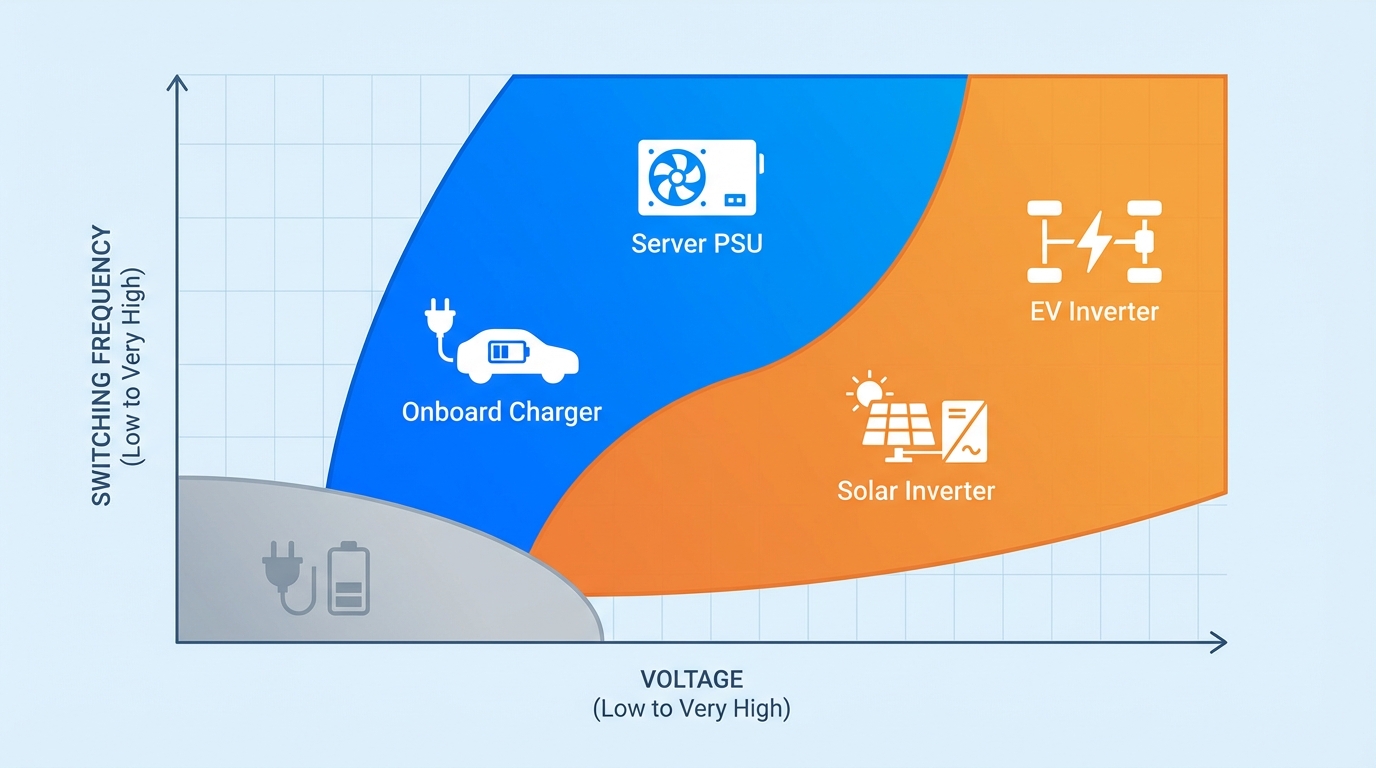
    • Rising global EV and hybrid vehicle production, particularly magnet-intensive permanent magnet synchronous motors.
    • Expansion of renewable generation, especially wind power using direct-drive or hybrid-drive generators with NdFeB magnets.
    • Growth in industrial automation, robotics, and high-efficiency motor use across manufacturing and logistics.

    This projection implies roughly a threefold increase in demand for magnet-related rare earth oxides and metals over a decade-scale horizon. It assumes continued dominance of NdFeB-type systems in high-performance applications and only gradual penetration of alternative motor technologies.

    NdFeB Magnets in EV and Industrial Motor Architectures

    NdFeB (neodymium-iron-boron) permanent magnets are widely used in:

    • Electric and hybrid vehicle traction motors, where high power density and efficiency are essential.
    • Industrial motors and drives operating under continuous duty cycles and elevated temperatures.
    • Robotics, automation systems, compressors, pumps, and HVAC units targeting energy efficiency standards.

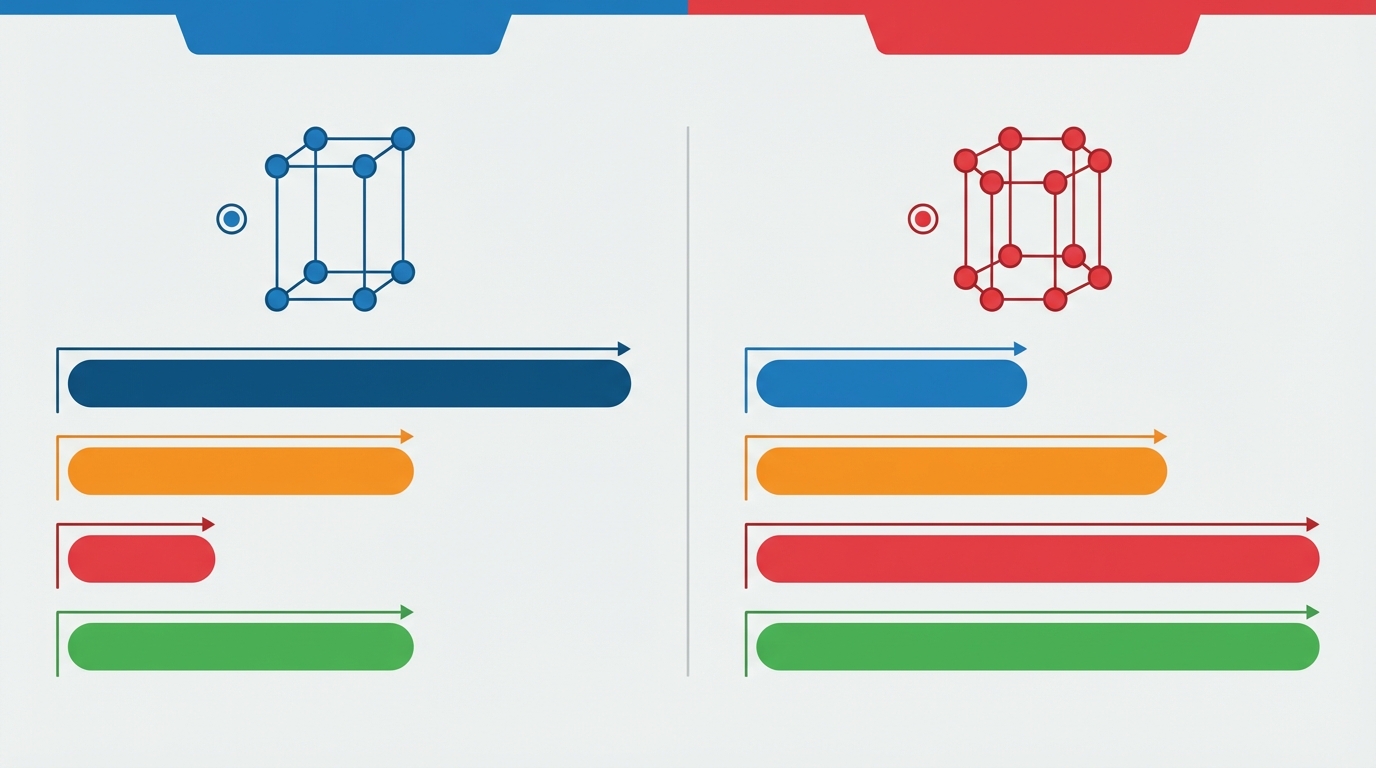
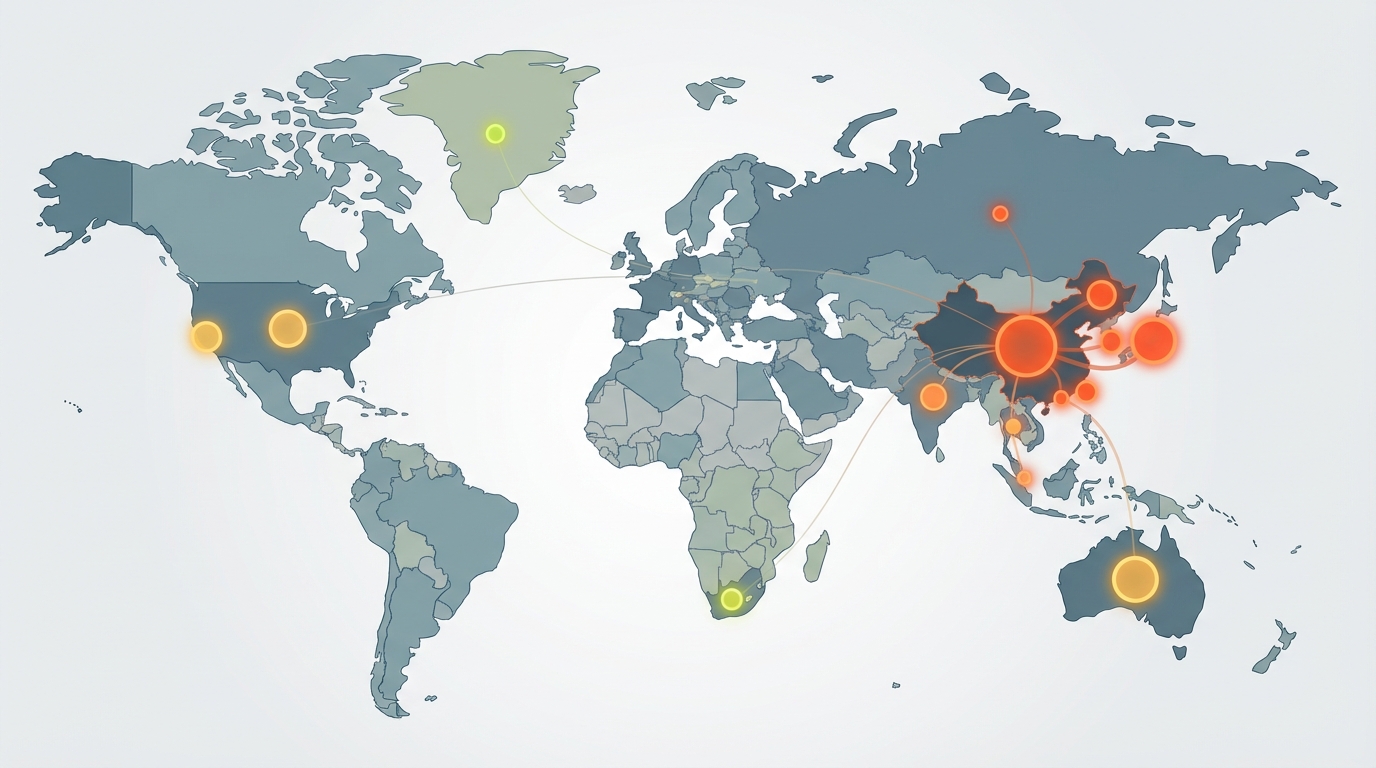
    To meet temperature and coercivity requirements in drive motors, NdFeB magnets are often partially doped with dysprosium and, in more demanding cases, terbium. These heavy rare earths are much scarcer and more geographically concentrated than the light rare earths (such as neodymium and praseodymium). Processing and magnet fabrication capacity for high-Dy/Tb compositions has historically been heavily concentrated in China and, to a lesser extent, in Japan.

    Across the past decade, several governments and corporate consortia have announced programs to expand non-Chinese mining, separation, and magnet-making capacity. However, as of the mid‑2020s, the bulk of high-performance NdFeB magnet production still traces back, directly or indirectly, to Chinese supply chains.

    INTERPRETATION: How This Changes the Industrial Risk Map

    The Ford Explorer halt is widely treated in technical and policy circles as a “wake-up call.” Materials Dispatch takes a harder view: it is not a wake-up call; it is the first widely visible casualty of a structural shift that was already underway. Several conditional readings follow from the facts above.

    From Theoretical Risk to Binding Constraint

    If a high-volume, mainstream vehicle platform can be halted for lack of rare earth magnets, then rare earth availability has crossed from “margin and sourcing issue” to “hard production cap” for Western automotive manufacturing. This event indicates that:

    • Contingency sourcing for NdFeB magnets did not keep pace with the concentration of supply and the escalation of policy risk.
    • Alternative motor architectures were not ready for rapid substitution at the required scale and certification level.
    • Internal risk models underestimated the probability and impact of simultaneous shortages in both raw heavy rare earths and finished magnets.

    Materials Dispatch has observed similar patterns at a smaller scale: industrial OEMs forced into last-minute redesigns to de-spec heavy rare earth content or shift torque curves because magnet suppliers quietly reallocated constrained material to defense or domestic customers. The Explorer halt extends this from engineering compromise into outright production stoppage.

    A Bifurcated Market: Two Price Systems, Two Realities

    Dysprosium at $1,125/kg and terbium at $4,500/kg in Western spot markets, trading at “massive premiums” over Chinese domestic prices, point to a de facto dual system:

    • Inside China (and partially in closely integrated neighbors), prices reflect a large, captive ecosystem with policy-mediated stability and privileged allocation.
    • Outside that ecosystem, prices reflect scarcity, policy risk premia, and the cost of ramping smaller, less integrated supply chains.

    If this divergence persists, Western OEMs are effectively competing not against Chinese companies at the same input price, but against Chinese companies with structurally cheaper and more secure access to the same performance-critical materials. That is not a commodity disadvantage; it is a technology platform disadvantage, because permanent magnets sit at the heart of EV drivetrains, high-efficiency motors, and a growing slice of industrial automation.

    McKinsey’s 59k-186k MT Projection: Demand Growth That Outruns Plausible Supply

    McKinsey’s projection of magnet rare earth demand climbing from about 59,000 to 186,000 metric tons by 2035 sketches a future in which demand growth is not incremental but exponential. If that scenario materializes, several implications follow:

    • Even aggressive, well-funded non-Chinese mining and separation ramp‑ups may only offset part of the increased pull, not replace existing Chinese dominance.
    • NdFeB magnet capacity, rather than ore availability, is likely to remain the primary bottleneck, especially for high-Dy/Tb compositions.
    • Product designers and platform planners face a moving constraint: what is technically optimal (high-Dy NdFeB) may be structurally unreliable in volume.

    It is plausible that, under the high-demand end of this range, entire EV and industrial product segments will be defined more by magnet allocation than by consumer demand or assembly capacity. In that world, the Explorer halt looks less like an outlier and more like the first case study.

    NdFeB Shortages: How They Cascade Through EV and Industrial Motors

    NdFeB magnet shortages do not simply reduce output linearly. They force triage. Materials Dispatch has observed procurement and engineering teams forced into difficult allocations when magnet supply tightens:

    • Prioritizing magnets for flagship EV and hybrid models while delaying lower-margin variants or ICE-electrification upgrades.
    • Redirecting high-Dy/Tb compositions to applications with the harshest duty cycles (towing, fleet, off‑highway, industrial drives), leaving others with downgraded or redesigned motor options.
    • Shifting some product lines to ferrite-based or induction motors, accepting trade-offs in efficiency, weight, or package size.

    In industrial motors, similar patterns emerge: high-efficiency, premium motors continue to receive NdFeB magnets, while cost-sensitive segments risk a slide back toward less efficient technologies. This undercuts regulatory and corporate energy-efficiency objectives and complicates planning for utilities and grid operators expecting certain efficiency baselines in new industrial loads.

    Governance Failures: When “Components” Were Treated Like Commodities

    One uncomfortable conclusion from the Explorer incident is that many OEM governance structures treated magnets as generic components, not strategic chokepoints. In multiple supplier audits, Materials Dispatch has seen:

    • Magnet supply chains mapped only to Tier 1 motor suppliers, with little visibility into upstream rare earth sourcing or processing.
    • Risk registers that captured rare earths at the level of “critical materials” but did not tie them explicitly to model-specific production constraints.
    • Capital allocation that favored visible end-assembly capacity over midstream partnerships in metals-to-magnets processing.

    When dysprosium and terbium markets tightened, this lack of granularity translated into slow reaction times. The system was optimized to negotiate prices, not to secure physical availability under stress. By the time the magnet shortfall reached the Explorer line, the buffer of supplier inventories, alternative formulations, and short-term substitution options was already exhausted.

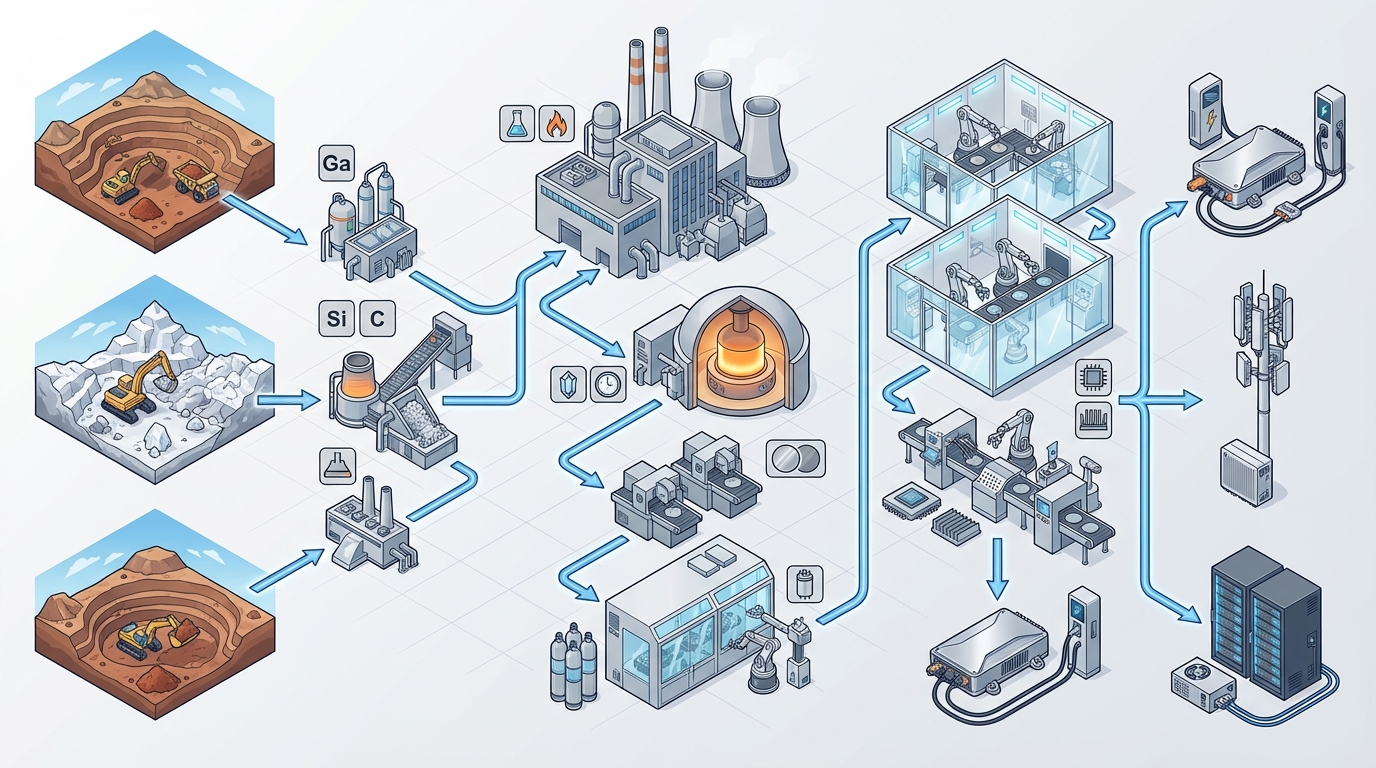
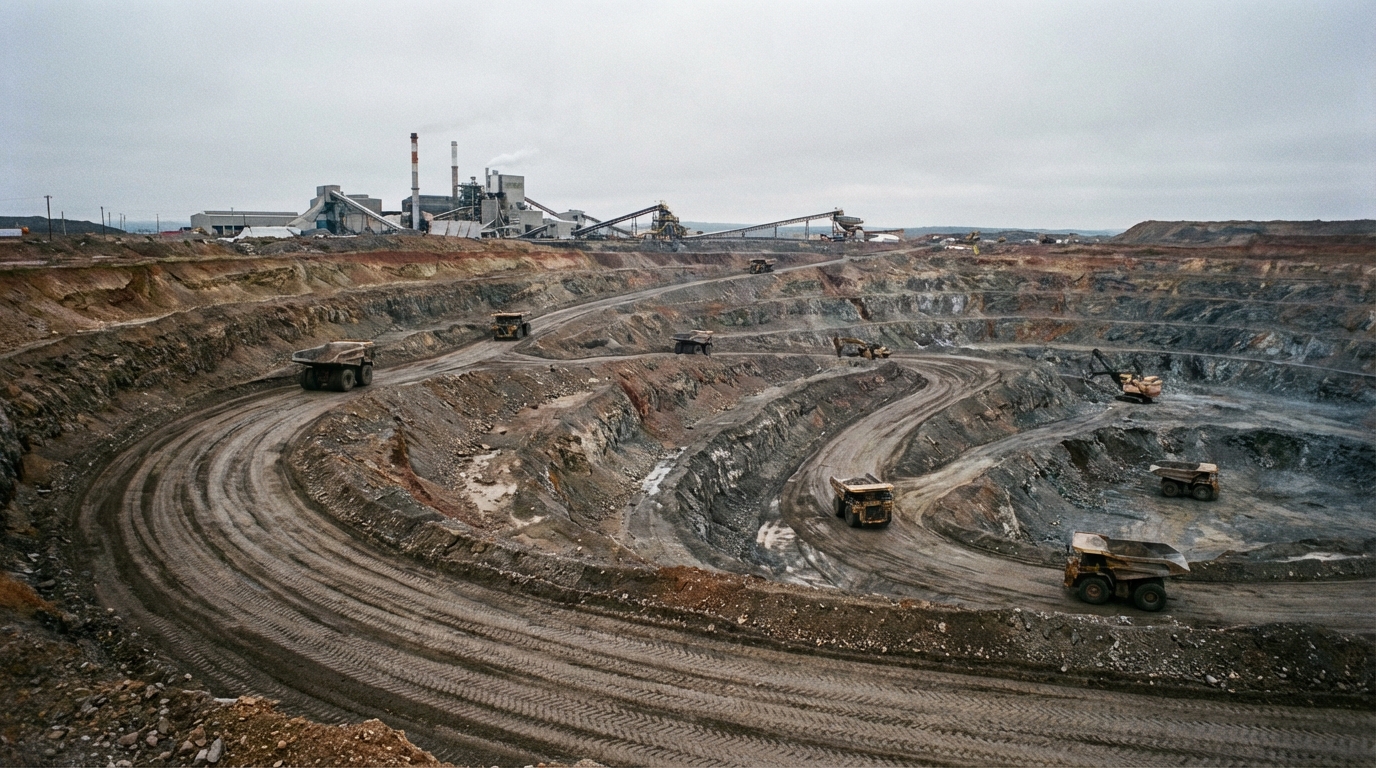
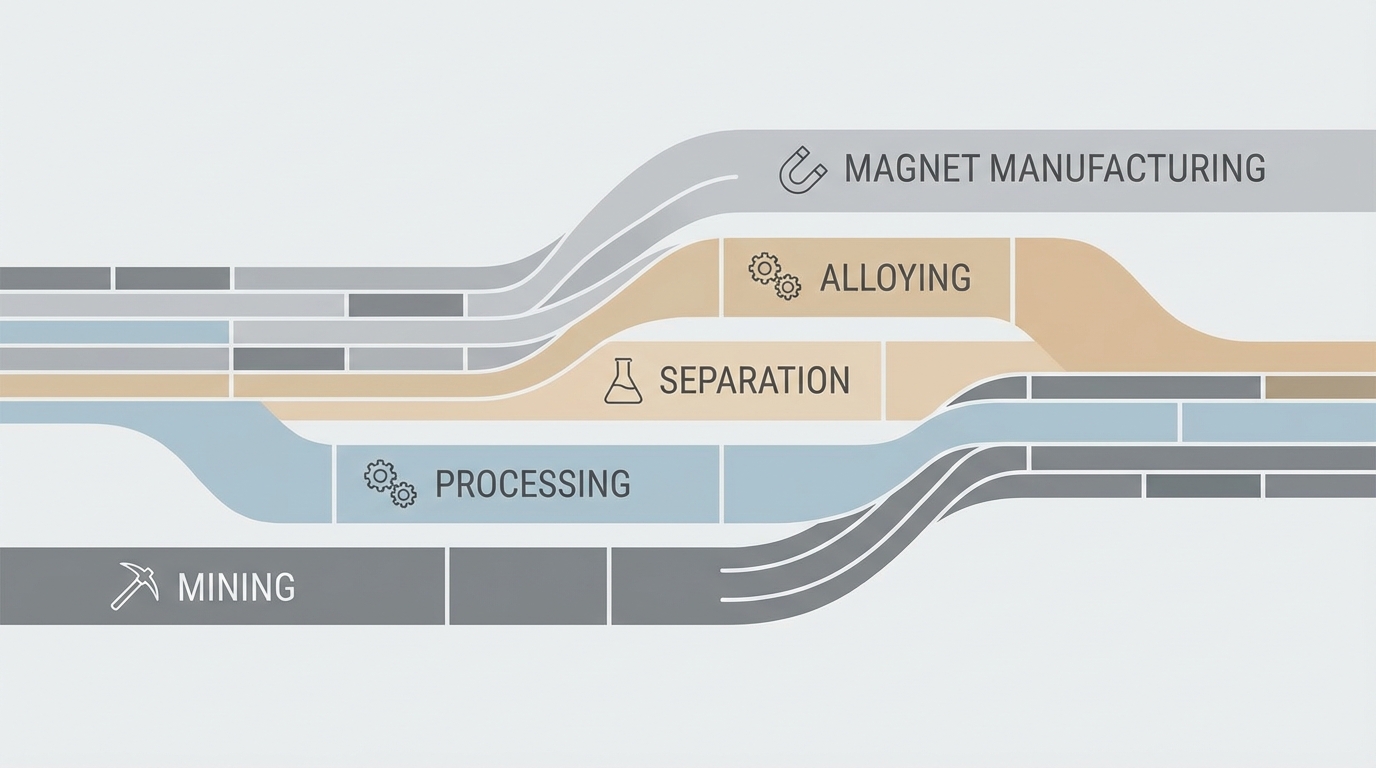
    Policy Focus Misaligned: Mines vs. Magnets

    Western policy responses in the early 2020s leaned heavily toward mine development and early-stage processing: supporting new rare earth projects, streamlining permitting, and funding separation plants. Those steps address part of the problem, but the Explorer halt argues that the system bottleneck now sits further downstream:

    • Finished magnet capacity, particularly for high-coercivity NdFeB variants, remains concentrated in a small number of jurisdictions.
    • Qualification cycles for new magnet plants into automotive and industrial platforms are long and complex, involving safety, reliability, and warranty considerations.
    • Without robust metals-to-magnets infrastructure, new mines simply reroute ore back into the same constrained processing ecosystems.

    If policy and corporate capital continue to over-weight upstream projects while under-weighting magnet manufacturing, then similar production halts are likely to appear in other vehicle programs and in industrial sectors. The Explorer case is best read as a stress test that the current configuration failed.

    Procurement and Design: Late Convergence of Two Worlds

    In practice, the rare earth crisis is forcing an overdue convergence between procurement and engineering. Historically, many organizations treated motor architecture as a fixed technical choice and magnet sourcing as a commercial exercise. The Explorer halt demonstrates that, for NdFeB-based systems:

    • Design choices (magnet type, Dy/Tb loading, operating temperature margins) now embed long-term geopolitical and supply risk.
    • Procurement strategies (single vs multi-sourcing, regional diversification, depth of transparency into Tier 2 and Tier 3) feed directly into production resilience.
    • Board-level risk appetite around dependence on Chinese-centric supply chains is no longer an abstract ethical or political discussion; it connects to unit output and employment.

    Materials Dispatch has already seen internal pressure rising from operations teams toward more integrated critical materials governance: cross-functional committees, deeper supplier audits, and formal scenario work on export controls and dual-pricing regimes. The Explorer halt is likely to accelerate that shift in other OEMs and industrial groups.

    WHAT TO WATCH: Indicators of Whether This Was an Exception or the New Normal

    Several observable signals will indicate whether the Explorer episode remains an outlier or becomes the template for Western industrial exposure to rare earths:

    • Magnet plant announcements outside China: Concrete progress on NdFeB magnet facilities in North America, Europe, and allied Asian countries, including actual commissioning and automotive qualification, not just groundbreaking ceremonies.
    • OEM disclosures on motor architectures: Shifts toward alternative motor technologies in new EV platforms, explicit mentions of reduced heavy rare earth dependence, or formal statements about magnet sourcing diversification.
    • Export policy and licensing changes: Any tightening or loosening in Chinese export regimes for heavy rare earths, metals, and magnet technologies, and corresponding responses from Japan, the EU, and the U.S.
    • Persistent price gaps: Ongoing or widening differentials between Chinese domestic and Western spot prices for dysprosium and terbium, signalling whether bifurcation is transitory or entrenched.
    • Defense procurement behaviors: Evidence that defense programs are locking in long-term magnet supply in ways that crowd out civilian demand, especially for high-spec NdFeB products.
    • Recurrent production disruptions: Any repeat of line halts or extended delays in other mainstream vehicle programs, heavy equipment lines, or industrial motor product families linked explicitly to magnet shortages.
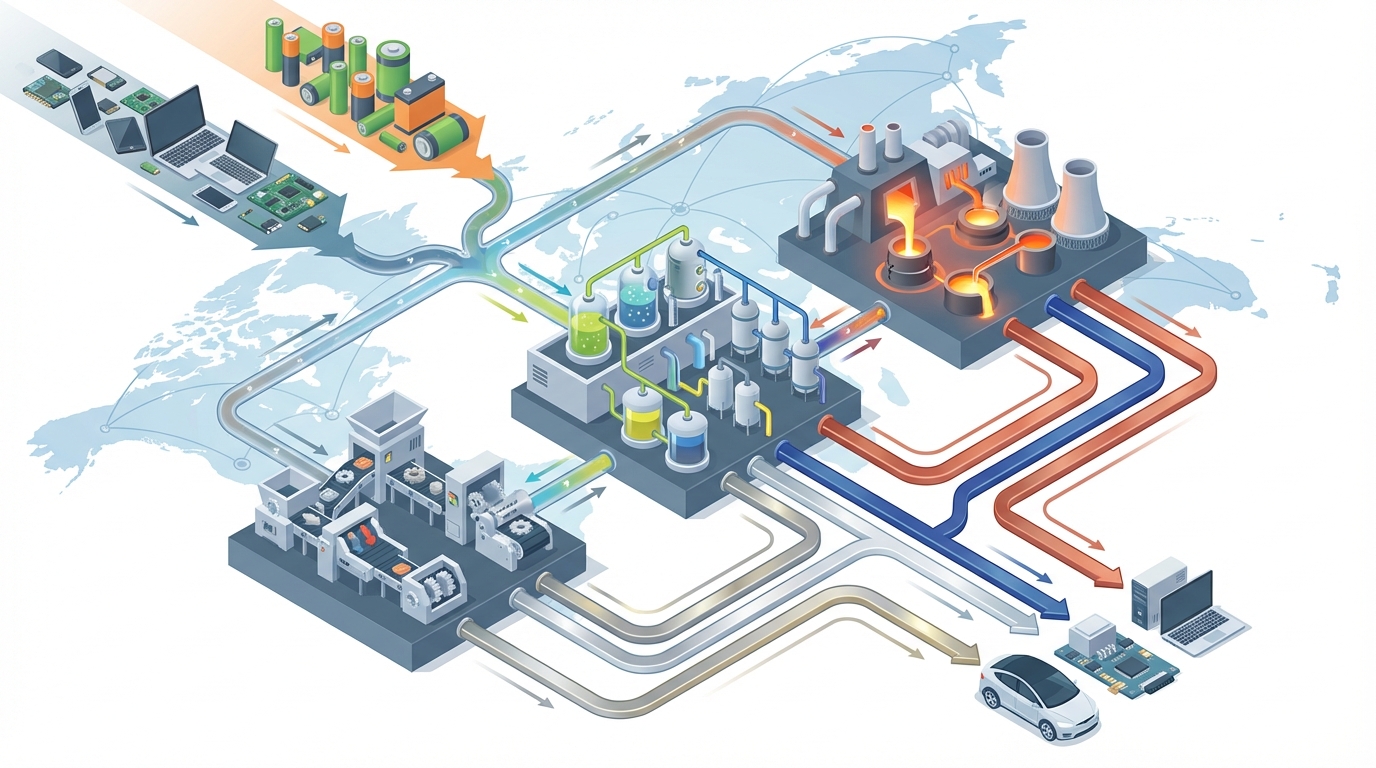
    • Recycling and substitution progress: Demonstrated, scaled use of rare earth recycling from end-of-life magnets and uptake of designs that lower or eliminate Dy/Tb content while retaining performance.

    Conclusion

    The 2025 Ford Explorer halt converts rare earth risk from a slide in a geopolitical deck into a visible hole in Western industrial output. Dysprosium and terbium’s elevated Western spot prices, far above Chinese domestic levels, expose a bifurcated system in which one industrial bloc controls both material and manufacturing depth, while another operates on residual access and price spikes.

    If McKinsey’s high-end demand projection is even directionally correct, the Explorer episode will not remain unique. NdFeB magnets, especially high-temperature, heavy rare earth variants, are now a principal bottleneck for EV and industrial motor deployment. The critical question is whether corporate governance and public policy realign quickly enough toward the midstream magnets chokepoint rather than remaining fixated purely upstream.

    For Materials Dispatch, this incident marks a clear transition: critical materials are no longer a background risk to be noted; they are a primary determinant of which factories run and which stand idle. Active monitoring of regulatory and industrial weak signals around magnets, heavy rare earths, and motor technologies will define how this story evolves.

    Note on Materials Dispatch methodology Materials Dispatch integrates continuous monitoring of regulatory texts and administrative decisions in key jurisdictions with close tracking of industrial project developments and technology roadmaps. This briefing cross-references those regulatory and market signals with detailed analysis of end-use technical specifications in automotive and industrial motors to assess where materials constraints translate into real-world production risk.

  • Albemarle Kemerton Shutdown: Why $4B Western Lithium Refining Failed

    Albemarle Kemerton Shutdown: Why $4B Western Lithium Refining Failed

    **Albemarle’s early‑2026 closure of the Kemerton lithium hydroxide plant in Western Australia, after more than $4 billion of sunk capital, is not a story of weak demand or short‑term price cyclicality. It is a demonstration that Western lithium refining, under current energy, labor, reagent, and scale conditions, sits structurally outside the Chinese cost curve-just as Fastmarkets projects 15-40% lithium demand growth in 2026 driven by AI data‑center energy storage. Policy subsidies have largely targeted concrete and steel, while the physics and industrial organization of Chinese chemical clusters continue to dictate the global cost base.**

    Four Billion Dollars and Nothing to Show for It: What Kemerton Reveals About Western Lithium Refining

    Albemarle’s decision in early 2026 to shut its Kemerton lithium hydroxide plant in Western Australia, after investing more than $4 billion, crystallizes a pattern that has been building for a decade. Major Western attempts to onshore lithium chemical processing repeatedly fail to reach durable competitiveness, even when backed by generous grants, tax credits, and strategic rhetoric.

    This closure did not occur in a demand recession. Fastmarkets’ 2026 outlook points to global lithium demand growth in the order of 15-40% year-on-year, with a significant share of the upside tied to large-scale battery systems for AI data centers and grid balancing. In other words: the market is expanding rapidly, particularly for high-spec lithium hydroxide suited to high-nickel and advanced LFP chemistries.

    Yet even with this demand backdrop, Kemerton could not defend its position on the cost curve against Chinese refiners. The facility was effectively priced out of the market by competitors drawing on cheaper energy, lower labor costs, integrated reagent supply, and above all, much larger and denser processing clusters. The outcome is a stranded asset in Western Australia and a reinforced reliance on Chinese midstream for an increasingly strategic metal.

    The operational question for the lithium value chain is therefore not whether demand will be there-it already is-but why Western plants like Kemerton remain structurally uneconomic and what that implies for supply security, industrial policy, and project design in the rest of this decade.

    Kemerton in Focus: Design, Ambition, and Early Shutdown

    Kemerton was conceived as a flagship Western lithium hydroxide monohydrate (LHM) facility, positioned close to world-class spodumene feedstock in Western Australia. Public disclosures and industry reporting describe a phased development: an initial train nominally designed around 24,000 metric tonnes per year (MT/year) of LHM, with later expansion paths toward roughly 50,000 MT/year. Feed would be sourced from hard-rock concentrate, notably from the Greenbushes operation, and processed via conventional alkaline conversion and crystallization routes.

    Commissioning began in the early 2020s, with ramp-up stretching over several years. By mid‑decade the plant had achieved meaningful output but never reached nameplate capacity at stable, competitive unit costs. Challenges cited in industry discussions included:

    • Energy costs significantly above initial engineering estimates, driven by gas and grid power pricing in Western Australia.
    • Labor intensity higher than benchmark Chinese plants, partly due to workforce expectations in a remote, high-wage jurisdiction and constraints on automation.
    • Reliance on imported or high-logistics-cost reagents, in contrast with Chinese clusters where sulfuric acid, soda ash, and other inputs are often produced on-site or nearby.
    • Difficulty diluting fixed overheads over relatively modest volumes compared with 100,000-200,000 MT/year Chinese refineries.

    By early 2026, Albemarle elected to suspend and then close operations, taking an impairment on the order of $4 billion associated with Kemerton-related assets. The plant moved to care-and-maintenance, with a residual cost just to keep the facility safe and compliant, but with no clear path back to competitive production under the existing operating environment.

    From a technical standpoint, Kemerton did not fail because the chemistry was exotic or unproven. The flowsheet was broadly conventional for hard-rock to hydroxide conversion. The breakdown came where Western projects most often stumble: at the intersection of power tariffs, labor and reagent overhead, and insufficient scale to offset these disadvantages. That is what turns a multi‑billion‑dollar project into a stranded chemical complex even as the underlying commodity remains in secular growth.

    Chinese vs Western Lithium Hydroxide Costs: A Structural Gap, Not a Cycle

    Market benchmarking for 2025–2026 places Chinese lithium hydroxide plants firmly at the low end of the global cost curve, with many operations clustered in integrated chemical hubs in Jiangxi, Sichuan, and other provinces. Western facilities such as Kemerton, even with subsidies, tend to sit in the upper quartile.

    Industry cost breakdowns for representative plants show the gap is not driven by a single factor but by stacked advantages. Chinese plants benefit from lower-cost, more stable industrial energy; cheaper and more flexible labor; vertically integrated or co‑located reagent supply; and, critically, large capacities that spread fixed costs over substantially higher volumes.

    Indicative comparative structures—based on 2025–2026 cost benchmarking for a large Chinese refinery versus Kemerton-type Western facilities—look as follows:

    Cost Component Chinese LHM Hub (Indicative) Western LHM Plant (Kemerton-Type) Observed Relationship Primary Drivers
    Energy Lower absolute power and fuel cost per kg, with baseload coal and hydro Several times higher energy cost per kg, using higher-priced gas and grid power Roughly 2–3× higher unit energy cost in Western plants Industrial power tariffs; fuel mix; lack of integrated captive generation
    Labor Lean crews per 50–100kt train; wage levels aligned with local manufacturing norms Higher headcount per tonne and substantially higher wages Often 4–5× labor cost per kg in Western facilities Wage differentials; roster structures; union agreements; automation gaps
    Reagents Acid, alkali, and auxiliary chemicals often produced in-cluster at low logistics cost Significant proportion imported or trucked over long distances Frequently 1.5–2× reagent cost per kg in Western plants Domestic chemical industry depth; by‑product integration; transport
    Capex Amortization Large single-site capacities (100–200kt/year) and high utilization Smaller trains (20–50kt/year) with slower ramp-up and lower utilization Capex per kg amortized cost several times higher in Western operations Scale economies; learning curves; construction cost base
    Overheads & Compliance Streamlined local permitting once zones are designated for chemicals Extensive environmental, community, and safety compliance overheads Higher fixed overhead per tonne in Western jurisdictions Regulation depth; reporting requirements; ESG expectations

    In the aggregate, industry data referenced in the prior analysis suggest Chinese lithium hydroxide cash costs in the high single to low double digits per kilogram equivalent, with Western plants more than double that level in many cases. The Kemerton experience, where internal cost estimates were reported well above typical Chinese benchmarks, is consistent with this structural pattern.

    Two points are critical. First, this is not simply about wage levels. Energy and reagents alone create a substantial gap. Second, subsidies that touch only initial capital cannot fundamentally alter operating-cost rankings over a plant life measured in decades. A Western refinery built with public support still pays Western power prices, Western wages, and Western reagent logistics for as long as it runs.

    Energy as the Hard Constraint: Power-Intensive Chemistry in High-Tariff Systems

    Lithium hydroxide production from hard-rock feed is highly energy-intensive. Typical flowsheets entail crushing, calcination or conversion, leaching, impurity removal, concentration, and crystallization. Each major unit operation draws on electrical or thermal energy, with industry benchmarks placing total consumption on the order of many tens of kilowatt-hours per kilogram of finished LHM, depending on feed grade and process design.

    Chinese plants often operate with access to low-tariff industrial electricity—frequently coal-based, sometimes supplemented by hydro or other sources. Power prices in major lithium hubs have historically been a fraction of those faced by electro-intensive industries in Western Australia, Europe, or parts of North America. In several documented cases, lithium refiners in China also benefit from preferential tariffs or local support measures as “strategic” industries within provincial plans.

    By contrast, Kemerton operated in a power system where wholesale prices reflected a mix of gas-fired generation, growing renewables penetration, and limited baseload coal. When gas prices spiked, or when renewable variability required peaking generation, delivered electricity costs rose materially. For a facility consuming large, relatively inflexible baseload power, this directly translated into volatility and elevation in unit production costs.

    Decarbonization policies add another layer. Western jurisdictions increasingly couple power prices with carbon costs, grid charges, and renewable support mechanisms. While these align with climate objectives, they act as a surcharge on every kilowatt-hour consumed by a refinery. Chinese provinces have also set decarbonization goals, but in practice coal capacity and supportive industrial tariffs have been maintained or expanded, providing lower and more predictable energy inputs for midstream chemical plants.

    This asymmetry is the crux: lithium hydroxide is an energy-constrained product. Locating electro-intensive refining inside high-tariff, carbon-priced, intermittency-challenged grids creates a baked-in disadvantage versus coal-backed, industry-prioritized grids—even before considering labor or reagents.

    Labor and Reagents: High-Cost Inputs in Fragmented Western Ecosystems

    Labor and chemical reagents are the next pillars of the structural gap. At Kemerton-scale plants, fixed staffing requirements—from control room operators and maintenance crews to environmental, safety, and administrative teams—are substantial. In Western Australia, wage levels, conditions under national employment law, and the need to attract skilled workers to remote locations drive a high labor cost base.

    Industry comparisons cited in prior analyses suggest that for roughly comparable output volumes, Chinese plants have operated with fewer employees and substantially lower average wages, resulting in per‑kilogram labor costs several times lower than at Kemerton-style facilities. Differences in automation, tolerance for manual operations, and workforce rostering all play a role, but the central fact is that refined chemical production has been sited in regions where manufacturing labor is priced accordingly.

    Reagents reinforce this disparity. Lithium hydroxide production relies heavily on acids (often sulfuric), alkalis (such as soda ash or lime), and a suite of process chemicals. Chinese lithium hubs are frequently embedded within or adjacent to extensive chemical industry clusters. Sulfuric acid can be a by‑product of metals or phosphate production; soda ash and lime are sourced from nearby integrated plants; freight distances are short; and intermediates may be transferred via pipelines or dedicated rail.

    In Western Australia, by contrast, critical reagents often travel long distances by truck or ship. Pricing reflects not only global commodity values but freight, handling, and storage in relatively small and dispersed markets. The result, as reflected in cost benchmarking, is reagent cost per kilogram of lithium hydroxide commonly 1.5–2 times the Chinese level—again, before considering any carbon penalties or environmental levies associated with reagent production and use.

    Scale and Cluster Effects: Why 20–50kt Western Trains Cannot Match 100–200kt Chinese Hubs

    Scale is the multiplier that magnifies all of the above. Chinese lithium hydroxide capacity is heavily concentrated in very large plants or clusters, with individual sites commonly designed or expanded to 100,000–200,000 MT/year or more. These hubs share utilities, maintenance infrastructure, effluent treatment, and sometimes workforce training and housing.

    Learning curves in chemical processing tend to be steep. As cumulative output increases, operators refine operating practices, debottleneck critical sections, and optimize reagent and energy consumption. Fixed overheads—from plant management to laboratory operations—are spread over more tonnage, and procurement can be negotiated on large annual volumes.

    Western plants such as Kemerton have been engineered more cautiously, often in 20,000–50,000 MT/year trains, sometimes with multi‑phase expansions that are delayed or reprioritized when markets turn volatile. In such configurations, fixed costs are locked in early, but the tonnage over which those costs are amortized remains modest. If utilization then drops below design—due to ramp-up issues, price cycles, or feedstock constraints—the unit cost spikes further.

    Material Dispatch’s reading of cost-curve analyses is that even if a Western refinery matches Chinese plants on process efficiency, the combination of smaller scale and higher-input costs keeps it outside the low-cost quartile. That is precisely the position Kemerton ended up in: technically operational, but too high on the global cost curve to run sustainably at mid‑cycle hydroxide prices.

    AI Data Centers as a New Lithium Load: Demand Rising into Structural Midstream Weakness

    While the midstream struggles, demand signals from downstream are strengthening. Fastmarkets’ 2026 scenarios point to global lithium demand growth in the range of 15–40% year-on-year. A notable share of that increment is expected to originate not only from electric vehicles, but from stationary energy storage supporting AI data centers and grid stability.

    Large-scale AI data centers consume vast quantities of power; operators increasingly pair these facilities with battery energy storage systems (BESS) for uninterruptible power supply (UPS), peak shaving, and participation in ancillary grid services. The scale is already measured in hundreds of gigawatt-hours per year of installed storage capacity across hyperscale cloud providers and major technology firms.

    In this application, lithium iron phosphate (LFP) chemistries are often favored for their safety profile, cycle life, and cost structure. that said, the lithium chemical feeding both LFP and many nickel-rich chemistries is increasingly lithium hydroxide, especially where tighter impurity specifications are required. AI data center BESS tend to demand high-purity hydroxide with low levels of sodium, calcium, and heavy-metal contaminants, to minimize degradation and ensure predictable performance over long duty cycles.

    Industry analyses referenced in the prior work suggest that, given the value density of AI workloads and the cost of downtime, these operators can absorb lithium hydroxide prices in the low-to-mid-teens dollars per kilogram without fundamentally derailing project economics. Hardware, construction, and power infrastructure dominate total cost of ownership; cathode chemicals are important but not decisive at the margin.

    This creates a paradox. On one hand, high-value AI storage demand is relatively price-inelastic in the ranges currently forecast for 2026. On the other, Western hydroxide plants priced well above the Chinese cost curve still cannot survive in that environment, because of competition from lower-cost imports. Rising demand does not rescue structurally uncompetitive refineries; it steers more volumes toward whichever midstream is structurally cheapest, which today remains overwhelmingly Chinese.

    2026 Market Balance: Fastmarkets Scenarios and the Midstream Bottleneck

    Fastmarkets’ 2026 lithium outlook sketches a market that is tight but not catastrophically short. In their scenarios, aggregate lithium demand reaches well into the million‑plus tonne LCE range, with growth of roughly 15–40% over 2025 depending on EV adoption trajectories and stationary storage buildout. Within that, hydroxide continues to grow share relative to carbonate as high-nickel cathode deployments persist and advanced LFP variants strengthen.

    On the price side, Fastmarkets indicates a band for 2026 lithium hydroxide spot assessments centered in the low-to-mid-teens dollars per kilogram. Carbonate prices remain somewhat lower but are influenced by the same underlying supply-demand fundamentals. Importantly, these price ranges are not high enough, under current Western cost structures, to shift Kemerton-like plants into the first half of the cost curve on a sustained basis.

    Supply on the mining side looks less constrained. Hard-rock projects in Australia and lepidolite or brine assets elsewhere can collectively support significant LCE volumes, at least under current forward plans. The choke point is the chemical conversion stage: taking spodumene or other feedstock and turning it into battery-grade hydroxide. This is precisely the stage where Western capacity such as Kemerton has struggled to compete.

    The result is a midstream bottleneck that is geographic rather than purely volumetric. Global conversion capacity exists and is expanding, but it is disproportionately located in China. Western closures remove non-Chinese conversion options just as AI and EV demand deepen reliance on high-purity hydroxide. For supply chain managers and policy analysts, this combination—strong demand growth plus regionally concentrated refining—defines the risk envelope more than any single year’s price forecast.

    Why Subsidies Have Not Closed the Gap: Capex Support vs Opex Reality

    Over the first half of the 2020s, Australia, the United States, and the European Union collectively directed many billions of dollars in grants, loans, and tax credits toward critical minerals processing. Kemerton itself benefited from Australian state and federal support; similar patterns are visible in North American and European projects targeting lithium, nickel, and other battery metals.

    Most of this support, however, has been structured around capital expenditure: partial funding of plant construction, accelerated depreciation, or subsidized debt. These mechanisms improve project financing metrics and can bring first production forward by a few years. They do not change the fundamental operating environment into which the plant is born.

    If an LHM refinery faces electricity prices several times higher than a Chinese counterpart, pays labor rates multiple times higher, purchases reagents from fragmented supply chains, and operates at half the scale, then a one‑time capital contribution may reduce the initial hurdle but leaves the long-term unit cost differential intact. Over a 20‑ to 30‑year asset life, that operating gap dominates the economics.

    Kemerton’s trajectory is emblematic. Despite the backing and strategic designation, the plant’s all‑in costs reportedly remained well above those of Chinese peers. Once prices normalized from the extreme spikes earlier in the decade, the refinery’s structural disadvantages were exposed. The decision to close was effectively an acknowledgment that subsidized capex cannot indefinitely carry an uncompetitive opex profile in a globally traded commodity.

    From an industrial policy standpoint, this underlines an uncomfortable reality: Western efforts that treat refining primarily as a political or security project, without aligning energy, chemical, and labor ecosystems around it, risk creating expensive, short-lived assets. The physics of power-intensive chemical processing does not bend easily to legislative timelines.

    Observed Responses Across the Value Chain: How Actors Are Adapting

    The Kemerton closure has not occurred in isolation. It forms part of a sequence of delays, mothballings, and scope reductions at Western midstream projects over the last several years. Across the lithium value chain, several patterns in behavior are already visible.

    First, there is an observable tilt toward upstream exposure. Hard-rock spodumene projects in resource-rich regions such as Western Australia retain attractive industrial positions. Their cost structures are dominated by mining and concentration rather than high-tariff power or complex reagent ecosystems. Industry commentary points to strong operating margins at established assets, making upstream supply less structurally vulnerable than midstream refining in high-cost jurisdictions.

    Second, battery and cathode producers have increasingly channeled conversion volumes through large Chinese hubs, sometimes via tolling arrangements or long-term offtake with integrated groups. Massive clusters in provinces such as Jiangxi or Guizhou, with hundreds of thousands of tonnes of LHM capacity, function as global service centers for both domestic and foreign cathode makers. The effective cost and scale advantages of these hubs remain difficult to replicate elsewhere.

    Third, some downstream actors are exploring a hybrid approach: partial diversification into non-Chinese refining for a minority of their volume, even at higher cost, while keeping the bulk of tonnage anchored in lower-cost Chinese supply. This approach accepts a premium for a “secure” tranche of material while recognizing that relying exclusively on high-cost Western refineries would erode competitiveness in price-sensitive EV markets.

    In parallel, AI data center and grid-storage developers appear, based on published specifications and procurement disclosures, to focus more on security of delivery and system integration than on shaving the last dollars per kilogram from LHM input prices. Where overall project economics can tolerate lithium hydroxide in the low-to-mid-teens per kilogram, the primary concern becomes physical availability and long-term contracts, not absolute minimal cost.

    For all these actors, Kemerton is less a surprise than an explicit data point: a case where a technically functional, well-funded Western refinery still exited because it was fundamentally misaligned with the global cost structure. That realization is beginning to filter into project design, contract strategy, and regulatory debates.

    Conclusion: Kemerton as a Structural Warning, Not a Cyclical Casualty

    Albemarle’s Kemerton closure, and the more than $4 billion effectively written off with it, is not an aberration caused by temporary market weakness. It is a case study in how midstream chemical assets behave when they are placed in structurally high-cost environments and asked to compete with deeply integrated, large-scale Chinese clusters.

    Fastmarkets’ projection of 15–40% lithium demand growth in 2026, amplified by AI data center storage requirements, confirms that the problem is not lack of customers for lithium hydroxide. The issue is where that hydroxide is most economically produced, and under what energy, reagent, labor, and regulatory regimes. At present, Western efforts have not altered the answer in their favor.

    For Materials Dispatch, Kemerton marks an inflection point in how Western lithium refining projects are evaluated. It underscores that structural cost position, not policy enthusiasm or short‑term price spikes, determines which plants survive a full cycle. Our team is actively tracking weak signals that could shift this equation: changes in Chinese export policies, new Western power-tariff regimes for electro-intensive industries, evolving AI data center storage specifications, and any credible moves toward integrated reagent and energy ecosystems around non-Chinese refineries.

    Note on Materials Dispatch methodology Materials Dispatch integrates continuous monitoring of regulatory texts, such as critical minerals strategies and trade rules, with granular market data from price reporting agencies and company disclosures. That is combined with technical analysis of process routes, energy and reagent intensity, and end-use performance specifications in sectors like EVs and AI data centers, to build a coherent picture of where along the value chain structural risks and advantages actually sit.

  • GaN vs SiC for Power Electronics: Physics and Supply Risk

    GaN vs SiC for Power Electronics: Physics and Supply Risk

    Gallium nitride (GaN) and silicon carbide (SiC) are the two wide-bandgap semiconductors reshaping power electronics between 650 and 1200 V, and as of 2025 they split the field along clear lines. SiC owns high-voltage robustness and thermal headroom for EV traction and grid hardware; GaN owns switching speed and density in servers, fast chargers, and compact converters, provided gate driving is tightly controlled and gallium sourcing stays reliable. The real question is not GaN or SiC, but which failure modes and material constraints are acceptable at each node of the power train.

    GaN vs SiC: Why the Choice Hinges on Voltage and Failure Modes

    Wide-bandgap (WBG) semiconductors have moved from theory into mainstream power hardware. GaN and SiC devices now sit at the core of EV inverters, onboard chargers, solar inverters, telecom rectifiers, and increasingly, data center power shelves. Underneath the commercial narrative, the physics of gallium nitride and silicon carbide define very different operating envelopes, reliability profiles, and raw-material dependencies. This tech deep dive on gallium nitride vs silicon carbide for power electronics focuses on how the intrinsic materials, device architectures, and supply chains interact to set real limits on what these technologies can credibly deliver between roughly 650-1200 V.

    The headline contrast is straightforward: SiC excels when bus voltages and power levels climb, thermal margins tighten, and modules face sustained stress; GaN dominates where switching frequency, power density, and fast transient control are paramount. The reality in production, however, is more nuanced. Gate drive constraints, dynamic loss mechanisms, substrate choices, and gallium availability create second-order effects that are increasingly visible in 2024–2025 hardware platforms.

    1. Material Fundamentals: Where Physics Sets Absolute Limits

    At the foundation, GaN and SiC share the defining attributes of wide-bandgap semiconductors: high breakdown fields, low intrinsic carrier concentrations, and tolerance for elevated junction temperatures. These traits underpin the disruption of traditional silicon IGBTs and MOSFETs. Yet GaN and SiC diverge enough at the material level that they naturally occupy different regions of the voltage–frequency–power map.

    1.1 Bandgap, Breakdown Field, and Voltage Headroom

    Silicon’s bandgap of around 1.1 eV has long been a bottleneck for high-voltage, high-temperature power electronics. SiC, typically in its 4H polytype, offers a bandgap of roughly 3.2–3.3 eV, while GaN sits slightly higher near 3.4 eV. A wider bandgap suppresses intrinsic carrier concentration by orders of magnitude at a given temperature, which in practice means much lower leakage currents and far higher breakdown fields for the same device geometry.

    For SiC, the critical electric field is roughly an order of magnitude higher than silicon. This enables 1200 V and 1700 V MOSFETs and diodes with comparatively thin drift regions and acceptable on-resistance. In EV traction inverters and high-power solar stages, this high breakdown strength translates directly into die area savings or extra margin against overvoltage events and surge conditions.

    GaN’s breakdown field is even higher in theory, but the way GaN is realised in power devices constrains that advantage. Most commercial GaN power transistors today are lateral high-electron-mobility transistors (HEMTs) grown epitaxially on foreign substrates (silicon, sapphire, or SiC). The lateral geometry and substrate lattice mismatch make it challenging to scale beyond the 650–900 V class without running into dynamic avalanche, trapping, and long-term reliability concerns. As a result, GaN currently dominates the 100–650 V space and only selectively pushes higher, while SiC comfortably covers 650–1200 V and beyond.

    The practical implication: SiC’s bandgap and breakdown field convert into system-level voltage headroom and transient tolerance; GaN’s superior theoretical breakdown field is constrained by device structure and substrate integration rather than the material in isolation.

    1.2 Electron Mobility, 2DEG Formation, and Velocity Saturation

    The defining feature of GaN in power electronics is the formation of a two-dimensional electron gas (2DEG) at the AlGaN/GaN heterointerface. This 2DEG yields very high electron mobility compared with bulk SiC, typically measured at more than 2000 cm²/V·s in optimised structures, versus around 800–1000 cm²/V·s for 4H-SiC and roughly 1400 cm²/V·s for silicon. Crucially, GaN sustains this mobility at high sheet charge density, enabling low channel resistance and very fast switching.

    Both GaN and SiC exhibit high electron saturation velocities, significantly higher than silicon. That trait allows short channels and aggressive scaling of device dimensions without catastrophic mobility degradation at high electric fields. In practice, however, GaN’s heterostructure channel outperforms SiC MOSFET channels at high frequencies. This shows up in device figures of merit that combine on-resistance with charge-related switching losses, where GaN often delivers a lower RDS(on)·QG and RDS(on)·QOSS than similarly rated SiC devices in the sub‑1 kV range.

    That mobility edge is the physical reason why GaN can credibly support switching in the MHz range in real power converters, while SiC generally finds its economic sweet spot in the tens to hundreds of kHz range. The cost of that speed is tighter control of parasitics, layout, and gate drive, which becomes a central operational constraint in high-density GaN designs.

    1.3 Thermal Conductivity and Heat Flow

    Thermal conductivity is one of SiC’s blunt advantages. Bulk SiC is substantially more thermally conductive than silicon, while GaN’s effective thermal performance is heavily influenced by its substrate and epitaxial stack. Typical values cited in industry literature place SiC near several hundred W/m·K, with silicon below that, and GaN on silicon or sapphire even lower once interface resistances are included.

    In operational terms, this means SiC devices can sustain higher power densities and junction temperatures before hitting thermal runaway or excessive derating. In traction inverters, where modules are pushed hard under variable cooling conditions, SiC’s ability to maintain safe operation with elevated junction temperatures is often more decisive than a marginal efficiency advantage. Thermal headroom becomes a kind of “safety capital” that can absorb real-world deviations from ideal cooling or load profiles.

    GaN responds differently to thermal stress. GaN devices can exhibit significantly lower switching losses and lower RDS(on) at a given voltage rating, which means that the total heat generated in a given converter stage may be lower than for SiC or silicon. But when localised hotspots do form-especially near the gate or in the buffer-lower substrate thermal conductivity and interface resistance can accelerate local temperature rises. Consequently, GaN’s thermal story is strongly coupled to advanced packaging, careful layout, and often to the adoption of high-performance, low-inductance packages (e.g., embedded packages, laminate-based modules).

    Property (Indicative) SiC GaN Silicon (Reference)
    Bandgap ≈3.2–3.3 eV ≈3.4 eV ≈1.1 eV
    Typical Power Voltage Range 650–1700 V and above 100–650 V (selectively to ~900 V) Up to ~600–900 V
    Electron Mobility (order of magnitude) ~103 cm²/V·s >2×103 cm²/V·s (2DEG) ~1.4×103 cm²/V·s
    Thermal Conductivity (relative) High Moderate (substrate-limited) Moderate
    Dominant Device Form Vertical MOSFET/diode Lateral HEMT (emerging vertical) Vertical MOSFET/IGBT
    Indicative comparison of GaN, SiC, and silicon material and device characteristics used in power electronics.

    2. Device Architectures and Switching Loss Mechanisms

    Material physics alone does not decide outcomes. Device structure, charge storage, and parasitic behavior determine whether those theoretical advantages translate into lower loss and higher reliability in actual converters.

    2.1 SiC MOSFETs: Vertical, Rugged, and Thermally Tolerant

    SiC power devices are predominantly vertical MOSFETs and diodes. The current path runs perpendicular to the wafer surface, with a thick drift region supporting high voltage and a channel formed under the gate, similar in topology to silicon MOSFETs. This vertical architecture scales naturally to higher voltages by adjusting drift region thickness and doping, at the expense of on-resistance and die area.

    SiC MOSFETs still carry some of the limitations of MOS interfaces: channel mobility degradation due to interface traps, threshold voltage shifts under stress, and the need for relatively high gate drive voltages (often in the ±15–20 V range). Their intrinsic body diode also introduces reverse recovery charge, although substantially less than silicon IGBTs. At high switching speeds, charge-related losses in the output capacitance and body diode tail currents begin to dominate, typically constraining economic switching frequencies to a few hundred kHz in high-power applications.

    The trade-off is attractive for traction inverters, industrial drives, and large solar inverters: slightly higher switching losses than GaN in exchange for straightforward high-voltage scaling, strong avalanche ruggedness, and robust short-circuit withstand capability when properly derated.

    2.2 GaN HEMTs: Lateral 2DEG Channels and Ultra-Fast Switching

    GaN power devices are typically lateral enhancement-mode HEMTs. The core conduction channel is the AlGaN/GaN 2DEG, which offers low resistance and high speed. Early devices were depletion-mode, requiring complex gate drive or cascode arrangements; contemporary power GaN generally uses p-GaN or gate-injection structures to create enhancement-mode behavior with gate swings compatible with silicon driver ecosystems.

    These devices have two major electrical advantages. First, the absence of an intrinsic body diode eliminates reverse recovery losses. Reverse conduction occurs through the channel itself, which, when properly driven, can significantly reduce Qrr-related losses and EMI. Second, output capacitance and gate charges are typically much lower at a given voltage rating than in SiC MOSFETs. Combined with the high electron velocity in the 2DEG, this translates into extremely short switching times and low ESW at moderate voltages.

    Schematic comparison of GaN HEMT and SiC MOSFET device structures.
    Schematic comparison of GaN HEMT and SiC MOSFET device structures.

    The downside is that such fast switching makes the design hypersensitive to stray inductance, layout, and coupling. Turn-on and turn-off transients can easily create overshoot, ringing, or false triggering if Miller capacitance and gate impedance are not controlled. In other words, GaN’s physics gives access to MHz-class operation, but at the price of much tighter system-level engineering discipline.

    2.3 Conduction vs Switching Losses: Where Each Technology Wins

    Losses in power devices more or less decompose into conduction losses (I²·R) and switching losses (proportional to V·I·tSW·f). SiC’s lower RDS(on) scaling at high current and high voltage tends to minimise conduction losses in high-power, high-duty-cycle applications. GaN, with its lower capacitances and faster intrinsic dynamics, reduces switching losses dramatically at moderate voltages and currents, especially in hard-switched topologies.

    In a high-frequency DC-DC stage or a totem-pole PFC operating below roughly 650 V, GaN frequently yields both higher efficiency and much higher power density by enabling several-fold frequency increases. This shrinks magnetics and reduces the volume of passives. In a 800–1200 V traction inverter, by contrast, SiC’s conduction and surge robustness gains dominate; pushing GaN to equivalent blocking voltages in lateral form would incur unacceptable reliability and derating penalties at current manufacturing maturity.

    One analytical insight emerging from field data in 2023–2024 is that SiC’s most valuable contribution in harsh environments is not strictly peak efficiency; it is the enlargement of the safe operating area (SOA). That extra robustness under overvoltage, temperature excursions, and repetitive surge events often determines long-term system behavior more than small percentage-point differences in nameplate efficiency.

    3. Reliability, Degradation Mechanisms, and Failure Modes

    Reliability physics is where GaN and SiC diverge most clearly. Early failures, long-term drift, and catastrophic breakdown follow different patterns in the two technologies. Understanding these patterns is essential for deciding where GaN and SiC are credible for mission-critical deployments versus where they remain more suitable for consumer or short-lifetime equipment.

    3.1 SiC: Channel Instabilities vs Bulk Ruggedness

    SiC’s reliability story has evolved rapidly over the last decade. Early-generation devices suffered from significant threshold voltage drift and gate oxide reliability concerns, especially under high-temperature gate bias. Process refinements, improved gate oxides, and defect engineering in epitaxial layers have markedly reduced these issues, but they have not vanished entirely.

    Known physics-driven concerns include bipolar degradation (e.g., stacking faults initiated under forward conduction in bipolar devices), basal plane dislocations, and interface trap-related mobility degradation in MOS channels. Modern 4H-SiC processes have largely mitigated the worst effects, and many automotive-qualified devices now demonstrate long mean time to failure (MTTF) even at elevated junction temperatures. Nonetheless, conservative derating, robust gate driver design, and close attention to avalanche limits remain central to SiC reliability engineering.

    In return, SiC offers strong avalanche capability and robust short-circuit withstand for carefully specified durations, which is critical for traction inverters and medium-voltage drives. When failures occur, they are often linked to repetitive overvoltage or inadequate thermal design rather than intrinsic material weakness under nominal operating envelopes.

    3.2 GaN: Trapping, Dynamic RDS(on), and Buffer Reliability

    GaN’s reliability challenges are tied closely to its heteroepitaxial nature and lateral geometry. The AlGaN barrier, GaN buffer, and interfaces to foreign substrates introduce defect populations that interact with hot electrons and high electric fields. Under switching stress, charge trapping in the barrier or buffer can cause dynamic RDS(on) increases—sometimes significant—relative to static datasheet values.

    This dynamic RDS(on) rise effectively means that a device operated under realistic high-voltage switching can run hotter and less efficiently than predicted from DC measurements alone. In automotive onboard chargers and industrial PFC stages, this has historically complicated design margins. Newer device generations introduce techniques such as carbon-doped buffers, field plates, and optimised barrier layers to suppress trapping and current collapse, but long-term field data in harsh environments remains more limited than for SiC.

    Gate reliability is another focus area. Enhancement-mode GaN HEMTs often operate with relatively narrow gate voltage windows compared with SiC MOSFETs, and are more sensitive to overshoot, undershoot, and oscillations. Tight control of gate driver slew rates, ringing, and Miller coupling is therefore not optional in high-reliability GaN deployments; it is a foundational part of the reliability budget.

    3.3 Mission Profiles: Where Field Data Is Converging

    Accelerated life testing and field returns increasingly illustrate a pattern. SiC has become the default WBG technology in automotive traction inverters, high-power solar inverters, and other applications where lifetimes of more than a decade under strong thermal and electrical cycling are expected. GaN has become the technology of choice in fast chargers, laptop and phone adapters, compact server power supplies, and telecom rectifiers, where operating voltages are lower and mission lifetimes, while still significant, are less extreme than in grid or traction hardware.

    Application map showing where GaN and SiC are best suited across voltage and frequency.
    Application map showing where GaN and SiC are best suited across voltage and frequency.

    A key emerging observation is that GaN can achieve silicon-like or better reliability in consumer and datacom-grade conditions, provided that gate driving and thermal design are executed with tight control. In heavy-duty industrial or transportation environments with wide ambient swings, high surge exposures, and complex EMC/EMI constraints, SiC retains a structural advantage stemming from its vertical device geometry and bulk material robustness.

    4. Application Mapping: Where GaN and SiC Compete or Complement

    On paper, both GaN and SiC can serve across a wide power and voltage range. In practice, economics, packaging, and reliability push the technologies into partially overlapping but distinct application domains.

    4.1 EV Powertrains and High-Voltage Mobility

    EV traction inverters at 800 V class and above are now heavily associated with SiC. The combination of 1200 V rated MOSFETs, high thermal conductivity, and strong avalanche behavior aligns well with the needs of traction drives subjected to repetitive load cycling, harsh vibration, and non-ideal cooling. SiC enables significant reductions in conduction loss compared with silicon IGBTs, supports compact motor inverters, and simplifies cooling system design in many architectures.

    GaN’s current role in EVs is more concentrated in onboard chargers (OBCs), DC-DC converters, and auxiliary power supplies. In those subsystems, especially below 650 V, GaN’s high switching frequency capability allows substantial reductions in magnetics and passive components, enabling lighter and more compact power electronics. Some EV platforms combine SiC-based traction inverters with GaN-based onboard chargers, effectively splitting the powertrain according to voltage and mission profile.

    4.2 Renewables, Storage, and Grid-Tied Equipment

    Large solar string inverters, central inverters, and utility-scale storage systems place a premium on high-voltage handling, surge robustness, and long lifetimes in challenging outdoor environments. SiC has gained traction here for similar reasons as in traction drives: the ability to handle 1000–1500 V DC buses, strong thermal characteristics, and credible 15–20 year lifetime expectations under field conditions.

    GaN’s presence in renewables is more visible in lower power stages, such as module-level power electronics (MLPE), residential-scale inverters, or auxiliary DC-DC converters where footprint, efficiency at partial loads, and high-frequency operation are decisive. The combination of compact magnetics and high switching speeds can materially reduce the size and weight of rooftop or wall-mounted gear, though long-term field performance data in these outdoor environments is still accumulating.

    4.3 Data Centers, Telecom, and Consumer Fast Charging

    This is where GaN’s device physics is most fully exploited. In high-density server power shelves, 48 V bus conversion, and telecom rectifiers, GaN enables multi-MHz switching and high power densities. The ability to reduce the size of inductors and transformers, often by double-digit percentages, has direct consequences for rack-level volumetric power density and airflow management. GaN’s efficiency advantages at partial load can also align well with real-world server utilisation profiles.

    In consumer fast chargers and adapters, GaN has already redefined form factors, allowing tens to hundreds of watts of power in extremely compact packages. Here, the controlling constraints are cost, safety, and thermal comfort rather than 15–20 year lifetimes, and GaN’s physics aligns almost perfectly with the design space.

    SiC is not absent in datacom or fast-charging ecosystems, but its relative cost structure and advantages are more attractive at higher voltages and powers than those typically encountered in consumer adapters or 48 V bus converters. As a result, GaN is more structurally advantaged across much of this segment.

    5. Gallium vs Silicon Carbide: Raw Materials, Wafer Technology, and Supply Risk

    From a materials and mining perspective, GaN and SiC are not equal. The gallium needed for GaN devices is produced almost entirely as a by-product of other mining and refining operations, while silicon and carbon for SiC are derived from far more abundant and geographically diversified sources. This asymmetry is central to understanding strategic risk profiles during rapid WBG adoption, traced in detail in our wide-bandgap supply chain deep dive.

    5.1 Gallium: By-Product Dependency and Concentrated Refining

    Gallium is typically recovered as a minor constituent from bauxite processing (alumina refineries) and from certain zinc processing streams. Because gallium production is tied to aluminium and zinc output, primary supply is relatively inelastic to demand from LEDs and power electronics. Historically, refined gallium production has been highly concentrated in a small number of countries, with China holding a dominant share of output and refining capacity, leaving Western buyers dependent on a thin set of non-Chinese gallium and germanium sources according to recurring USGS and EU critical raw material assessments.

    Export licensing changes and broader geopolitical tensions have raised perceived gallium supply risk in the last several years. For GaN power electronics, this concentrates upstream exposure: even if epitaxy, wafer processing, and device fabrication are geographically diversified, the gallium-bearing feedstock still often originates from a small cluster of refineries. Under frameworks such as the EU Critical Raw Materials Act and related national regulations, this has already driven tighter scrutiny of material provenance, long-term offtake contracts, and recycling potential from LED and RF waste streams.

    5.2 Silicon Carbide: Abundant Precursors, Complex Crystals

    SiC draws on far more abundant raw materials: high-purity quartz or silica, metallurgical-grade silicon, and carbon sources such as petroleum coke or other high-purity carbons. The strategic constraint is not geological scarcity, but rather the complexity of growing large, defect-controlled SiC boules and wafers. Physical vapor transport (PVT) crystal growth is capital- and energy-intensive, and scaling from 150 mm to 200 mm wafers has been a major area of industrial focus.

    This means SiC supply risks are more about manufacturing capacity, yield, and process control than raw ore availability. Wafer costs remain high relative to silicon, but as multiple producers bring additional capacity online and refine defect control, the trajectory points toward more diversified supply. From a critical materials standpoint, SiC sits in a more comfortable position: it does not depend on a single-country by-product stream, and its precursors are widely distributed across the globe.

    5.3 Wafer and Epitaxy Ecosystems

    On the midstream side, GaN and SiC require different infrastructure. SiC wafers are grown as bulk single crystals, sliced, and polished before epitaxial layers are deposited. Wafer sizes have historically lagged silicon, but 150 mm and 200 mm wafers are now standard targets, with some pilot efforts exploring larger diameters. Tooling, epitaxy reactors, and fab processes are increasingly tuned specifically to SiC device structures.

    Laboratory test setup for evaluating GaN and SiC power devices.
    Laboratory test setup for evaluating GaN and SiC power devices.

    GaN power devices, by contrast, are usually realised as GaN epitaxial layers grown on silicon or SiC substrates using metal-organic chemical vapor deposition (MOCVD) or related techniques. This allows reuse of large-diameter silicon wafers and partially leverages existing silicon fab lines, but at the cost of managing thermal expansion and lattice mismatch between GaN and the substrate. These mismatches drive dislocation densities and defect structures that feed directly into trapping, leakage, and long-term reliability.

    Vertical GaN on native GaN substrates is an area of active development aimed at high-voltage applications, promising to combine GaN’s superior breakdown field with vertical architectures akin to SiC. The limiting factor is currently the availability and cost of high-quality bulk GaN substrates, which are even more challenging to produce at scale than SiC boules. This emerging path is strategically important but not yet a volume alternative to SiC at 1200 V and above.

    6. Implementation Realities: Gate Drive, Packaging, and Compliance

    Even where physics clearly favours GaN or SiC for a given application, implementation constraints can override theoretical advantages. Gate drive ecosystems, package standards, EMC compliance, and qualification requirements all shape which technology is credible in a given sector.

    6.1 Gate Driving and Control Electronics

    SiC MOSFETs typically require relatively high gate voltages with defined positive and negative drive levels (for instance, +15/−5 V ranges are common), and tolerate relatively slower switching speeds while still delivering efficiency gains over silicon. Gate drivers need sufficient immunity to high dV/dt environments and robust desaturation protection, but the overall design language is a natural extension of high-voltage silicon MOSFET experience.

    GaN gate driving is more delicate. Enhancement-mode HEMTs often operate with small gate voltage windows, and are intolerant of overshoot beyond specified limits. Fast transients, high dV/dt, and strong Miller coupling require carefully matched drivers, short gate loops, and sometimes integrated driver–FET packages to manage parasitics. In many of the highest-density GaN designs, successful operation depends as much on co-packaged drivers and optimised layouts as on the intrinsic device physics.

    6.2 Packaging, Layout, and EMI

    SiC modules for traction and industrial drives often adopt standard power module formats, sometimes shared with silicon IGBTs, easing mechanical integration but not always optimising loop inductances. Even so, switching speeds relative to silicon are sufficiently higher that package and layout parasitics still receive far more scrutiny than in legacy designs. Co-optimised module layouts, press-fit terminals, and low-inductance busbars are now standard in advanced SiC power stacks.

    GaN’s very fast edges and high frequency potential strongly incentivise packages with minimal parasitic inductance and capacitance: embedded packages, chip-scale packaging, and laminate-integrated solutions are common. These design choices materially affect EMC and conducted/radiated emissions. Inadequate attention to PCB stack-up, return paths, and common-mode chokes can quickly erode the theoretical efficiency gains from GaN by forcing derating or additional filtering.

    6.3 Standards, Qualification, and Industrial Resilience

    Automotive and grid equipment impose rigorous qualification chains: AEC-Q101 for discrete semiconductors, ISO/TS standards, and various JEDEC specifications. SiC devices now have a visible track record in meeting these requirements, and several leading SiC vendors have dedicated automotive-qualified lines. This maturity feeds back into design decisions, as OEMs can rely on accumulated field data and structured failure analysis.

    GaN devices have achieved automotive qualification in selected categories, but deployment remains more concentrated in consumer, datacom, and selected industrial roles. Qualification cycles continue to extend into more demanding mission profiles, yet many OEMs still view GaN as a younger technology for high-voltage, long-lifetime applications. From an industrial resilience perspective, this means SiC currently anchors more of the long-life, safety-critical nodes in the global power electronics infrastructure, while GaN increasingly populates high-density but shorter-lifetime equipment.

    7. Trade-Off Synthesis: Physics, Risk, and Material Constraints

    Aggregating these layers—physics, device architecture, reliability, and supply chains—reveals a clearer structural picture of GaN vs SiC in power electronics.

    First, SiC is structurally advantaged wherever high voltage, high power, and harsh operating conditions coincide. Its vertical architecture, high breakdown field, and thermal conductivity create a large safety margin. That margin is what supports 800 V traction inverters, utility-scale solar, and industrial drives that need to survive decades of cycling, overloads, and non-ideal cooling.

    Second, GaN is structurally advantaged where switching frequency, power density, and form factor dominate the requirements, and where mission profiles are compatible with tightly controlled gate drive and thermal design. Datacenter power supplies, telecom rectifiers, and consumer fast chargers are the clearest examples. In these environments, GaN transforms magnetics, enclosure size, and thermal management assumptions, often achieving both higher efficiency and substantial size reductions versus silicon or even SiC at equivalent voltages.

    Third, material supply chains tilt risk profiles in different directions. Gallium’s by-product status and concentrated refining elevate geopolitical and regulatory risk for GaN, even as more epitaxy and device fabrication capacity moves into diversified geographies. SiC, anchored in abundant silicon and carbon sources but constrained by advanced crystal growth capacity, presents more of a manufacturing scaling challenge than a pure raw material risk. These differences matter for governments, OEMs, and regulators planning long-term electrification and digital infrastructure.

    Finally, overlap zones are substantial. Onboard chargers, residential solar inverters, industrial power supplies, and mid-power drives sit in a regime where both GaN and SiC can credibly compete. In these spaces, selection often hinges on institution-specific comfort with each technology’s failure modes, internal design capabilities for high-speed switching, and sensitivity to raw material risk and regulatory oversight.

    From the Materials Dispatch perspective, the decisive insight is this: in WBG power electronics, the key variable is not which material is “better” in the abstract, but which combination of physics, packaging, and supply chain constraints is acceptable at each node of the power conversion stack. As EV architectures, renewable penetration, and data center loads continue to escalate, active monitoring of gallium policy signals, SiC wafer capacity expansions, and reliability field data will define how the GaN–SiC balance evolves in the coming hardware cycle.

    Note on Materials Dispatch methodology Materials Dispatch integrates technical literature on WBG device physics, regulatory and trade monitoring around critical materials (such as gallium), and market data on end-use specifications in EVs, renewables, and datacenters. This cross-reference of process-level engineering constraints with upstream material realities underpins the assessments presented in this analysis.

  • Dysprosium and Terbium: The 2% That Makes NdFeB Magnets Fail-Safe

    Dysprosium and Terbium: The 2% That Makes NdFeB Magnets Fail-Safe

    Heavy rare earths dysprosium and terbium underpin high-temperature NdFeB magnet performance but sit at the narrowest, most geopolitically exposed point of the magnet supply chain; engineering and policy responses are reshaping materials choices, process flows, and risk models from mine to motor.

    Dysprosium (Dy) and terbium (Tb) are heavy rare earths (HREs) added at a few weight percent to neodymium-iron-boron (NdFeB) magnets, where they stabilize coercivity at elevated temperature. Without them, high-energy NdFeB grades can lose roughly half their coercivity between room temperature and 150 °C. Yet these two atoms are sourced from a narrow, politically exposed upstream, so gram-level Dy/Tb decisions in motor design cascade back into billion-dollar questions about mines, refineries, and export controls.

    Materials Dispatch’s assessment is that the core technical tension is no longer simply “NdFeB versus alternatives”. It is the three-way tradeoff between high-temperature coercivity, Dy/Tb intensity, and exposure to a supply base concentrated in Chinese ionic clays and a small set of emerging HRE projects. Engineering advances in grain-boundary diffusion, Dy-free microstructures, SmCo deployment, and magnet recycling are real, but they rebalance rather than eliminate this constraint.

    What follows unpacks the magnet physics, the precise role of Dy/Tb in that physics, the upstream and midstream infrastructure that delivers those atoms into finished magnets, and the operational choices facing electric mobility, wind, and defense programs in the 2024-2025 window.

    Why does Dy/Tb supply risk matter now?

    Permanent magnets are one of the highest-leverage materials systems in modern industry: small mass, outsized system impact. NdFeB magnets in traction motors, wind turbine generators, guidance actuators, and precision servos enable compact, efficient machines with high power density. The roadblock is temperature. Standard NdFeB grades lose coercivity sharply above roughly 120–150 °C; at 150 °C coercivity can drop to less than half of the room-temperature value if no heavy rare earth is present.

    Dysprosium and terbium solve this at the microstructural level, but they do so by tapping into the rarest, most scattered part of the rare-earth series. A 2024 US neodymium magnet supply-chain report and market studies from Roskill and Adamas Intelligence converge on a simple structural fact: high-temperature NdFeB accounts for a substantial and rising share of total NdFeB tonnage, yet Dy/Tb mine output trails this demand segment, leading to persistent deficits and price sensitivity. In other words, the energy transition is leaning heavily on the two rare earths with the weakest and most geographically concentrated production base.

    The operational question is therefore not abstract. It is concrete: how many weight percent Dy/Tb in each magnet, from which upstream jurisdictions, processed through which refineries, at what coercivity and thermal margin – and what happens if that Dy/Tb is suddenly unavailable or repriced. For a sense of how magnet-grade rare earths translate into end-use stakes, see our analysis of how much rare earth goes into a fighter.

    How do magnet chemistries set the thermal constraint?

    NdFeB: High Energy Density, Limited Thermal Margin

    NdFeB magnets are based on the Nd₂Fe₁₄B phase: approximately one-third rare earth (neodymium and praseodymium), with the remainder mostly iron and a small amount of boron. The tetragonal crystal structure has alternating rare-earth and iron-rich layers; boron stabilizes this phase and supports high magnetocrystalline anisotropy. Typical sintered grades deliver high remanence, strong coercivity at room temperature, and very high maximum energy product, which explains why NdFeB has captured the majority of the rare-earth magnet market.

    The problem arises as temperature climbs toward 150–200 °C – the regime where traction motors, wind turbine generators, and aerospace actuators frequently operate. The intrinsic coercivity of the Nd₂Fe₁₄B phase declines with temperature as exchange coupling weakens. Without Dy/Tb, high-energy NdFeB grades can see coercivity roughly halved between room temperature and 150 °C, shrinking safety margin against partial demagnetization during overload or fault conditions.

    SmCo and Ferrites: Alternative Baselines

    Samarium-cobalt magnets occupy the traditional high-temperature niche. The two industrial families, SmCo₅ and Sm₂Co₁₇, offer lower remanence than NdFeB but extremely high Curie temperatures (well above 700 °C in many compositions) and good corrosion resistance. Their magnetocrystalline anisotropy is dominated by the samarium 4f orbitals interacting with cobalt 3d electrons, giving robust coercivity even at temperatures beyond those tolerable for NdFeB.

    In contrast, ferrite magnets (strontium or barium hexaferrite) deliver low cost, good corrosion resistance, and moderate Curie temperatures around the mid-400 °C range, but their remanence and energy product are far lower. For high-power density machines in EVs and aerospace, ferrites are generally not competitive on volume and weight, although they remain important in many mass-market applications where size, weight, and efficiency penalties are tolerated.

    Property (typical ranges) NdFeB (sintered) SmCo (SmCo₅ / Sm₂Co₁₇) Ferrite
    Remanence Br High (around 1.0–1.4 T) Moderate (about 0.8–1.2 T) Low (roughly 0.2–0.4 T)
    Coercivity Hci (room temp.) High, but sensitive to temperature High and more temperature-stable Low–moderate
    Max energy product (BH)max Very high (hundreds of kJ/m³) High (but generally below NdFeB) Low (by an order of magnitude)
    Typical usable temp. range Up to ~150–200 °C (grade-dependent) Up to ~300 °C and beyond Up to ~250–300 °C
    Relative material cost Baseline (1×) Several times NdFeB Fraction of NdFeB
    Comparative qualitative performance: NdFeB delivers the highest energy density but needs Dy/Tb for reliable performance at elevated temperature.

    SmCo thereby offers a structurally Dy/Tb-free solution at the price of higher cost, lower energy product, and dependence on cobalt. That structural difference explains why SmCo remains concentrated in defense and high-end aerospace niches, while NdFeB dominates EV and wind volumes but carries the Dy/Tb burden.

    What does Dy/Tb actually do inside the NdFeB lattice?

    Dysprosium and terbium are heavy rare earths with stronger spin-orbit coupling than neodymium. When Dy³⁺ or Tb³⁺ partially substitute for Nd³⁺ in the Nd₂Fe₁₄B lattice, the anisotropy field increases. Practically, this means domain walls are harder to move, and coercivity rises, especially at elevated temperature. This is why high-temperature NdFeB grades typically contain a few weight percent Dy and/or Tb in addition to Nd/Pr.

    Two main industrial routes introduce Dy/Tb into NdFeB magnets:

    • Bulk alloying / co-sintering – Dy/Tb are added to the melt, then the alloy is strip-cast, hydrogen-decrepitated, jet-milled, pressed, and sintered. Dy/Tb are relatively uniformly distributed, raising coercivity but at a significant penalty in remanence.
    • Grain boundary diffusion (GBD) – Dy/Tb-rich alloys are applied as a coating or secondary phase and diffused into grain boundaries at elevated temperature. This concentrates Dy/Tb where coercivity is most affected (grain surfaces) while leaving grain cores Dy-free, preserving more remanence per unit Dy/Tb used.

    Experimental and industrial data compiled in Japanese and US technical literature show that undoped NdFeB grades can see coercivity values around the lower end of standard ranges at room temperature, with significant degradation above 100–150 °C. Introducing several weight percent Dy can roughly double coercivity at 150 °C, enabling reliable operation for EV and wind applications. Comparable coercivity improvements can be obtained with slightly lower Tb contents because Tb’s contribution to anisotropy per atom is higher, but Tb is even scarcer and often more expensive.

    The tradeoff is clear in practice. Each incremental percent of Dy or Tb generally trims remanence, because Dy/Tb atoms carry different magnetic moments and modify the local environment of iron 3d electrons. That forces magnet designers into a three-way compromise: coercivity margin, magnet volume, and HRE content. In high-power density EV motors, that balance becomes acute. In practical terms, every additional weight percent of Dy in a traction motor magnet reshapes the entire thermal-margin versus active-material cost calculus.

    Where do dysprosium and terbium actually come from?

    Geological and Ore-Type Constraints

    Dysprosium and terbium occur at low concentrations and, unlike abundant Nd and Pr, are strongly tied to specific ore types. Whereas Nd and Pr are concentrated in large bastnäsite and monazite deposits, Dy and Tb are scattered and enriched only in a handful of geological settings:

    How NdFeB permanent magnets are used in EV traction motors, with high-temperature regions driving Dy/Tb demand.
    How NdFeB permanent magnets are used in EV traction motors, with high-temperature regions driving Dy/Tb demand.
    • Ionic adsorption clays in southern China and neighboring regions – weathered granites where rare earths are loosely bound on clay surfaces; these deposits have relatively higher fractions of HREs (including Dy and Tb).
    • Xenotime and HRE-rich monazite in select hard-rock deposits such as xenotime-bearing quartz veins and specialized alkaline systems.
    • Phosphogypsum and industrial by-products where rare earths (including HREs) were historically discarded with fertilizer or phosphoric acid residues.

    USGS data and commercial assessments show that a dominant share of separated Dy/Tb in recent years has been produced from Chinese ionic adsorption clays, supplemented by material extracted in Myanmar and processed in China. Large light rare-earth operations such as Bayan Obo in Inner Mongolia produce immense Nd/Pr flows but relatively modest Dy/Tb quantities, which are insufficient on their own to meet high-temperature magnet demand. The Myanmar dependency is itself a documented pressure point; see dysprosium after Myanmar: who pays the price.

    Process Flows: From Clay and Concentrate to Dy/Tb Oxides

    The typical ionic-clay HRE flow sheet is chemically simple but environmentally sensitive. Leaching uses saline ammonium sulfate or other electrolytes to displace rare-earth cations from clay surfaces; the pregnant leach solution then passes through steps of impurity removal, rare-earth precipitation (usually as carbonates or hydroxides), and finally solvent extraction for separation of individual elements such as Dy and Tb. Oxalate precipitation and calcination yield rare-earth oxides (REOs), which move to metal-making and alloying stages.

    Key operational constraints emerge at each step:

    • Leach control and effluents – Inadequate capture of ammonium and rare-earth bearing leachates can contaminate waterways. Stricter environmental enforcement in southern China has periodically curtailed unregulated operations, cutting HRE supply.
    • Solvent extraction capacity – Dy and Tb are separated in long mixer-settler or column trains. Capacity expansions require significant capital, organic solvent inventory, skilled operators, and acid/alkali supply, all of which can become bottlenecks.
    • Residue management – Clay tailings remain chemically active and require engineered containment to avoid acidification and metal release; this is now a central focus of Chinese regulators and a key permitting consideration in new projects elsewhere.

    Hard-rock HRE projects such as Browns Range (xenotime), Dubbo (zirconium-hafnium-rare earths), and Round Top (multi-element rhyolite) follow more familiar mining and beneficiation patterns: conventional open pit, crushing, grinding, flotation or gravity separation, then acid or caustic cracking of concentrates and solvent extraction. These operations introduce higher capex but can yield relatively concentrated Dy/Tb streams and co-products (Zr, Hf, Nb, Li, etc.) that support industrial resilience.

    Key Dy/Tb-Relevant Projects in 2024–2025

    Industry and policy attention has coalesced around a limited group of assets that materially influence Dy/Tb availability outside China. Publicly available technical and market reports regularly cite the following as structurally important for the mid-2020s:

    • Browns Range (Australia, Northern Minerals) – Xenotime-rich ore focused on Dy/Tb and other HREs, operating pilot-scale production with plans for scale-up. Logistics revolve around Darwin port and remote infrastructure.
    • Dubbo Project (Australia, Australian Strategic Materials) – A zirconium-hafnium-rare-earth deposit with relatively high HRE content. Feasibility work indicates meaningful Dy/Tb output alongside Zr/Hf streams, positioning it as a non-China HRE hub once financed and constructed.
    • Nolans (Australia, Arafura) – A phosphate-hosted NdPr project with some HRE components. Nolans is primarily a NdPr project but offers incremental Dy/Tb capacity and aims for integrated downstream processing.
    • Round Top (USA, Texas) – A multi-element deposit containing rare earths (including HREs) and lithium, with a development concept built around integrated processing in Texas. Permitting and technical de-risking are the current focal points.
    • Phosphogypsum-based projects (e.g., South Africa) – Recovery of rare earths, including Dy/Tb, from historic fertilizer stacks, blending mining and waste-reprocessing challenges with ESG scrutiny.

    Parallel to these, ionic-clay supply in Myanmar and southern China remains decisive. Political disruptions in Myanmar in recent years have periodically cut HRE feed into Chinese separation plants, leading to noticeable tightening in Dy/Tb spot availability and price spikes highlighted by Fastmarkets and other price reporting agencies.

    How is Dy/Tb turned into a finished magnet?

    Metal Production and Alloying

    Dy and Tb oxides follow the same basic midstream path as other rare earths destined for NdFeB magnets. Oxides are typically converted to fluorides or chlorides, then reduced metallothermically (for instance, with calcium or other reductants) in vacuum or inert atmosphere to yield metals or master alloys. Dy/Tb can also be added as mischmetal-type alloy additions rather than as pure metal.

    At this stage, the key technical focus is purity (to avoid parasitic phases and non-magnetic inclusions) and control of alloy composition. Even minor deviations in Dy/Tb content from specification can materially alter coercivity profiles, particularly in grain-boundary-diffused magnets where effective Dy/Tb content at grain surfaces, not simply bulk analysis, governs performance.

    NdFeB Manufacturing: Where Dy/Tb Choices Are Locked In

    The classic sintered NdFeB process involves strip casting the alloy, hydrogen decrepitation to break it into brittle hydrides, jet milling under inert gas to achieve sub-10 µm powders, pressing in alignment fields, sintering, and heat treatment. Dy/Tb can be present throughout this process (bulk doping) or introduced via GBD steps after sintering.

    Grain-boundary diffusion routes used by Japanese and Korean magnet producers highlight the central tradeoff. Coatings or thin layers enriched in Dy/Tb are applied to magnet blanks, which are then annealed at elevated temperatures for tens of hours. Dy/Tb diffuses a limited distance into grain boundaries, increasing coercivity near surfaces where demagnetization starts, while leaving grain cores largely free of HREs and maintaining higher remanence.

    Comparing NdFeB and SmCo magnet chemistries and performance tradeoffs.
    Comparing NdFeB and SmCo magnet chemistries and performance tradeoffs.

    The cost implications are two-sided:

    • Dy/Tb consumption per magnet can fall significantly compared to bulk-doped grades, reducing exposure to HRE price volatility.
    • Processing time and complexity increase, with longer furnace cycles, tighter atmosphere control, and more complex quality assurance to ensure uniform diffusion depth.

    Industrial experience shows that poor control of Dy/Tb diffusion can lead to significant within-batch coercivity variance. Magnets on the same production line can deviate beyond acceptable tolerance bands if diffusion profiles vary with part geometry, furnace loading, or surface condition. That, in turn, complicates motor and generator design assumptions about minimum coercivity under worst-case temperature and demagnetization load.

    SmCo and Other Alternatives in the Midstream Flow

    SmCo magnets follow distinct midstream paths: samarium and cobalt are alloyed and processed via powder metallurgy or hot-pressing routes; no Dy/Tb is required. This cleanly removes HRE risk but introduces dependence on cobalt supply and exposes programs to higher material cost and somewhat lower magnet energy product.

    Emerging alternatives include hot-deformed NdFeB with refined grain sizes that raise coercivity without Dy/Tb, and experimentation with rare-earth-lean or rare-earth-free systems (e.g., MnBi, Fe-N, advanced alnico variants). However, these remain niche or developmental for large-scale traction and wind use. For the next decade, NdFeB and SmCo will likely remain the workhorses, with Dy/Tb management as a central variable in NdFeB deployment.

    What shapes the Dy/Tb market and policy landscape?

    The 2024–2025 Dy/Tb market is defined by strong NdFeB demand from electric vehicles and wind turbines, with high-temperature grades representing a substantial fraction of total tonnage. Government and industry reports through late 2024 place Dy demand in the low-thousands of tonnes per year and Tb in the mid-hundreds, with mine output slightly lower for both, implying structural deficits bridged by stock draws, recycling, and demand management.

    Several structural features dominate the risk profile:

    • Chinese processing dominance – Although hard-rock projects are emerging elsewhere, a large majority of Dy/Tb separation capacity remains in China, built around ionic-clay feed and enhanced by imported clays from Myanmar. Environmental campaigns and export licensing adjustments have direct, rapid effects on global availability.
    • Policy instruments in consuming regions – The United StatesInflation Reduction Act includes incentives for magnets produced with non-Chinese supply chains. The European Union’s Critical Raw Materials Act targets domestic and allied extraction and processing quotas by 2030. Japan continues to operate strategic stockpiles and structured offtakes with non-Chinese producers.
    • Price volatility and contract structures – Spot prices for Dy/Tb oxides have seen sharp moves following export quota announcements or disruptions in Myanmar. Large magnet producers and OEMs increasingly rely on multi-year offtake contracts and index-linked pricing to stabilize industrial planning.

    These dynamics directly influence where and how Dy/Tb-efficient technologies such as GBD or Dy-free microstructural designs are adopted. The more constrained Dy/Tb becomes at the mine and separation level, the more valuable each incremental percent of coercivity gained per unit HRE within the magnet plant.

    How can engineers reduce or reposition Dy/Tb?

    Magnet-Level Mitigation

    At the magnet level, several strategies are in active industrial use or development to reduce dependence on Dy/Tb while preserving performance:

    • Grain boundary diffusion optimization – Wider adoption of diffusion-based coercivity enhancement reduces total Dy/Tb tonnage per magnet. Process innovations include optimized Dy/Tb carrier alloys, multi-step diffusion cycles, and grain-boundary engineering with additive elements (e.g., Cu, Al) to open diffusion pathways.
    • Grain size refinement – Hot-deformed NdFeB, with nano-scale grains, achieves higher intrinsic coercivity from microstructure alone. This can partially or completely offset Dy in some applications but requires sophisticated hot-working and texture control.
    • Selective Tb usage – In designs where mass and temperature margin are critical, some programs favor smaller Tb additions instead of larger Dy additions, exploiting Tb’s stronger anisotropy impact per atom at the cost of using a scarcer element.
    • Coatings and corrosion management – High-Dy/Tb grades can be more vulnerable to specific corrosion modes; robust Ni-Cu-Ni or epoxy coatings and strict control of porosity and inclusions in the sintered body help preserve long-term coercivity.

    Each of these magnet-level responses involves tradeoffs: longer cycle times, higher process complexity, more demanding quality assurance, or increased exposure to other critical inputs (e.g., copper for grain-boundary phases).

    Machine-Level Mitigation

    Motors, generators, and actuators offer another layer of flexibility. Design choices can reduce Dy/Tb intensity even if magnets remain NdFeB-based:

    • Thermal management – Improved rotor cooling, reduced hotspot formation, and better thermal interfaces keep magnet temperatures below coercivity-critical thresholds. This allows use of lower-Dy grades at the same reliability level.
    • Motor topology – Interior permanent magnet (IPM) motors distribute flux differently and can be designed with demagnetization-resilient geometries, permitting lower HRE content than surface-mounted designs for equivalent torque and overload profiles.
    • Hybrid and reluctance-assisted designs – Some traction motors blend reluctance torque with PM torque, reducing magnet content per kW. This does not remove Dy/Tb risk but lowers the total kilograms of Dy/Tb per vehicle or turbine.
    • SmCo substitution in critical zones – In high-risk aerospace or defense components, SmCo magnets can replace NdFeB entirely or in the most thermally stressed regions, removing Dy/Tb dependence in those subsystems.

    Machine-level mitigations shift tradeoffs into other domains: cooling system complexity, control algorithms, rotor and stator manufacturing, and in some cases reliance on cobalt or larger machine size. The benefit is flexibility in tuning Dy/Tb usage to the most critical elements of the fleet.

    Recycling and Secondary Supply

    Recycling is an increasingly important complement to primary Dy/Tb supply. Two main routes are relevant:

    • Direct reuse / re-manufacturing – Recovery of magnets from end-of-life hard drives, motors, and generators; demagnetization, re-machining, or re-processing into new shapes. Dy/Tb remains embodied in the magnet, though performance can degrade after multiple cycles.
    • Hydrometallurgical recovery – Shredded magnets are leached in acids, impurities are removed, and rare-earth elements are separated via solvent extraction into individual oxides, including Dy and Tb. These oxides then re-enter the standard midstream flows.

    Industrial projects in Europe, Japan, and North America have demonstrated technically viable flowsheets for magnet-to-magnet or magnet-to-oxide recycling. The main constraints remain collection logistics, product heterogeneity, and the economics of competing with primary supply. Nevertheless, recycling offers a structurally different risk profile: urban mines are geographically closer to end-use industries and less exposed to the same geopolitical chokepoints as primary HRE deposits. For why magnet recycling stays marginal in volume terms, see rare earth recycling: the 15% target nobody is hitting.

    What are the failure modes in a Dy/Tb-constrained world?

    Dy/Tb risk is often framed in tonnage and price terms, but the most consequential failures arise when material, process, and design assumptions misalign. Several patterns recur in industrial experience and technical case studies.

    Global distribution of key dysprosium and terbium mining and processing sites.
    Global distribution of key dysprosium and terbium mining and processing sites.

    Partial Demagnetization in High-Stress Machines

    If coercivity margins are thinner than anticipated – because Dy/Tb content is slightly low, distribution is inhomogeneous, or operating temperatures are higher than modeled – machines can suffer partial, irreversible demagnetization during overload or fault events. The immediate outcome is not necessarily catastrophic failure; more commonly, torque or efficiency loss emerges over time and is difficult to diagnose without detailed magnetic characterization.

    GBD magnets are particularly sensitive to diffusion depth and surface coverage. Edges and corners can receive less Dy/Tb, becoming demagnetization “weak spots”. Motors built with such magnets may pass initial testing but age faster under pulsed or cyclic overload, especially in applications where ambient conditions are less controlled (e.g., heavy-duty EVs, off-highway equipment, or nacelles with variable thermal paths).

    Supply-Chain Disruptions Propagating into Design Decisions

    Disruptions in Myanmar ionic-clay exports or Chinese production curtailments, as seen in recent years, have forced magnet makers to temporarily adjust Dy/Tb content or shift customers to different grades. In some cases, this has led to re-rating of machine performance envelopes, including derating of turbine generators or traction motors in certain duty cycles.

    Such short-term adjustments illustrate a deeper structural issue: magnet grade selection and Dy/Tb content are often locked into long validation cycles. Once a platform is qualified, changing Dy/Tb levels typically requires fresh testing and approvals. Supply shocks arriving mid-platform can therefore create a gap between what the supply chain can deliver and what the platform specification demands.

    Quality and Traceability Gaps

    In a constrained Dy/Tb market, blending of different feedstocks, substitution between Dy and Tb, or variable recycling input streams can all introduce composition variability. If analytical controls (ICP-MS assays, XRD phase analysis, coercivity mapping) are not robust, magnets may drift outside narrow specification windows without detection at incoming inspection.

    From an operational perspective, this transforms a macro-supply risk into a micro-quality risk: failures occur not because Dy/Tb is unavailable, but because its distribution and spec compliance are imperfectly controlled. That is especially acute in safety-critical systems (flight controls, braking actuators, guidance fins) where magnet performance margins are tight and failure modes are binary.

    How do industrial teams structure Dy/Tb risk analysis?

    Across OEMs and tier-one magnet users, internal workflows tend to converge on a multi-layer analysis of Dy/Tb exposure rather than a single “price risk” metric. Typical frameworks bring together materials science, procurement, and regulatory teams around several recurring pillars.

    • Material characterization – Detailed rare-earth oxide and metal purity assays, including Dy/Tb and trace contaminants, to ensure consistency with magnet-grade specifications.
    • Composition mapping – Verification of Nd:Dy:Tb ratios at batch and sub-batch level, including checks on diffusion profiles for GBD magnets, often with statistical acceptance criteria for coercivity spread.
    • Thermal performance validation – Coercivity and remanence measurement across temperature and demagnetizing field conditions representative of real duty cycles, frequently aligned with ASTM or IEC methods.
    • Supply-chain traceability – Mapping Dy/Tb flows from mine or recycling facility through separation plants, metal makers, and magnet plants, identifying single points of failure and high-risk jurisdictions.
    • Jurisdictional and policy analysis – Screening for export controls, sanctions exposure, and qualifications under incentives such as the US IRA or EU CRMA, given their growing weight in procurement decisions.
    • Cost and exposure modeling – Scenario analysis under different Dy/Tb price levels and availability assumptions, including the impact of switching between Dy and Tb in certain grades or adopting Dy-efficient technologies.
    • Contingency and substitution planning – Structured evaluation of SmCo swaps, lower-Dy grades, redesigned cooling or motor topologies, and incremental recycling as potential responses to severe Dy/Tb constraints.

    The common thread is that Dy/Tb is treated not just as a line item in the bill of materials, but as a strategic material input whose physical, regulatory, and geopolitical properties require continuous monitoring and cross-functional management.

    Synthesis: structural tradeoffs and the road ahead

    The technical core of the Dy/Tb story is straightforward: a few percent of heavy rare earth in NdFeB magnets determine whether critical machines retain magnetization headroom at elevated temperature. The industrial reality is less straightforward: that Dy/Tb comes from a narrow band of deposits and refineries concentrated in specific jurisdictions, processed through capital-intensive and environmentally sensitive facilities.

    Engineering responses – grain-boundary diffusion, Dy-free microstructures, refined motor designs, and selective SmCo deployment – are steadily improving the efficiency with which Dy/Tb is used. Recycling is beginning to add secondary supply. New HRE-focused mines and multi-element projects are working through permitting and financing to provide alternative feedstocks. Yet each of these options redistributes tradeoffs rather than eliminating them, whether into process complexity, cobalt exposure, capital intensity, or permitting timelines.

    From Materials Dispatch’s perspective, Dy/Tb risk is becoming a system property rather than a simple commodity concern. Platform designers, magnet makers, and policy makers are all interacting through the same constrained nodes: ionic-clay operations, HRE separation capacity, and qualification cycles for advanced magnet grades. The decisive signals in the coming years are likely to come from incremental shifts – a new separation plant reaching nameplate capacity, a regulatory tightening on ionic-clay leaching, a traction motor platform qualified on Dy-free hot-deformed NdFeB, or a strategic offtake that anchors an HRE-rich hard-rock project. Monitoring these weak signals, and mapping their impact across the upstream-midstream-downstream chain, will be central to understanding how the Dy/Tb constraint evolves.

    Note on Materials Dispatch methodology – This analysis integrates technical literature on magnet physics and processing, public supply-chain assessments from agencies such as the US Department of Energy and USGS, commercial market data from specialist consultancies, and systematic monitoring of policy moves in key jurisdictions (including Chinese export licensing, US IRA implementation, and EU CRMA measures). Cross-referencing these sources against end-use technical specifications for EV, wind, and defense platforms enables an integrated view of how Dy/Tb risk propagates through the entire magnet value chain.

  • From Gallium to EV Modules: The Wide-Bandgap Chokepoints

    From Gallium to EV Modules: The Wide-Bandgap Chokepoints

    Wide-bandgap (WBG) semiconductors, the gallium nitride (GaN) and silicon carbide (SiC) devices now powering EVs, data centers, 5G and defense systems, no longer hinge on transistor design. As of 2025, the binding constraint is a fragile, highly concentrated materials and substrate chain that runs from gallium-rich bauxites and high-purity silicon to 200-300 mm wafers and thermally robust power modules, all under tightening export controls.

    Why WBG Risk Now Lives Upstream, From Mine to Wafer

    Wide‑bandgap (WBG) semiconductors based on gallium nitride (GaN) and silicon carbide (SiC) have moved from niche to system‑defining in less than a decade. They now sit at the heart of EV traction inverters, fast chargers, 5G base stations, AI data center power supplies, and radar and electronic warfare systems. Market analysis from SkyQuest projects the GaN/SiC power semiconductor segment will grow from roughly $3.63 billion in 2025 to $22.48 billion by 2033, implying a compound annual growth rate above 25% [7].

    This pace of deployment collides with a supply chain that was never designed for strategic scale. Gallium is largely a byproduct of alumina and zinc refining, not a primary mined commodity; SiC begins with metallurgical‑grade silicon and carbon in highly energy‑intensive furnaces; and the transition from 150 mm to 200 mm and ultimately 300 mm substrates magnifies defect sensitivity at every step. Export controls, carbon policies, and forced labor regulations further complicate sourcing strategies.

    Structured differently from silicon logic, the WBG stack concentrates technical and geopolitical risk in a handful of upstream and midstream nodes-particularly refined gallium and high‑purity SiC substrates-while downstream module assembly remains comparatively flexible. Understanding this asymmetry is critical for any OEM, Tier‑1, or government agency relying on WBG devices for electrification and digital infrastructure.

    This deep dive traces the WBG chain from mine to module, focusing on gallium and SiC raw materials, substrate and epi capacity, wafer fabrication, and final module integration. It emphasizes operational chokepoints for the 2024-2033 period: where supply concentration is highest, where scaling physics is most unforgiving, and where regulatory moves can instantaneously reprice technical roadmaps.

    1. Upstream Materials: Gallium, Silicon and Carbon as Strategic Precursors

    For GaN, the critical mineral is gallium; for SiC, the critical precursors are high‑purity silicon and carbon. Unlike copper or nickel, these WBG feedstocks are not typically mined as primary products. Gallium is recovered from Bayer liquor in alumina refineries and from zinc process streams; silicon comes from quartzite reduction; and carbon is often petroleum‑based coke or coal‑derived. This byproduct character structurally limits supply elasticity.

    USGS reporting and IEA critical mineral assessments both underline gallium’s concentration risk, with China historically accounting for the overwhelming majority of refined primary gallium output, well above 90% of the global total, leaving only a handful of non-Chinese gallium and germanium suppliers as alternatives. Market work cited in Deloitte’s GaN/SiC overview and other sources approximates current gallium production around 500 metric tonnes per year, with the bulk originating from a very small number of alumina and zinc smelters [2].

    1.1 Gallium from Bauxite and Zinc: Process and Geography

    In the Bayer process for alumina, bauxite is digested in caustic soda at high temperature and pressure, dissolving alumina and co‑dissolving trace gallium. Gallium accumulates in the spent liquor over multiple cycles. Recovery typically involves cementation (using aluminum metal to displace gallium), solvent extraction, and electrolysis or distillation to produce crude gallium metal. Further refining (often multiple passes of zone refining) yields 4N-6N purity feedstock for GaN epitaxy.

    Operationally, gallium recovery layers new unit operations on legacy alumina flowsheets: solvent extraction mixers, electrolytic cells, high‑temperature distillation columns, and zone‑refining furnaces. These stages consume electricity and reagents but, more importantly, require tight process control to avoid contaminating gallium with sodium, iron, or other metallic impurities that would degrade GaN epitaxial quality.

    On the ground, a few facilities dominate:

    • Jinchuan Group and associated refineries in China (e.g., Gansu, Inner Mongolia): Integrated with large alumina operations that process bauxite from Bayan Obo and other deposits, these facilities are frequently cited as controlling a substantial share of global refined gallium output. Industry analysis referenced in [2] and [9] attributes around 30% of world gallium production to Jinchuan alone and indicates material is upgraded to roughly 4N purity for downstream GaN substrate producers, including Japanese and global customers.
    • ENRC (Eurasian Resources Group) assets in Kazakhstan: Gallium is recovered as a byproduct from aluminum smelting, with public expansion plans targeting incremental capacity in the mid‑2020s. Logistics via the Caspian and Black Seas create routing exposure to geopolitical disruptions and maritime chokepoints.
    • Additional gallium streams from Europe and Russia: Smaller refineries in France and Russia contribute non‑trivial volumes but remain constrained by aging smelter infrastructure and, in Russia’s case, by sanctions and financing restrictions.

    China’s July 2023 export licensing regime on gallium and germanium, since hardened into MOFCOM’s 2026 export rules, already illustrated how policy can reprice WBG devices. Scenario analysis in sources such as [9] explores potential next steps, including formal export quotas or tighter end‑use controls post‑2025. In modeled cases where non‑aligned exports are capped, spot gallium prices are projected to spike substantially—some scenarios cite levels around $1,200/kg by 2026—before stabilizing once alternative recovery lines ramp.

    From an operational risk standpoint, a single export licensing decision in Beijing can now propagate through epitaxy lines in Japan, substrates in Europe, and EV inverter production in North America within one model year. That linkage between alumina byproduct policy and traction inverter availability is structurally new.

    1.2 Silicon and Carbon Streams for SiC

    SiC begins with metallurgical‑grade silicon (MG‑Si) and carbon, typically produced via carbothermal reduction of high‑purity quartz in submerged‑arc furnaces. The classical Acheson or similar processes operate at temperatures above 2,000 °C, drawing substantial electrical power. The output is a mix of SiC and byproducts that undergo crushing, classification, and further refining steps.

    Upgrading to semiconductor‑grade SiC requires progressively tighter impurity control. Metallic contaminants (Fe, Al, Ti), oxygen, and nitrogen must be reduced to very low ppm or ppb levels, depending on target device breakdown voltage and lifetime. This upgrade typically relies on combinations of high‑temperature recrystallization, chemical vapor deposition (CVD) feedstock purification, and in some cases zone refining of silicon precursors prior to SiC boule growth.

    Key nodes include:

    • Quebec and other hydropower‑backed MG‑Si operations: Facilities such as Rio Tinto’s operations in Quebec produce MG‑Si and SiC precursors using hydropower, reducing direct emissions but exposing operations to hydrological variability and regional carbon policy shifts. Public reporting highlights capacities for both metallurgical silicon and higher‑purity streams suitable for downstream SiC applications [4].
    • Russian and Central Asian silicon producers: Prior to recent sanctions, plants in the Urals and Siberia supplied European and Asian SiC value chains. With sanctions tightening, scenario work assumes these flows either reorient toward non‑OECD buyers or become stranded, forcing EU device producers to rely more heavily on domestic or allied MG‑Si.
    • High‑purity carbon suppliers: Petroleum‑based cokes and specialty carbons used in SiC growth face their own ESG scrutiny due to upstream oil sands and heavy oil exposures. Substitution toward lower‑sulfur, lower‑metal carbons or bio‑based feedstocks is technically non‑trivial and introduces variability into boule growth processes.

    IEA’s Critical Minerals Review underscores that, while quartz and basic carbon sources are abundant, the bottleneck for SiC is the small subset of facilities able to consistently deliver ultra‑high‑purity precursors at scale. Power prices, carbon pricing, and environmental permitting all act as first‑order constraints on further capacity additions.

    2. Substrates: From Boules to 150–300 mm Wafers

    Once purified precursors are in hand, the next structural bottleneck is substrate production. SiC and GaN substrates define defect density, yield, and voltage capability; they also account for a disproportionate share of WBG device cost. Industry benchmarks routinely show SiC wafers priced an order of magnitude higher than equivalent‑diameter silicon wafers, largely because defect densities remain orders of magnitude higher and boule growth cycles are slow.

    For SiC, Physical Vapor Transport (PVT) dominates. High‑purity SiC source material and a seed crystal are held at elevated temperatures in graphite crucibles; SiC sublimates and recondenses on the seed, forming a boule. Thermal gradients and impurities can drive dislocations, micropipes, and basal plane defects. For GaN, substrate options include bulk GaN, GaN‑on‑SiC, and GaN‑on‑Si, typically realized via Hydride Vapor Phase Epitaxy (HVPE) or MOCVD on engineered templates.

    Conceptual visualization of the wide-bandgap device supply chain from raw materials to power modules.
    Conceptual visualization of the wide-bandgap device supply chain from raw materials to power modules.

    The structural bottleneck in WBG is no longer rare‑earth mining; it is the conversion of purified gallium and silicon into low‑defect 150–300 mm substrates under tight thermal and impurity control. Every incremental gain in wafer diameter or defect density ripples directly into EV range, data center power usage effectiveness (PUE), and radar performance.

    2.1 SiC Substrate Expansion: U.S., Japan, Europe, India

    Industrial reporting and company disclosures cited in [3], [4], and [6] highlight large SiC substrate expansions across the U.S., Japan, and Europe, often co‑funded under CHIPS‑style programs and national industrial policies.

    • Wolfspeed’s U.S. SiC projects: Wolfspeed has announced multi‑billion‑dollar programs in North Carolina and elsewhere to scale 200 mm SiC wafer production, with roadmaps and some third‑party commentary discussing eventual moves toward 300 mm formats [3][10]. PVT reactors, crystal furnaces, and slicing/polishing lines are all energy‑intensive and require highly skilled operators. Industry commentary points to tight labor markets—running into the low thousands of specialized engineers and technicians—as a non‑trivial ramp constraint.
    • Japanese expansions (e.g., Mitsubishi Electric): Public plans referenced in [6] describe significant capex into 200 mm SiC capacity for traction inverters and railway applications. Japan’s industrial base offers strong process discipline, but yen depreciation and imported tool costs have raised capex intensity when measured in local currency.
    • European substrate capacity (STMicroelectronics, onsemi, others): SiC substrate investments in Italy, Germany, and France link into broader EU efforts to secure power electronics supply for EVs, renewables, and grid applications. EU Chips Act provisions on local content and state aid create guardrails but also add compliance overhead for expansions [6].
    • Emerging Indian SiC initiatives: Announcements such as SiCSem’s planned fab highlight India’s intent to enter the SiC substrate and device value chain [8]. These projects typically target 150 mm and 200 mm wafers initially, with indigenous PVT reactor development and heavy dependence on imported precursors and tools.

    Across these nodes, reported defect reductions over the early‑to‑mid 2020s have improved usable wafer yields materially—industry sources discuss improvements on the order of tens of percent—but aggregate global capacity for 200 mm‑class SiC still lags projected EV and industrial demand well into the second half of the decade [3][4].

    2.2 GaN Substrates and Templates: GaN‑on‑SiC vs GaN‑on‑Si

    GaN relies on a more diverse substrate landscape:

    • GaN‑on‑SiC: Preferred for high‑power RF, radar, and some defense communication systems due to superior thermal conductivity and breakdown performance. Substrate suppliers in China, Japan, the U.S., and Europe use SiC boules sliced and polished to support MOCVD GaN growth, frequently targeting dislocation densities around 1×10⁹–1×1010 cm‑2 for RF applications [1].
    • GaN‑on‑Si: Dominant in consumer and data center power supplies, USB‑C chargers, and some automotive DC‑DC converters. Larger wafer diameters (200 mm and 300 mm) and lower substrate costs offset lower thermal conductivity compared with SiC. Dislocation densities are intrinsically higher due to mismatched lattice constants and thermal expansion; device architectures and buffer layers compensate.
    • Bulk GaN: Still smaller volume but strategically relevant for next‑generation vertical GaN devices targeting 1,200 V and above. Bulk GaN substrates require their own growth infrastructure (HVPE or ammonothermal processes) and compete directly with SiC for high‑voltage traction and grid roles.

    Supply risk is asymmetric. GaN‑on‑Si substrate lines can, in principle, attach to legacy silicon wafer infrastructure, with foundries in Taiwan, Europe, and the U.S. adding epitaxial reactors. GaN‑on‑SiC, by contrast, is doubly exposed—to gallium constraints and to SiC boule availability. Chinese integrated players such as San’an and SICC, as noted in [1], operate large GaN‑on‑SiC substrate and epi facilities, many of which are subject to export scrutiny under various RF and defense‑related control regimes.

    3. Epitaxy and Wafer Fabrication: The Foundry Layer

    Epitaxial growth adds the active device layers—drift regions, channels, buffer layers—onto substrates. For GaN this primarily uses MOCVD; for SiC it often uses epitaxial CVD. These steps are among the most technically sensitive in the chain, determining breakdown voltage, on‑resistance, switching speed, and long‑term reliability.

    Wafer fabrication for WBG devices uses many standard CMOS unit operations (lithography, dry etch, implant or diffusion, metallization), but with higher temperature budgets, different die layouts, and higher stress from packaging. GaN high‑electron‑mobility transistors (HEMTs) are commonly lateral at 650 V; SiC MOSFETs are vertical up to and beyond 1,200 V. Vertical GaN roadmaps target 1,200 V and above, blurring role boundaries with SiC [3].

    3.1 Key Foundry and IDM Nodes

    The WBG foundry landscape mixes pure‑play foundries with integrated device manufacturers (IDMs):

    • Taiwan‑based GaN/SiC foundries: Facilities such as Powerchip’s P5 fab in Tongluo, discussed in [1], combine GaN and SiC processing on 200 mm and, over time, 300 mm lines. Their relevance extends beyond discrete devices to co‑packaged memory and power solutions for AI data center modules, blending DRAM and GaN power management on shared packaging platforms.
    • Infineon’s Kulim (Malaysia) and Villach (Austria) sites: Following the acquisition of GaN Systems, Infineon has positioned Kulim as a hub for high‑volume GaN‑on‑Si epi and device manufacturing on 300 mm wafers [6][8]. Villach complements this with GaN and SiC power module assembly for data centers and renewables. Monsoon flooding and regional climate risk introduce intermittent physical disruption risk to Kulim, while energy prices and labor markets weigh more heavily in Austria.
    • onsemi and STMicroelectronics in Europe and North America: onsemi’s EliteSiC platform and ST’s Catania SiC lines are central to EV and industrial drive markets [4][6]. Both companies increasingly internalize epi on captive substrates, reducing external dependency but raising capital intensity and tool supply risk.
    • GlobalFoundries and U.S. GaN foundries: Sites such as GlobalFoundries’ Vermont fab provide GaN‑on‑Si capacity for 5G front‑ends and data center power supplies, often under security and export‑controlled frameworks [8]. These fabs benefit from established 200 mm/300 mm toolsets but face qualification demands for defense and aerospace customers.
    • Chinese GaN/SiC fabs: A growing cluster of Chinese foundries and IDMs serve domestic 5G, EV, and industrial demand. While some of this capacity is cost‑competitive, access for foreign customers is constrained by both Western export controls and Chinese policies prioritizing internal supply for “new infrastructure” and strategic sectors.

    Across these sites, the key equipment set—MOCVD reactors, SiC epi tools, high‑temperature furnaces—relies on a narrow group of suppliers primarily in Europe, Japan, and the U.S. Export controls on advanced tools for compound semiconductors have so far been more targeted than for leading‑edge logic, but policy proposals in the U.S. and allied countries increasingly mention GaN and SiC due to their role in high‑power RF and directed‑energy systems.

    3.2 Technical Scaling: 200 mm and 300 mm Transitions

    Moving SiC and GaN from 150 mm to 200 mm and 300 mm wafer diameters is not a simple rerun of silicon’s historical scaling. Crystal growth, wafer bow, thermal budget, and defect propagation all become more challenging. Industry roadmaps cited in [3] and [4] describe a multi‑year progression in which 200 mm becomes the workhorse diameter for SiC in the mid‑2020s, with 300 mm as a longer‑term target requiring substantial materials innovation.

    The 300 mm transition in SiC behaves less like a routine node shrink and more like building an entirely new materials industry inside the existing semiconductor stack. Learning curves on new boule diameters, slicing, and polishing drive yield volatility, while capex for larger‑chamber reactors and crystal furnaces scales non‑linearly with diameter.

    Some analyses, including [3], model 300 mm SiC adoption as capable of lowering cost per die on the order of 30–40% once high yields are reached. that said, those same models assume stabilization periods of well over a year between pilot production and high‑volume manufacturing, during which defectivity and line output fluctuate. For risk managers, this introduces a timing problem: aligning EV and inverter platform launches with a substrate generation still working through ramp instability.

    Geographic distribution of critical wide-bandgap materials and manufacturing capacity.
    Geographic distribution of critical wide-bandgap materials and manufacturing capacity.

    4. From Die to Module: Packaging, Thermal Interfaces, and Reliability

    WBG devices realize system‑level benefits only once embedded in robust modules: discrete packages for chargers, half‑bridge and full‑bridge modules for EV traction, multi‑chip RF line‑ups for radar and base stations. Packaging is where semiconductor physics meets copper, ceramics, and thermal grease.

    SiC MOSFETs for 800 V EV platforms typically sit in modules that must handle repetitive high dV/dt and dI/dt, wide temperature swings, and mechanical vibrations. GaN devices for data center power supplies run at higher switching frequencies, shrinking magnetics and capacitors but compressing thermal margins in smaller form factors.

    4.1 Module Technologies and Emerging Bottlenecks

    Key technical features of modern WBG power modules include:

    • Substrates and baseplates: Direct‑bonded copper (DBC) or active metal brazed (AMB) substrates, often based on alumina, aluminum nitride, or silicon nitride ceramics, balance thermal conductivity, mechanical robustness, and cost. Si3N4 is gaining share for high‑reliability automotive and rail applications.
    • Interconnects: The industry is shifting from traditional aluminum wire bonds to copper wire, copper clips, or sintered silver and copper layers. Analyses referenced in [4] describe cost reductions of roughly 20% in some module families when moving from gold wire bonding to high‑volume copper clip processes, alongside improved current handling and thermal performance.
    • Thermal management: Junction‑to‑case thermal resistance remains a primary constraint, especially for compact GaN modules. Figures around 0.5 K/W or lower are often targeted for high‑power automotive modules, demanding careful stacking of die attach, substrate, baseplate, and interface materials.
    • Reliability and standards: Automotive‑grade GaN and SiC modules must pass AEC‑Q101/Q102 and extended mission‑profile testing. Grid and aerospace applications impose their own qualification regimes, further lengthening time‑to‑market for new package designs.

    Packaging supply chains are geographically more diverse than substrate or epi capacity. Module assembly occurs in North America, Europe, Japan, Southeast Asia, and China. Labor and land cost differentials favor Southeast Asia and parts of China for high‑volume, cost‑sensitive modules, while security‑sensitive or defense‑linked modules often remain in the U.S., Japan, or Europe under controlled supply chains.

    Compliance adds friction. U.S. regulations such as the Uyghur Forced Labor Prevention Act have already led to detentions of some electronics imports where polysilicon, metals, or other upstream materials trace to high‑risk regions. Even when WBG module BOMs do not explicitly include those inputs, traceability systems increasingly need to map back through suppliers’ suppliers, adding overhead for sourcing and audit teams.

    5. Cross‑Cutting Risks 2024–2033: Geopolitics, Scaling Physics, and ESG

    The WBG chain faces three intertwined classes of risk: geopolitical concentration and controls; scaling physics at substrates and epi; and ESG‑driven policy and financing constraints. None of these operate in isolation.

    5.1 Geopolitical Concentration and Export Controls

    Gallium is structurally the most exposed. With China historically responsible for the overwhelming majority of refined gallium output and Europe, Japan, and the U.S. heavily dependent on imports, the 2023 export license regime was a clear signal. Scenario modeling in [2] and [9] explores tighter regimes from 2025 onward, including volume caps differentiated by country group and explicit end‑use screening for RF and defense applications.

    On the device side, U.S. and allied export controls are increasingly attentive to GaN and SiC as enablers for advanced radar, electronic warfare, and hypersonic systems. Proposals often grouped under “BIOSECURE” or similar banners in U.S. legislative discussions contemplate restrictions on sourcing from, or manufacturing in, Chinese fabs for critical‑infrastructure and defense‑adjacent applications. Even if such measures are phased in gradually, they introduce planning uncertainty for OEMs relying on mixed‑geography supply chains.

    Russia‑related sanctions further complicate MG‑Si and carbon feedstock flows into Europe, with some SiC precursor streams effectively off‑limits for EU and U.S. buyers since 2022–2023. Arctic or alternative routes often imply longer transit times and higher shipping costs, reshaping relative economics between regional supply options.

    5.2 Scaling Physics and Capacity Ramps

    Substrate and epi scaling risks differ from the familiar Moore’s Law template. In WBG, higher voltage ratings and current densities often demand more material and higher crystal quality, not less. Moving from 650 V to 1,200 V devices raises requirements on epitaxial thickness, doping uniformity, and defect control, increasing processing time and tool utilization even before diameter scaling.

    Industry analyses such as [3] suggest that each new wafer diameter generation for SiC can consume 12–18 months of yield‑learning before stabilizing at high‑volume manufacturing yields. During this window, effective capacity is materially lower than nameplate. Foundries and IDMs frequently prioritize automotive and defense‑linked contracts under allocation, leaving smaller industrial and consumer segments more exposed to shortages or lead‑time spikes.

    In WBG, CAPEX alone does not guarantee supply; process maturity and defect learning curves are the real currency of capacity. Large, subsidized fabs can still run “empty” in yield‑adjusted terms if crystal growth, epi, and process integration issues are not solved on schedule.

    5.3 ESG, Water, and Carbon Constraints

    Upstream, bauxite mining and alumina refining face increasing scrutiny over red mud disposal, water use, and community impacts. Adding gallium recovery to these flows may improve the overall value and critical‑mineral profile of existing assets but does not eliminate underlying ESG concerns. Projects in water‑stressed regions, such as parts of Inner Mongolia, have already been subject to output or expansion constraints linked to local water regulations.

    Structure of a silicon carbide power module used in high-voltage EV traction inverters.
    Structure of a silicon carbide power module used in high-voltage EV traction inverters.

    SiC precursors, produced in high‑temperature furnaces, are electricity‑intensive. Where grid mixes are coal‑heavy, SiC embedded emissions can be materially higher than for silicon produced in hydro‑backed regions. As EU and other jurisdictions consider product‑level carbon labeling and border adjustment mechanisms, these upstream profiles begin to matter for downstream device and module acceptance, not only for corporate ESG scoring but for regulatory compliance.

    At the fab and module‑assembly level, WBG expansion intersects with local air, water, and waste rules. Nitrides and fluorinated gases used in etch, deposition, and cleaning steps fall under evolving HF, NF3, and F‑gas regulations. Wastewater from polishing and slicing of SiC boules contains fine particulate SiC and metals that require advanced treatment systems. These compliance layers add fixed and variable costs and elongate permitting timelines for new projects.

    6. Observed Supply Configurations and Trade‑Offs

    The WBG supply chain is not converging on a single optimal configuration. Instead, distinct patterns are emerging, each with its own risk and cost profile.

    6.1 Deeply Integrated vs Distributed Models

    Some IDMs pursue vertical integration from substrate through module, especially in SiC for EVs and industrial drives. This model internalizes substrate and epi risk but raises capital intensity, tool dependency, and single‑company exposure to process‑yield challenges. It tends to favor companies large enough to amortize high fixed costs across multi‑sector demand.

    In parallel, a distributed model persists in which substrate specialists, epi houses, foundries, and outsourced assembly and test (OSAT) providers each handle one link. This configuration can be more flexible and cost‑efficient, but it depends on contract structures, long‑term wafer agreements, and the durability of cross‑border logistics under political stress.

    6.2 GaN vs SiC Allocation by End‑Use

    Allocations between GaN and SiC are also evolving rather than fixed. Deloitte’s work and other market analyses [2][7] broadly associate SiC with high‑power EV traction, rail, and industrial drives, and GaN with high‑frequency, mid‑power applications such as data center PSUs, consumer fast charging, and RF. Over the next decade, however, vertical GaN progress, combined with packaging and cooling innovation, could push GaN further into roles currently dominated by SiC, especially in regions or segments more constrained on SiC substrate supply.

    Conversely, SiC could displace some GaN in automotive on‑board chargers and DC‑DC converters where OEMs and Tier‑1s prefer single‑material platforms for qualification efficiency and long‑term reliability data accumulation.

    6.3 Industrial Resilience and Financing Logic

    From the standpoint of industrial resilience and operational continuity, WBG fabs, substrate plants, and even key upstream smelters are increasingly treated as critical infrastructure rather than just production assets. Public subsidies, loan guarantees, and long‑term off‑take agreements in the U.S., EU, Japan, and elsewhere are less about financial return optimization and more about ensuring that high‑voltage EV platforms, defense systems, and national grids are not hostage to a single foreign bottleneck.

    In practice, this leads to hybrid financing structures. Large SiC programs blend corporate capex with government grants and strategic offtake commitments; gallium recovery expansions attach to broader alumina upgrades justified partly on critical‑mineral security grounds. For risk managers, the key is that these facilities now sit under a different political and regulatory lens than commodity smelters or generic OSAT houses.

    7. Conclusion: A Materials‑First View of WBG Power

    The WBG revolution is often narrated through device metrics—on‑resistance, breakdown voltage, switching frequency. A materials‑first view tells a different story. It shows how 500 metric tonnes per year of gallium, produced largely as a byproduct in a few bauxite refineries, and a limited number of ultra‑high‑purity SiC boule lines now constrain the trajectory of EVs, AI data centers, and strategic defense systems.

    Technical advantage in WBG is increasingly defined not just by who designs the fastest transistor, but by who controls and de‑risks substrate, epi, and module capacity under tightening regulatory and ESG constraints. Choices around integration depth, geographic diversification, and technology roadmaps (GaN vs SiC, 200 mm vs 300 mm) will shape how resilient national and corporate electrification strategies prove to be under stress.

    Materials Dispatch continues to track weak signals across this chain—from MOFCOM export filings and USGS gallium data to tool shipment patterns, utility interconnection queues for new fabs, and changes in automotive inverter specifications—that will determine how the WBG supply landscape actually evolves versus headline projections.

    Note on Materials Dispatch methodology Materials Dispatch links text monitoring of regulatory and policy sources (including MOFCOM releases and U.S./EU export control updates) with market and capacity data from industry reports and company disclosures. These are cross‑checked against end‑use technical specifications in EV, data center, telecom, and defense systems to understand not only where bottlenecks lie today, but how changes in materials, wafer formats, or packaging will propagate through real industrial architectures.

    Sources

    • [1] Stratistics Market Research, Compound Semiconductor Foundry Services
    • [2] Deloitte, Beyond silicon: GaN and SiC semiconductor technology
    • [3] TokenRing article, The power revolution: How GaN and SiC semiconductors are electrifying the AI and EV era
    • [4] Global Market Insights, Silicon Carbide Market
    • [5] Market Data Forecast, Silicon Carbide Market
    • [6] Precedence Research, Power Semiconductor Market
    • [7] SkyQuest, GaN and SiC Power Semiconductor Market
    • [8] GlobeNewswire, Compound Semiconductor Materials Market
    • [9] Discovery Alert, Investment Psychology & Critical Minerals Capital Allocation
    • [10] Semiconductor Industry Association, Chip Supply Chain Investments
    • USGS, Gallium Statistics and Information
    • IEA, Critical Minerals Market Review 2025
  • Why Ga, Ge and Rare Earth Refining Fails at Pilot Scale

    Why Ga, Ge and Rare Earth Refining Fails at Pilot Scale

    Gallium, germanium and rare earth processing in current U.S. projects is not constrained by geology but by flowsheet reality: impurity management, solvent extraction hydrodynamics, and scale-up of electrochemical and membrane systems define what can actually operate at industrial scale between 2022-2025.

    Processing flowsheets, not ore bodies, are now the binding constraint on U.S. gallium (Ga), germanium (Ge), and rare earth element (REE) supply. The core technical reality is simple: ores and byproducts are increasingly accessible, while proven, compliant, and scalable processing routes remain the hard constraint. The current U.S.-led projects between 2022 and 2025 illustrate this tension with unusual clarity, where bench-scale yields above 90% routinely fall to 70-80% once continuous operation begins.

    The United States is rebuilding capabilities in materials where China currently dominates refined supply: refined Ga and Ge are heavily concentrated, and REEs are still largely processed through Chinese-controlled solvent extraction (SX) hubs. DOE-funded programs, university-industry pilots, and national lab initiatives are testing a new generation of flowsheets using coal byproducts, acid mine drainage (AMD), and unconventional carbonatites. This article dissects those flowsheets from an operational perspective: unit operations, energy and reagent demands, impurity management, and the failure modes that emerge when bench chemistry hits continuous pilot scale. For the broader supply picture, see our map of the top 10 non-Chinese gallium and germanium supply options.

    Across Ga, Ge, and REEs, the pattern is consistent. Leaching and initial dissolution are relatively mature. Real bottlenecks appear where selectivity, phase behavior, and equipment reliability intersect: co-precipitation in pH-controlled impurity removal, SX organic degradation under real impurity loads, and electrode or membrane fouling in advanced electrochemical systems. These are not academic issues; they directly determine whether domestic projects can meaningfully offset China-centric processing in the medium term.

    What is the real operational question for Ga, Ge and REEs?

    Export licensing controls on Chinese gallium and germanium products, imposed from 2023 onward, exposed how concentrated these supply chains had become. Public data and industry statistics show that China accounts for the overwhelming majority of refined Ga and Ge output and a dominant share of REE separation capacity. At the same time, U.S. and allied industrial policy—through instruments such as the Bipartisan Infrastructure Law (BIL) and targeted DOE funding calls—has pushed for domestic or friendly-jurisdiction recovery from secondary feeds: coal/lignite, zinc residues, AMD, and carbonatite deposits.

    The operational question is no longer whether gallium, germanium, and REE units exist in those feedstocks. They clearly do, typically in the tens to hundreds of ppm range for Ga and Ge and percent-level for REE oxides in enriched ores and concentrates. The question is whether flowsheets can deliver consistent, on-spec material at industrially relevant scale without prohibitive energy, reagent, or compliance penalties. That requires a sober look at each unit operation across three intertwined systems:

    • Gallium flowsheets, largely as a byproduct from zinc, bauxite, coal, and carbonatites.
    • Germanium flowsheets, from zinc slags and coal-derived concentrates.
    • REE flowsheets, from monazite, bastnäsite, coal byproducts, AMD, and carbonatites, often co-recovering Ga and Ge.

    The following sections analyze representative flowsheets being tested in U.S. pilots and lab-pilot bridges, with specific attention to the points where laboratory yields collapse or OPEX escalates once hydrodynamics, erosion/corrosion, and real-world feed variability are introduced.

    How do gallium flowsheets behave unit by unit?

    Gallium is classically a byproduct metal. It is present in bauxite (via the Bayer process), zinc refinery residues from sphalerite ores, coal and lignite ash, and certain carbonatites. Contemporary U.S. pilots draw heavily on zinc residue and coal-based flowsheets, adapted from historical European and Australian practice but updated with modern SX chemistry and emission standards. A typical zinc-residue-based flowsheet proceeds through leaching, impurity precipitation, solvent extraction, and electrowinning or cementation followed by refining.

    Feedstock Preparation and Acid Leaching

    Zinc refinery residues or similar intermediates, often containing Ga and Ge in the 0.1–0.5% range, are ground and conditioned for leaching. A benchmark flowsheet employs sulfuric acid leaching at elevated temperature, for example around 80 °C with moderate acid strength and an elevated liquid–solid ratio. Under optimized conditions reported in the technical literature, leaching recoveries can approach nearly complete dissolution for gallium and high but somewhat lower recoveries for germanium.

    The first major constraint appears immediately: co-dissolution of iron and aluminum, often contributing more than 20% of the liquor mass. Ferric iron in particular forms strong complexes, drives viscosity up, and interferes with later SX selectivity and phase disengagement. One commonly reported mitigation is partial reduction of ferric to ferrous iron using SO₂ or similar reductants, coupled with staged neutralization. This improves downstream yields but introduces its own CAPEX and permitting footprint, including gas handling and off-gas treatment infrastructure.

    From an execution standpoint, leaching is not limited by chemistry but by impurity management strategy. Plants that under-invest in front-end impurity control find that they have simply moved the problem into larger, more complex, and more sensitive downstream circuits.

    Impurity Precipitation and pH Windows

    Following leaching, the liquor carries Ga and Ge alongside a broad suite of base metal impurities (Al, Fe, Zn, Cd, Pb, Cu, and others). Standard practice uses staged pH elevation with calcium hydroxide, magnesium compounds, and sodium hydroxide to precipitate these impurities as hydroxides or basic salts. In some zinc-derived flowsheets, Mg-based reagents are used to pull germanium into a germanate-rich precipitate while leaving most gallium in solution.

    The operational difficulty lies in the narrow pH windows. Published case studies show that once pH drifts above the mid-4 range, gallium starts to co-precipitate significantly with germanium and other hydroxides, leading to losses on the order of tens of percent from the soluble Ga pool. Conversely, running too acidic allows troublesome levels of iron, aluminum, and heavy metals to pass forward. Historic pilot work (including operations at Pasminco’s former zinc complexes) documented batch rejections of a substantial fraction of production due to variable residue composition and imperfect pH control.

    Automated pH control, rapid mixing, and sufficient residence time are not glamorous topics, yet they consistently differentiate stable flowsheets from those that oscillate between impurity breakthrough and co-precipitation losses. The most advanced chemistries cannot rescue a flowsheet where this basic control loop is fragile.

    Solvent Extraction for Gallium Recovery

    Once a reasonably clean gallium-bearing solution is prepared, SX steps in as the workhorse separation tool. Organophosphorus extractants such as D2EHPA or related phosphoric/phosphonic acids are typically deployed in multiple stages, with gallium loaded into the organic phase and then stripped with an acidic solution to yield a concentrated gallium liquor.

    Bench data commonly report gallium extraction efficiencies above the mid-90% range with similar performance in stripping. However, those figures assume reasonably benign impurity profiles. Real residues from coal-derived feeds and complex zinc sludges routinely carry arsenic, antimony, and organic matter that can degrade the organic phases, shorten SX cycle life, and promote stable emulsions. Germanium can also co-extract at the 5–10% level, forcing either a dedicated Ge SX front-end or complicated bleed and recycle strategies. Each added SX circuit roughly doubles the organic inventory and increases sensitivity to foaming, crud formation, and solvent losses.

    This is one of the recurring structural findings in current U.S. flowsheets: SX is extremely powerful, but every additional separation target and every poorly controlled impurity multiplies not just complexity but also the number of failure modes to monitor.

    Electrowinning and High-Purity Gallium Refining

    After SX, gallium-rich strip liquors are treated via electrowinning or cementation to recover metallic gallium. Electrowinning onto aluminum cathodes at moderate temperatures and voltages is standard. Reported current efficiencies often fall below ideal values due to hydrogen evolution, side reactions, and electrode fouling, resulting in meaningful energy consumption per kilogram of gallium produced.

    Scaling from laboratory cells to multi-tonne per year pilots tends to reveal hidden maintenance burdens. Thin gallium deposits can spall; impurities like arsenic or silica embed in cathode films; and anode sludges accumulate faster than expected. Some pilots have reported double-digit percentages of downtime tied to cleaning cycles and electrode replacement. Final purification to 4N (99.99%) and beyond often relies on zone refining or vacuum distillation, which add additional electricity and equipment overhead but are relatively straightforward once bulk metal is in hand.

    For defense-grade GaAs semiconductor applications, these last refining steps are non-negotiable. The upstream flowsheet is therefore judged not only on total recovery but also on its ability to deliver a feed that can be upgraded to electronics-grade without heroic batch rework.

    Integrated processing flowsheet for gallium, germanium, and rare earth elements from diverse feedstocks.
    Integrated processing flowsheet for gallium, germanium, and rare earth elements from diverse feedstocks.

    Coal Byproduct versus Zinc Residues: Logistics and Scale

    DOE-sponsored pilots such as the Microbeam–University of North Dakota program are pioneering gallium recovery from lignite and coal combustion byproducts. These flowsheets broadly parallel the zinc-residue route—acid leaching, impurity precipitation, gallium/germanium SX—but begin from very large tonnages of low-grade material. While this path avoids the long timelines and permitting complexity of new mines, it introduces a logistics problem: thousands of tonnes of lignite or ash need to be moved, stockpiled, and fed to central plants for relatively small amounts of Ga and Ge.

    Rail and trucking requirements, material handling infrastructure, and weather-related disruptions become non-trivial OPEX drivers. Internal analyses from project partners indicate that logistics alone can add double-digit percentage uplifts to operating costs compared with treating concentrated zinc residues. Yet this approach can capitalize on existing power-sector waste streams and offer a compelling route to small but strategically important quantities of gallium concentrates in the low- to mid-single-digit MT/year range.

    Why are germanium flowsheets front-loaded for selectivity?

    Germanium flowsheets resemble gallium flowsheets but are typically structured to recover Ge earlier and more aggressively, reflecting its role in fiber optics, infrared optics, and specialty electronics. Ge-bearing zinc slags, coal/lignite ash, and certain polymetallic concentrates are the primary feeds in current U.S. programs, including the same Microbeam–UND integration where Ge and Ga are co-recovered from lignite-based REE concentrates.

    Leaching of Ge-Bearing Feeds

    Acid leaching with sulfuric or hydrochloric acid at elevated temperatures is again the starting point. Two-stage leaching sequences are often reported as optimal: a first aggressive leach to dissolve easily accessible germanium, followed by a second, somewhat milder stage to avoid excessive gangue dissolution. Recovery ranges into the 80–90% bracket have been cited for optimized circuits.

    However, feeds containing significant siderite (FeCO₃), common in some coal measures, buffer the acid and depress effective leaching efficiency by notable margins. Pilot work has shown that pre-roasting at temperatures around 600 °C can decompose carbonate phases, improving subsequent leach performance but generating CO₂ and SO₂ streams that complicate air permitting under tightened emissions frameworks. Roaster CAPEX and fuel costs add further friction.

    Precipitation and Early Germanium Capture

    Germanium is often captured as a hydrated oxide or germanic acid intermediate. Classical routes employ tannic acid, magnesium salts, or other organic–inorganic reagent systems to selectively precipitate germanium around pH values in the 4–5 range. Reported yields for these steps are high when the solution chemistry is well controlled.

    The tradeoff is that gallium and residual base metals can co-precipitate. Historic operations documented gallium co-precipitation in the 10–15% range when Ge was pulled early without prior SX separation. This may be acceptable where gallium is a minor byproduct, but becomes problematic in integrated Ga–Ge flowsheets. As with gallium, narrow pH windows and tight control of reagent dosing determine whether these precipitation steps deliver selective capture or simply generate mixed hydroxide sludge that requires re-treatment.

    Chlorination, Distillation, and Metal Production

    Once germanium is present as oxide, conversion to germanium tetrachloride (GeCl₄) followed by distillation remains a cornerstone of high-purity Ge production. Chlorination at elevated temperatures generates volatile GeCl₄, which can be distilled at relatively low boiling points and then hydrolyzed back to high-purity GeO₂. Subsequent reduction with hydrogen or magnesium yields metal.

    The technical and operational challenges center on corrosion and gas handling. Chlorine-containing environments at high temperature demand specialty alloys such as Hastelloy for reactors and piping, significantly lifting CAPEX compared with purely hydrometallurgical routes. In addition, some U.S. pilot work has reported non-trivial vapor losses of GeCl₄ during scale-up, pushing overall yields down from laboratory expectations. Gas capture, scrubbing, and condensate management systems therefore become central to flowsheet robustness rather than peripheral add-ons.

    Another critical constraint is hydrogen purity during final reduction. Sub-ppm levels of oxygen, moisture, or hydrocarbons can introduce defects in optical-grade GeO₂ used for fiber optics. This pulls in high-spec gas purification, leak detection, and quality assurance infrastructure that sits well beyond conventional base-metal metallurgy.

    Variability and Real-Time Characterization

    Germanium concentrations in coal and lignite feeds can vary substantially, with ranges of tens to hundreds of ppm within a single mine or seam. The DOE-funded Microbeam–UND project explicitly addresses this issue by combining beneficiation, XRF/LIBS sensing, and dynamic blending to stabilize feed quality into the hydromet circuit. Commissioning timelines reported for such integrated setups underline an important lesson: analytical infrastructure and control logic can be as gating as any reactor or SX mixer-settler.

    In essence, germanium flowsheets are a stress test of a project’s analytical discipline. Where feed characterization and process control are strong, Ge recovery steps can run close to bench expectations. Where they are weak, variability cascades into under- or over-dosing of reagents, phase instability, and ultimately wide swings in product purity.

    What makes rare earth separation the hardest flowsheet?

    Rare earth element processing sits at the heart of contemporary critical materials debates. While Ga and Ge flowsheets involve recovering ppm-level byproducts from base-metal or coal circuits, REE flowsheets deal with percent-level REO concentrates but face the opposite challenge: separating 17 chemically similar elements to multiple purity tiers across different end uses. U.S. projects under BIL and DOE FOAs are revisiting both classic solvent extraction approaches and newer electrochemical and membrane routes.

    Representative hydrometallurgical facility for critical mineral processing in a modern industrial setting.
    Representative hydrometallurgical facility for critical mineral processing in a modern industrial setting.

    Beneficiation and Leaching of REE Ores and Byproducts

    Classical hard-rock deposits such as bastnäsite and monazite undergo crushing, grinding, and flotation to yield REO concentrates. Carbonatite deposits like Sheep Creek in Montana, pursued by US Critical Materials, have reported total rare earth grades in the high-teens percent range and notable gallium credits in the 180–385 ppm band. Coal-based REE projects instead target fly ash, bottom ash, or specially processed coal-derived concentrates, typically with REE grades in the thousands of ppm. AMD projects treat large throughputs of acidic drainage with dissolved REEs at lower concentrations but continuous flow.

    Leaching chemistries vary with mineralogy. Sulfuric acid under elevated temperature and sometimes pressure is standard for many carbonatites and monazites, while hydrochloric systems may be favored for coal and AMD streams to facilitate chloride-compatible downstream separation. Fluoride-bearing feeds such as bastnäsite introduce another layer of complexity: formation of HF can drive severe corrosion, requiring titanium-lined autoclaves and upgraded ventilation and scrubbing, adding materially to plant CAPEX.

    Group Separation via Solvent Extraction

    Once in solution, REEs are commonly separated into light (LREE) and heavy (HREE + Y) groups via SX with extractants such as HEH(EHP) (often cited as P507). Light rare earths load more readily, enabling initial separation into a light-enriched organic phase and a heavy-enriched raffinate. Multiple mixer-settler stages (often in the range of several per group step) and complex pH gradients are used to sharpen separation.

    The selectivity factors between adjacent rare earths in these systems, however, are modest—often low single-digit numbers. Achieving high-purity oxides (99.9% and above) for dysprosium, terbium, neodymium, and others requires cascades of hundreds of stages when using conventional solvent and configuration choices. Energy usage per unit volume of liquor handled and organic solvent losses become structurally significant. Emulsion formation, crud accumulation, and phase inversion events are recurrent operational risks, particularly for coal-derived and AMD feeds carrying organic matter, sulfate soaps, and fine solids.

    This is where the gap often appears between planning documents and reality: theoretically elegant SX trains need to confront the fact that every additional stage is another chance for mechanical or chemical instability to propagate.

    Individual Separation, Precipitation, and Calcination

    After group splits, individual rare earths are produced through finer-grained SX circuits, ion exchange, or combinations thereof. Oxalic acid or carbonate precipitation then converts REE-bearing solutions into solid intermediates, which are calcined at temperatures around 800 °C to yield REE oxides. Further metal production uses metallothermic reduction or, in advanced research programs, ionic liquid electrolysis and plasma-based processes.

    Each additional separation step carries a tradeoff between purity, recovery, and plant complexity. For example, mid-REEs such as samarium and gadolinium can exhibit poorer stripping efficiency than the lightest or heaviest lanthanides, driving up recycle flows and solvent inventory. Field data suggest double-digit annual solvent losses in some pilot operations, underlining the importance of solvent regeneration and waste handling strategies both for OPEX and for environmental compliance.

    Electrochemical Membrane Reactors: Promise and Constraints

    An emerging variant is the electrochemical membrane reactor (EMR) approach being developed by Idaho National Laboratory with US Critical Materials for carbonatite leachates containing both REEs and gallium. In this concept, electrical potential, water, and nitrogen are used to drive selective transport and recovery of target metals without large volumes of organic solvents or classical extractants. Project communications indicate targeted REE and Ga recoveries exceeding 90% at bench scale.

    Early data show notable practical constraints. Silicate and other colloidal impurities in carbonatite leachates tend to foul membranes, reducing effective membrane life to hundreds of hours before cleaning or replacement is required. Overpotentials at industrially relevant current densities increase energy consumption per unit of REE recovered compared with optimized SX. Gas handling, electrode materials, and scaling behavior across large membrane areas are unresolved at industrial scale.

    The key insight is that EMR-style systems trade solvent management and large SX hall footprints for membrane integrity and electrochemical stability challenges. They do not eliminate complexity; they rearrange it.

    Co-Recovery of Other Critical Minerals

    Several AMD and coal-based REE projects aim to co-recover lithium, cobalt, nickel, gallium, and germanium. While technically attractive, this multi-target strategy can strain selectivity. For example, extractants tuned for lithium can exhibit significant loading of certain rare earths, contaminating lithium product streams and complicating downstream carbonate or hydroxide production. Conversely, REE-centric SX circuits may drag lithium or transition metals into raffinate or intermediate phases where they are harder to recover efficiently.

    The lesson from the most advanced flowsheets is that parallel circuits and selective bleed streams, rather than simple “catch-all” extractant systems, tend to offer more controllable outcomes—even at the expense of higher apparent complexity. Attempts to solve too many separation problems in a single SX or IX circuit often build in chronic cross-contamination that is expensive to remove later.

    How do integrated Ga–Ge–REE pilots perform in practice?

    Several U.S. initiatives now integrate gallium, germanium, and REEs within single flowsheets, aiming to extract maximum value from unconventional feeds.

    Microbeam–UND lignite project (North Dakota). This DOE-funded effort processes lignite-derived REE concentrates via acid leaching, followed by SX circuits for Ge and Ga, and then REE separation. Conceptual designs target concentrated Ge/Ga outputs in the single-digit MT/year range from a feed of roughly hundred-tonne-scale MREE concentrates per year. Technical disclosures highlight feed variability in Ge and Ga content (tens to hundreds of ppm), driving the adoption of real-time LIBS/XRF sorting and blending before leaching. Process flow diagram finalization has reportedly lagged behind initial timelines due to the need to stabilize this front-end variability.

    US Critical Materials–INL Sheep Creek carbonatite program (Montana). Here, high-grade carbonatite ore with substantial REE and gallium content is treated via EMR-based electrochemical recovery instead of classical SX. Publicly available materials present a “no additional reagents” vision using electricity, water, and nitrogen. Practically, this still entails careful control of gas purity (for nitrogen and other process gases), electrode materials, and pre-filtration to limit membrane fouling from silicate and carbonate particulates. External industrial gas supply logistics, especially in remote locations, become as critical as ore hauling.

    Contrasting the key process differences between gallium, germanium, and rare earth element flowsheets.
    Contrasting the key process differences between gallium, germanium, and rare earth element flowsheets.

    AMD-based REE and co-product recovery under DOE FOA 2619. Selected projects process sizeable AMD flows—hundreds of gallons per minute—through SX-based circuits designed to produce tens of tonnes per year of REE products, with side-streams aimed at Ga and Ge recovery where feed chemistry allows. These flowsheets bypass greenfield mining and instead turn a legacy environmental liability into a critical-mineral source. At the same time, permitting for AMD capture and treatment infrastructure often front-loads two or more years of engagement with environmental regulators, landowners, and existing mine operators.

    Across all three models, two cross-cutting constraints dominate: impurity management (As, Sb, silica, organic matter) that degrades SX and membranes, and the systematic loss of recovery when scaling from beaker to continuous pilot. Bench-top yields in excess of 90% often translate to 70–80% in pilot operation once real hydrodynamics, phase disengagement times, and recycle loops come into play.

    Which constraints and tradeoffs recur across all three?

    Despite differences in feedstocks and target products, gallium, germanium, and REE flowsheets encounter a common set of technical choke points. These can be summarized by unit operation, typical constraint, and operational impact.

    Unit Operation Typical Constraint Impact on Yield / OPEX Observed Mitigation Approaches (2022–2025 U.S. Pilots)
    Leaching Co-dissolution of Fe/Al and carbonate buffering Yield loss and higher downstream reagent demand Pre-roasting, reductive conditions, staged acid addition
    pH-Controlled Precipitation Narrow pH windows; co-precipitation of Ga/Ge Batch rejections; Ga/Ge losses in sludges Multistage pH cascades, improved mixing, real-time pH and ORP monitoring
    Solvent Extraction (Ga/Ge/REE) Limited selectivity between similar species; emulsions; organic degradation More stages; higher energy and solvent makeup; downtime Optimized extractant systems, demulsifiers, continuous crud management
    Electrowinning / Electrolysis Electrode fouling; side reactions (H₂ evolution) Lower current efficiency; maintenance-driven downtime Pulse current regimes, refined electrolyte chemistry, scheduled cleaning cycles
    Electrochemical Membrane Reactors Membrane fouling by silicates and organics; overpotentials Shorter membrane lifetimes; higher kWh per kg metal Pre-filtration, slurry conditioning, membrane module redundancy

    A recurring pattern emerges from this comparison. Leaching is typically not the rate-limiting step; relatively standard chemical engineering approaches can achieve high dissolution rates. Instead, the constraints are dynamic: pH drift, phase behavior in SX, and physical fouling in electrochemical units. In other words, what appears as a purely “chemical” problem on paper is often a control and materials-handling problem in the real plant.

    There is also a clear tradeoff between reagent intensity and equipment intensity. Classic hydrometallurgical flowsheets (acid leaching + SX + precipitation) consume significant reagents and generate sizable liquid and solid wastes but rely on well-understood, relatively forgiving equipment. Newer EMR or membrane-based approaches aim to reduce reagents and waste volume at the cost of high-spec membranes, more sophisticated electrochemical control, and tighter water quality requirements.

    How do compliance, environmental, and logistics realities shape design?

    Environmental compliance is not a parallel track; it directly shapes flowsheet design. Rare earth and Ga/Ge circuits inherently involve acids, bases, chloride or sulfate systems, and potentially toxic impurities like arsenic and cadmium. Wastewater treatment, neutralization, solid residue stabilization, and air emissions control define not only permitting timelines but also long-term operating risks.

    In the United States, major DOE-supported pilots fall under NEPA review, with environmental assessments and, in some cases, full environmental impact statements. These can stretch timelines by several quarters but also create a framework for robust water management, tailings or residue handling, and emissions control. Projects introducing novel reagents or extractants may also intersect with TSCA requirements, particularly if organic SX systems or ionic liquids fall outside existing regulatory experience.

    On the logistical side, the contrast between centralized, high-grade operations and distributed, low-grade feed utilization is stark. AMD and coal byproducts offer short lead times and no exploration risk, but they imply high volumes, dispersed sites, and sensitive stakeholder relationships (utilities, mining legacies, landowners). Carbonatite or hard-rock REE operations carry more traditional mining footprints but can deliver far higher grades and simpler logistics for the processing plant, at the cost of longer mine permitting and development sequences.

    Resilience-oriented analysis therefore often focuses less on headline capacities and more on the vulnerability of each flowsheet to single-point failures: a rail line outage for lignite shipments, a nitrogen supply disruption for EMR-based gallium circuits, or a SX organic supplier issue for REE separation plants.

    What structural options are emerging for Ga, Ge and REE processing?

    Considering the technical and regulatory landscape, several structural configurations for Ga, Ge, and REE processing are emerging in North America and allied jurisdictions:

    • Byproduct-centric hubs. Zinc, aluminum, and coal-related sites add Ga/Ge/REE recovery circuits, leveraging existing infrastructure and permitting but dealing with complex impurity suites and logistics.
    • Dedicated REE + Ga carbonatite plants. High-grade deposits such as Sheep Creek anchor integrated plants that use SX, EMR, or hybrids to co-produce REE oxides and gallium concentrates, with germanium potential where present.
    • AMD treatment clusters. Regional AMD sources feed centralized processing, allowing modular expansion and flexible feed blending at the expense of strong dependency on environmental and regulatory frameworks.

    Historically, similar patterns were seen in the evolution of niobium and tungsten processing. Early niobium production tied to pyrochlore projects was dominated by a handful of integrated mines with captive processing, while secondary recovery from slags and byproducts struggled to find stable flowsheets. Tungsten has likewise oscillated between mine-centered and scrap/byproduct-centered supply, with flowsheet complexity often determining which route dominated at any given time.

    The key structural insight is that flowsheets act as amplifiers of upstream volatility. Flexible, impurity-tolerant flowsheets can accommodate variable byproduct streams and incremental expansions. Highly optimized but narrow-window flowsheets deliver excellent economics under ideal conditions but are brittle under feed or regulatory shocks. Ga, Ge, and REE projects now being built will reveal over the next few years where along this spectrum the current generation of technologies truly sits.

    What really governs Ga, Ge and REE flowsheet performance?

    Across gallium, germanium, and rare earth processing, one pattern recurs: geology sets the stage, but hydrometallurgical and electrochemical flowsheets decide industrial reality. High leach recoveries on paper do not guarantee viable supply; the decisive factors are impurity management, SX and membrane stability, and the interaction between control systems and variable feeds.

    Hydrometallurgical circuits with extensive SX deliver high purity and proven scalability but carry heavy reagent, water, and waste burdens. Electrochemical and membrane-based innovations promise leaner reagent footprints and potentially smaller environmental stacks but transfer complexity into materials science and electrochemical control. Integrated Ga–Ge–REE flowsheets increase value density yet multiply interfaces where instability can emerge.

    Materials Dispatch tracks these developments as indicators of future supply resilience, watching not only headline announcements but also weak signals from pilot data, permitting documentation, and technical disclosures from programs such as DOE FOA 2619 and related initiatives. The way these early flowsheets handle impurities, scale-up losses, and regulatory constraints will quietly determine how much of the Ga, Ge, and REE supply chain truly diversifies in the coming decade.

    Note on Materials Dispatch methodology Materials Dispatch integrates patent filings, technical papers, DOE and USGS reporting, and policy releases from entities such as MOFCOM to reconstruct how flowsheets evolve in practice, not just in design. This article combines open technical data on Ga/Ge/REE processing with analysis of end-use purity requirements in semiconductors, magnets, and optics to identify where operational bottlenecks are likely to emerge first.

    Sources and Further Reading

    • NETL / DOE Project FE0032124 – Microbeam Technologies and University of North Dakota lignite-based REE, Ga, and Ge recovery project documentation.
    • Technical papers on gallium and germanium recovery from zinc refinery residues and coal byproducts presented at international Pb-Zn and ICSOBA conferences.
    • US Critical Materials and Idaho National Laboratory materials on electrochemical recovery of gallium and rare earths from Sheep Creek carbonatite.
    • DOE BIL Critical Minerals FOA 2619 project selection summaries for REE and critical mineral advanced processing.
    • USGS Germanium statistics and related critical mineral assessments detailing global production and refining concentration.
    • Recent solvent extraction optimization studies for coal-based REE streams in peer-reviewed chemical engineering journals.
  • Lynas, MP Materials and the Rare Earth Suppliers Outside China

    Lynas, MP Materials and the Rare Earth Suppliers Outside China

    As of mid-2026, the rare earth supply chain outside China rests on two anchors: Lynas Rare Earths and MP Materials. Together they cover roughly a quarter to a third of global demand, backed by a thin second tier of emerging projects in Australia, North America, the Middle East and Brazil. The system is structured but brittle: concentrated in a few strategic assets and exposed to a persistent neodymium-praseodymium (NdPr) and heavy rare earth (HRE) deficit.

    Key Findings on 2026 Rare Earth Supply Resilience

    • Lynas and MP Materials form the backbone of non‑Chinese rare earth supply, but both rely on complex multi‑jurisdictional processing chains that introduce logistical and regulatory single points of failure.
    • The non‑Chinese NdPr deficit and even tighter HRE balance create a structurally “brittle” system: modest delays at one or two facilities can cascade into multi‑sector constraints for EVs, wind, and defense.
    • US Department of Defense (DoD) funding and Australian policy support underpin several projects, but tie long‑term availability to political and budget cycles as much as to geology.
    • Emerging projects (Arafura Nolans, Maaden-MP JV, Browns Range, Eneabba and others) are strategically important as diversification levers, yet most remain exposed to schedule risk, permitting friction, and infrastructure constraints.
    • Shipping routes, water availability, and radioactive waste rules are not side issues; they are central to uptime and ramp‑up reliability for nearly every major non‑Chinese supplier.

    Analytical Framework: How Operational Continuity Was Evaluated

    This review draws on public disclosures, technical reporting, and specialist analysis from 2025-2026 to assess each supplier on four operational axes: (1) ability to sustain or grow production through 2026-2030, (2) vulnerability to logistical and infrastructure disruptions, (3) exposure to regulatory and ESG constraints, and (4) geopolitical insulation from coercive trade dynamics. Instead of focusing solely on nominal tonnes of rare earth oxide (REO), the emphasis is on NdPr and HRE flows, since those underpin permanent magnets for EV traction motors, offshore wind turbines, precision‑guided munitions, and advanced aerospace systems.

    Within this framework, Lynas’ integrated Mt Weld–Kalgoorlie–Malaysia–Texas system and MP Materials’ Mountain Pass–US magnet strategy emerge as the primary pillars of non‑Chinese supply. Other projects are assessed relative to these anchors, with particular attention to how they alleviate – or replicate – existing bottlenecks.

    Lynas Rare Earths: Integrated Chain with Multi‑Jurisdictional Fragility

    Lynas controls one of the highest‑grade rare earth deposits at Mt Weld in Western Australia and operates a complex downstream chain that, by 2026, spans mining and concentration in Australia, cracking and separation in Malaysia, and a DoD‑funded heavy rare earth facility in Texas.

    Production Profile and Strategic Role

    For 2026, Lynas projects total REO production of about 16,100 tonnes, a 53% year‑on‑year increase, including approximately 8,800 tonnes of NdPr oxide with 35% growth. Company reporting indicates that NdPr accounts for the majority of revenue, and external analysis estimates Lynas covers around 5–7% of global NdPr demand. In the first half of its 2026 financial year alone, production had already reached 7,609 tonnes of REO, underpinning the likelihood of the full‑year target being technically achievable if operations remain stable.

    Lynas is also expanding into heavy rare earth separation. Following the first non‑Chinese commercial dysprosium (Dy) oxide production in May 2025, the company has highlighted an HRE program that begins with samarium (Sm) from April 2026 and is expected to scale to other elements including gadolinium (Gd), Dy, terbium (Tb), yttrium (Y) and lutetium (Lu) over the subsequent two years. Exact tonnages for each HRE stream have not been disclosed, but the presence of this capability outside China is structurally significant for high‑temperature magnet and defense applications.

    Operational Continuity: Strengths and Failure Points

    On the continuity side, Lynas benefits from several stabilizing factors:

    • A mature mine at Mt Weld with disclosed reserves around 2 million tonnes REO, providing resource security beyond the current decade.
    • An established separation facility in Malaysia with a track record of producing separated oxides at industrial scale.
    • A customer base reportedly aligned to long‑term strategic contracts rather than spot sales, dampening some short‑term market volatility in offtake patterns.
    • Flexibility to process third‑party feedstocks deemed ESG‑compliant, which can partially offset mine‑specific disruptions.

    that said, the same configuration carries embedded fragilities. The Australian ore is shipped to Malaysia for cracking and separation, creating exposure to maritime chokepoints and freight disruptions. During periods of Red Sea instability, for example, diversions increase lead times and operational complexity, especially when synchronized with maintenance outages or ramp‑up work on new circuits.

    Regulatory risk at the Malaysian plant is perhaps the most significant structural issue. The facility has been subject to ongoing scrutiny over the management of low‑level radioactive waste, particularly thorium‑bearing residues. Stricter environmental conditions and licensing reviews have already contributed to delays and limitations on HRE ramp‑up capacity. Any tightening in waste regulations, or political shifts around permitting, could constrain throughput or force reconfiguration of flows between Malaysia, Australia and the US.

    To mitigate part of this concentration risk, Lynas is building additional processing capability at Kalgoorlie in Western Australia and an HRE separation plant in Texas backed by US DoD funding. While these assets enhance diversification, they also introduce a classic ramp‑up challenge: overlapping commissioning schedules, acute engineering labor needs, and the need to stabilize three major facilities (Kalgoorlie, Malaysia, Texas) around the same mid‑decade window.

    Risk Inflection Points for Lynas

    • Malaysian licensing and waste policy: Any non‑routine change in thorium disposal requirements, license renewals, or community consent processes is a direct lever on effective capacity and uptime.
    • Shipping lane disruptions: Sustained instability in key trade routes linking Western Australia and Malaysia would increase lead times and inventory requirements, stressing working capital and scheduling.
    • Texas HRE ramp‑up: The US facility is intended to diversify geopolitical risk, but early‑stage operations can be prone to mechanical and process instability. Delays here would leave HRE reliance skewed back toward Malaysia.
    • Third‑party feedstock strategy: While processing external material adds resilience, it also brings variability in feed composition, which can challenge plant optimization if not carefully sequenced.

    Overall, Lynas is structurally critical for both NdPr and HRE availability outside China, yet its integrated chain remains sensitive to regulatory outcomes in Malaysia and execution risk across multiple expansion fronts.

    MP Materials: From Concentrate Exporter to Integrated US Magnet Supplier

    MP Materials operates the Mountain Pass mine in California, historically one of the world’s major light rare earth sources. The company has been transitioning from a concentrate‑focused model with shipments to China toward a fully integrated US supply chain encompassing mining, separation, and magnet manufacturing.

    Global landscape of leading rare earth mining and processing regions in 2026.
    Global landscape of leading rare earth mining and processing regions in 2026.

    Production Evolution and Strategic Significance

    By 2024/25, Mountain Pass had achieved a record output of roughly 45,000 tonnes REO in concentrate form, representing around 15% of global demand according to sectoral analysis. In 2026, the strategic pivot is toward refined oxides and magnets:

    • Stage II: High‑purity separated oxides, including announced heavy rare earth capability of around 200 tonnes per year of Dy/Tb once ramp‑up is complete.
    • Stage III: NdFeB magnet manufacturing targeting an initial 1,000 tonnes per year and a longer‑term goal of up to 10,000 tonnes by around 2028, enabled in part through a magnet facility backed by the US DoD.

    The company has also publicly stated that exports of concentrate to China ceased from the third quarter of 2025, with material retained for domestic processing. This move is strategically aligned with US policy priorities and positions MP as a cornerstone for domestic defense and EV motor supply chains.

    Operational Continuity and Structural Constraints

    Mountain Pass benefits from operating entirely within the US, removing cross‑border permitting and customs uncertainties that characterize multi‑jurisdictional chains. US regulatory frameworks are stringent but relatively predictable, and DoD participation adds stability around project funding horizons.

    At the same time, several operational risk factors stand out:

    • Ore profile: The deposit is heavily skewed to light rare earths, particularly cerium and lanthanum, with lower proportions of HREs. The announced 200 tonnes per year Dy/Tb capacity is strategically important but inherently limited by geology, which constrains how far MP can go in solving broader global HRE tightness on its own.
    • Water and environmental constraints: Mountain Pass is in a water‑stressed desert environment. Process water management, tailings stewardship, and regulatory scrutiny under California and federal rules are ongoing operational considerations that can affect throughput and expansion plans.
    • Stage II and III ramp‑up: Transitioning from concentrate to separated oxides and magnets introduces new technical and organizational complexity. Commissioning integrated chemical and metallurgical circuits has historically been a frequent stumbling block in the rare earth sector.
    • Labor and technical skills: The combination of mining, chemical processing, and advanced magnet manufacturing requires a specialized workforce, at a time when engineering and skilled labor shortages have been widely reported across North American industrial projects.

    DoD awards totalling over US$400 million since 2020, plus an additional heavy rare earth plant loan of around US$150 million, reduce financial uncertainty around Stage II and III development. Yet this same defense linkage exposes the project to US federal budget dynamics and policy shifts. Any future change in strategic priorities could alter the level of official support, which in turn would influence expansion pace and product mix.

    Saudi JV and Global Positioning

    In partnership with Saudi Arabia’s Maaden, MP Materials is advancing a joint venture intended to create a rare earth hub in the Kingdom, with HRE production targeted from around 2028. Current reporting places the project in pre‑construction following a 2025 final investment decision, with mine build activities expected to begin in the same period.

    For operational continuity, this JV has a dual character. It offers diversification away from North America and East Asia, locating capacity in a country that is actively pursuing industrialization under its Vision 2030 strategy. At the same time, the asset is likely to be exposed to desalinated water supply, desert logistics, and broader regional geopolitical tensions, including those linked to conflicts in neighboring countries and the volatility of hydrocarbon‑driven fiscal cycles. These factors create potential for supply interruptions that are different in nature from those faced at Mountain Pass, but no less material.

    Arafura Resources’ Nolans Project: High‑Impact Future Supply with Near‑Term Schedule Risk

    Arafura’s Nolans project in Australia’s Northern Territory is designed as an integrated mine and on‑site refinery focused on NdPr oxide. Public plans point to commercial start around 2028, with a full ramp‑up to approximately 4,440 tonnes per year of NdPr oxide expected between 2030 and 2032.

    From a supply‑chain risk perspective, Nolans’ main contribution is temporal: it aims to fill the mid‑to‑late‑decade NdPr deficit as demand from EVs, wind, and industrial motors continues to outpace present non‑Chinese capacity. Local refining is explicitly designed to bypass China for value‑added steps, strengthening supply assurance for customers requiring ex‑China compliance for sensitive applications.

    A modern rare earth mining operation illustrating the scale and complexity of extraction.
    A modern rare earth mining operation illustrating the scale and complexity of extraction.

    However, the project also illustrates standard development‑phase fragility. External reporting points to delays relative to initial schedules, driven by the complexity of building a full hydrometallurgical and separation plant in a remote, arid region. Logistics for reagents, water, and product shipment are challenging, and cost inflation has been a recurrent theme across Australian resources projects in the mid‑2020s. There is also an overlay of indigenous land and permitting processes specific to the Northern Territory, which can extend timelines if not carefully managed.

    If delivered broadly in line with current expectations, Nolans would become a key NdPr pillar for the early 2030s, partially relieving pressure on Lynas and MP, particularly if demand growth tracks higher‑end scenarios. Until construction is demonstrably de‑risked, though, its contribution remains more of a forward‑looking buffer than a secured component of the 2026–2030 baseline.

    Supporting and Emerging Supply Nodes: Diversification with Limited Near‑Term Volume

    Beyond the two main incumbents and Nolans, a range of smaller or earlier‑stage projects contribute to diversification, though often with modest tonnages or later start dates.

    Lynas USA Texas Facility and Kalgoorlie Expansion

    Lynas’ Texas heavy rare earth facility, constructed with substantial DoD support, is scheduled to ramp during 2026. It will be supplied by feedstock from Mt Weld, via Kalgoorlie and/or Malaysia. Strategically, this plant is designed to provide US‑based HRE separation for defense and critical industrial uses, reducing reliance on Malaysian processing for certain elements.

    From an operational risk standpoint, the Texas facility is still in the construction and commissioning phase. That introduces typical greenfield uncertainties: contractor performance, supply availability for critical equipment, and potential changes in US environmental permitting expectations, particularly regarding handling of radioactive residues. Any delay here would preserve reliance on Malaysia for longer, although the existence of multiple Lynas processing sites does offer some flexibility in how feedstocks are routed.

    Northern Minerals’ Browns Range and Other HRE‑Focused Assets

    Northern Minerals’ Browns Range project in Western Australia is one of the few Western operations explicitly focused on HREs such as Dy and Tb. Pilot operations have produced an estimated 500 tonnes per year of Dy/Tb‑rich concentrate, highlighting its potential strategic value for high‑performance magnet applications. However, current volumes are small relative to global requirements, and the project has faced repeated financing challenges and the inherent complexity of moving from pilot to full‑scale production.

    Iluka Resources’ Eneabba refinery, which processes monazite and other mineral sands‑derived feedstocks, is another important HRE‑capable asset. First REO output is targeted for 2026, with initial capacities in the hundreds of tonnes per year according to sector estimates, though detailed breakdowns remain limited. The key operational issue here lies in waste and by‑product management, given the presence of uranium and thorium in some monazite streams, and the need to integrate feed from multiple external mines that are optimized primarily for zircon and titanium minerals rather than rare earths.

    North American and Brazilian Projects: Round Top, Bahia, and Magnet Makers

    USA Rare Earth’s Round Top project in Texas is often cited for its HRE‑rich resource and its potential to supply both REOs and other critical materials. Current plans refer to an output around 2,000 tonnes REO from 2028 onwards, but the project remains subject to permitting, financing, and engineering milestones. Its location within the US is positive from a geopolitical standpoint, yet also subjects the project to the same environmental and community‑consultation structures that have elongated timelines for other mining developments.

    Energy Fuels’ Bahia project in Brazil, focused on monazite‑bearing heavy mineral sands, is expected to contribute HRE‑containing feedstock from around 2026 at an initial scale reported to be in the low hundreds of tonnes REO equivalent per year. While this provides jurisdictional diversification, it introduces another set of environmental and legal dynamics. Brazilian litigation around mining, indigenous rights, and land use is an ongoing factor to watch, alongside the reliability of export logistics from Brazilian ports to processing facilities in the US.

    The rare earth supply chain from extraction to advanced materials.
    The rare earth supply chain from extraction to advanced materials.

    On the magnet side, Noveon Magnetics in Texas represents an early example of domestic NdFeB magnet capacity in the US, with around 1,000 tonnes per year targeted for 2026 and DoD involvement to encourage recycling and closed‑loop supply. Noveon relies on upstream oxide availability from entities like Lynas and MP or recycled scrap, so its operational continuity is to some extent downstream of the mining and separation reliability discussed earlier.

    Multi‑Metal Projects: Alkane Dubbo and Similar Assets

    Alkane Resources’ Dubbo project in New South Wales is a multi‑metal venture, with a flow sheet designed to produce REOs alongside zirconium and niobium products. Plans call for around 4,000 tonnes REO from 2028, but final investment decision timing has been repeatedly pushed back. Multi‑commodity character can provide resilience once operational, since revenue is diversified across several critical materials, yet it complicates project financing and adds technical depth to commissioning and process optimization.

    Systemic Supply Chain Risks Through 2030

    When the ecosystem is viewed as a whole, a few structural realities become clear. First, non‑Chinese rare earth supply in 2026 remains highly concentrated in two incumbents, a structure made more fragile by China’s tightening export rules. Combined, Lynas and MP Materials are estimated to provide around 100,000 tonnes REO equivalent of non‑Chinese capacity (including concentrate), covering roughly a quarter to a third of global demand. Despite this, sector assessments point to a continuing NdPr shortfall on the order of 10,000 tonnes, and an even tighter environment for key HREs such as Dy and Tb.

    Second, a significant portion of this volume relies on maritime transport between Australia, Malaysia, the US, and, prospectively, Saudi Arabia and Brazil. Disruptions in any of the major shipping arteries – whether through conflict, sanctions, piracy, or infrastructure accidents – would quickly manifest as delays in feedstock deliveries to separation plants and magnet facilities. The requirement to handle, store, and ship slightly radioactive material adds another layer of complexity to contingency planning.

    Third, environmental and social regulation is emerging as a central gatekeeper of operational continuity. Thorium‑bearing waste streams in Malaysia, water stewardship in California and Saudi Arabia, indigenous land rights in Australia and Brazil, and US federal and state permitting all represent non‑geological constraints determining how quickly capacity can be brought online and sustained. In several cases, project schedules have already been adjusted materially due to these factors.

    Fourth, policy‑driven funding – particularly from the US DoD – is now embedded in the business models of a number of key assets. This provides stability and demand assurance but introduces a policy‑cycle dependency: future administrations or budget environments may recalibrate priorities around domestic mining versus recycling, stockpiling, or allied‑nation sourcing.

    Signals to Watch for Supply Chain Stability

    Several observable developments over the coming few years will shape how robust the non‑Chinese rare earth supply chain becomes:

    • Lynas regulatory milestones in Malaysia: License renewals, waste disposal agreements, and any changes in treatment of thorium‑bearing residues will directly influence HRE availability and total NdPr output.
    • MP Stage II/III commissioning performance: Evidence of stable high‑purity oxide production and consistent magnet output at Mountain Pass and associated facilities will indicate that the integrated US pathway is functionally delivering on its design.
    • Nolans and Eneabba construction progress: Movement from site preparation to mechanical completion at these projects will materially alter the mid‑decade NdPr and HRE balance if executed close to planned timelines.
    • Geopolitical and maritime developments: Stability in the Red Sea, Straits of Malacca, and key Pacific routes will remain integral to the practical flow of ore and oxides between the main production hubs.
    • Evolution of recycling and substitution technologies: While still emerging, any large‑scale deployment of NdFeB recycling or partial substitution in lower‑spec applications would reduce pressure on primary supply and alter the risk landscape.

    After several years of monitoring this space, a consistent picture emerges: progress is real, with Lynas and MP Materials anchoring a gradually diversifying ecosystem, yet the system remains structurally exposed. Non‑Chinese rare earth supply in 2026–2030 is less a broad, redundant network and more a concentrated set of critical nodes, each carrying characteristic operational, regulatory, and geopolitical risks that require ongoing scrutiny.

  • Recycling Caps: Why Mining Still Rules Strategic Metals to 2030

    Recycling Caps: Why Mining Still Rules Strategic Metals to 2030

    Recycling of strategic metals is scaling fast in capacity but remains structurally constrained by feedstock timing, thermodynamic limits, and economic cut-offs. By 2030, even under aggressive build-out of hydrometallurgical and black-mass capacity, recycling will ease supply risk for a subset of metals (PGMs, copper, cobalt, nickel) while remaining marginal for others (lithium, rare earths, dispersed precious metals). Primary mining remains the dominant source of supply; recycling functions as a volatility buffer and resilience lever, not a full substitute.

    Recycling of strategic metals is a volatility buffer, not a replacement for mining, at least through 2030. The critical materials narrative often treats recycling as a future escape hatch from mining dependence, but in practice, physical flows, process chemistry, and the age profile of installed assets constrain what recycling can actually deliver by 2030 and into the 2040s. The limiting factor is less laboratory efficiency than the geometry of product lifetimes, scrap logistics, and regulatory friction.

    For strategic metals such as lithium, cobalt, nickel, copper, rare earth elements (REEs), tungsten, and platinum group metals (PGMs), the core operational question is not whether recycling technology exists, but how much recoverable material will be available, at what quality, and at what energy and compliance cost. This is where optimistic circularity narratives collide with facility-level realities.

    Materials Dispatch’s view is straightforward: in the 2020s and early 2030s, recycling is primarily a risk-buffering and by-product optimization tool, not a structural replacement for primary supply. The limiting factor is less laboratory efficiency and more the geometry of product lifetimes, scrap logistics, and regulatory friction.

    How fast is the recycling market really growing?

    Recycling markets are expanding in value, but that growth does not translate linearly into displaced primary mining. Several segments illustrate this divergence.

    Industry data indicates that the precious metals e-waste recovery segment was valued around US$6 billion in 2024 and is projected to reach roughly US$7.4 billion by 2030, implying a modest single-digit compound growth rate. This reflects rising volumes of end-of-life electronics and higher recovery efforts for gold, silver, palladium, and other high-value metals embedded in devices, but it still represents a small share of total global precious metal supply.

    The broader metal recycling market, covering ferrous and non-ferrous streams, is much larger. Estimates place its value at over US$70 billion in 2023, with projections above US$120 billion by 2030 at high single-digit compound growth. This increase is driven by both additional tonnage and higher value per tonne, but it primarily reflects growth in bulk metals (steel and copper) rather than the most critical battery or rare metals.

    Black-mass recycling, focused on spent lithium-ion batteries, is a smaller but faster-growing niche. Market assessments suggest black-mass processing could exceed US$5 billion by 2030, from a much lower base today. This is the critical midstream link for recovering cobalt, nickel, manganese, and, increasingly, lithium from electric vehicle (EV) and stationary storage batteries.

    On the long tail of strategic metals, a “rare metal recycling” cluster—covering elements such as tantalum, indium, and some rare earths—is projected in the hundreds of millions of dollars by the early 2030s. That scale underlines the core issue: in value terms this segment grows, but relative to primary mining of these elements, it remains supplementary.

    In short, market growth signals rising activity and CAPEX, but not a fundamental inversion of the supply structure. Bulk scrap flows (steel, copper, aluminum) dominate recycling tonnage, while the most geopolitically sensitive metals remain tied to primary ore bodies.

    Why does feedstock geometry cap recycling by 2030?

    Material flows, not technical capability, set the near-term ceiling on recycled content. Technical capability is only half the equation; the other half is whether material physically arrives at a recycling gate in a recoverable form. Here, two categories matter: prompt scrap and post-consumer (end-of-life) scrap.

    • Prompt (pre-consumer) scrap arises during manufacturing — offcuts from rolling mills, machining chips, electrode off-spec product, catalyst refurbishing. It is typically clean, segregated, and high-grade, making recovery straightforward both technically and economically.
    • Post-consumer scrap comes from end-of-life vehicles, electronics, turbines, magnets, and infrastructure. It is heterogeneous, contaminated, and often physically entangled with plastics, ceramics, and other metals, significantly complicating extraction.

    For strategic materials, the bulk of current recycling volumes still originate from prompt scrap and industrial take-back (for example, spent PGMs catalysts) rather than mass post-consumer flows. That skew is central to understanding realistic ceilings on recycled content in the 2020s.

    For battery metals, the age profile is particularly constraining. EV batteries sold in the late 2010s and early 2020s have typical service lives on the order of a decade, with many units entering second-life stationary applications before true end-of-life. As a result, the volume of spent EV packs available for recycling in 2030 remains modest relative to the size of the installed base and the upstream mining throughput supporting it.

    Global modelling of clean energy transitions indicates that recycling capacity for batteries and critical minerals is being built ahead of this feedstock wave. Capacity growth for battery recycling has been reported at around 50% year-on-year in 2023, while end-of-life volumes lag. In effect, plants are emerging faster than scrap, creating an utilisation gap in the near term.

    This mismatch is most acute in jurisdictions where policy has driven aggressive build-out of recycling capacity (for example, parts of East Asia and Europe) but where local end-of-life material is not yet abundant. In these regions, cross-border sourcing of feedstock, merchant tolling, and competition for industrial scrap become central operational issues.

    How does recovery performance differ by metal class?

    Recovery limits are highly metal-specific. They depend not only on chemistry but also on how concentrated and “collectable” each metal is in its end-of-life form.

    Platinum Group Metals (PGMs)

    PGMs are the strongest positive case in strategic metal recycling. Industry statistics indicate that recycling contributes comfortably above 20% of annual platinum, palladium, and rhodium supply. Key drivers include the high intrinsic value of these metals and their relatively concentrated use in catalytic converters, chemical catalysts, and jewelry.

    PGM recycling flows are dominated by:

    • Automotive catalysts: Exhaust after-treatment bricks are relatively easy to collect, have high PGM loadings, and are supported by established logistics and assay infrastructure.
    • Industrial catalysts: Petrochemical and fertilizer plants operate under long-term contracts that include catalyst take-back and metal accounting.
    • Jewelry and industrial scrap: High purity and known composition allow efficient refining routes.

    Even here, that said, recycling does not eliminate the need for mining. The majority of PGMs still originate from primary sources, and incremental demand from fuel cells, hydrogen electrolysers, and specialty alloys maintains pressure on mine supply.

    Gold, Silver, and Other Precious Metals

    Gold and silver enjoy high recovery rates from jewelry and bullion, but their recovery from electronics and industrial applications is structurally constrained. Thin coatings, trace-level use in connectors, and dispersion across billions of consumer devices create a collection and concentration problem more than a chemistry problem.

    Market estimates for precious metals e-waste recovery reaching the mid-single-digit billions of dollars by 2030 highlight robust commercial activity, but these numbers remain modest compared to annual primary gold and silver production. The vast majority of metal embedded in low-value electronics still ends up in residual waste or in metallurgical streams where only a fraction is ultimately captured.

    The key operational friction is economic: recovering milligrams of gold from mixed, flame-retarded plastics and base metal boards is technically achievable through advanced hydrometallurgy and smelting, but the cost and environmental controls required push many potential recovery routes below economic cut-off, especially in jurisdictions with stringent emissions standards.

    Copper, Nickel, and Cobalt

    Copper has long been a recycling workhorse. Scrap copper from wiring, motors, and industrial processes feeds a mature ecosystem of mechanical sorting, smelting, and electrorefining. For many economies, recycled copper provides a large share of refined copper supply, particularly from construction and industrial scrap.

    Schematic overview of global recycling flows for strategic metals from e-waste and batteries.
    Schematic overview of global recycling flows for strategic metals from e-waste and batteries.

    Nickel and cobalt recycling historically derived from stainless steel, superalloy scrap, and refinery intermediates. The emergence of battery black mass adds a new high-grade source, particularly for cobalt. Hydrometallurgical circuits designed for sulphide concentrates have been adapted and, in some cases, purpose-built for black-mass leach and recovery.

    Long-term modelling under ambitious climate policy scenarios suggests that recycling could reduce the need for new mine development by roughly 40% for copper and cobalt, and around 25% for nickel and lithium, by 2050. These figures hinge on full deployment of collection systems, mature recycling infrastructure, and substantial technological progress. By 2030, the actual displacement is materially lower, limited by the pace at which EV fleets, renewable assets, and new grid infrastructure reach end-of-life.

    Lithium and Graphite

    Lithium and graphite sit at the difficult end of the recycling spectrum. Current lithium-ion battery recycling technologies typically achieve overall recovery rates in the 40-60% range, with high efficiency for cobalt and nickel but much more limited capture of lithium and graphite.

    Hydrometallurgical flowsheets often leach and recover transition metals as mixed sulphates or sulphides while treating lithium as a secondary product, for example via precipitation as lithium carbonate or lithium phosphate. Graphite is frequently burned for energy in pyrometallurgical routes or ends up in residues where recovery is technically possible but rarely economic at scale.

    Regulatory pressure is starting to change the calculus. The European Union’s Battery Regulation (Regulation (EU) 2023/1542) sets binding recovery efficiency targets, including 50% lithium recovery from waste batteries by 2027 and 80% by 2031, alongside high targets for cobalt, nickel, and copper. These targets force process developers to focus on lithium and graphite recovery, not just high-value transition metals, but commercial deployment at scale is still at an early stage.

    Rare Earth Elements (REEs) and Other Criticals

    Rare earth recycling remains marginal in absolute terms, despite intense policy interest. The difficulty is not the chemistry — solvent extraction and ion exchange can separate rare earths to high purities — but the combination of low concentrations, magnet miniaturisation, and the complexity of recovering magnets and phosphors from devices without prohibitive manual labour or contamination. For a closer look at why the recovery target stays out of reach, see rare earth recycling: the 15% target nobody is hitting.

    Emerging industrial flows include magnet swarf from machining of NdFeB magnets, end-of-life wind turbine generators, and EV traction motors. These streams offer higher grades than dispersed consumer applications and are the focus of pilot hydrometallurgical and molten-salt processes. Even so, current rare earth recycling contributes only a negligible fraction of global supply, with primary production in China, the US, and Australia dominating.

    For tungsten, molybdenum, and tantalum, recycling from tool steels, carbide inserts, and capacitors is more established. However, these flows are tightly linked to industrial scrap rather than broad consumer end-of-life streams, again limiting scale relative to primary mining.

    Which technologies move material from shredders to hydromet cells?

    Recycling technologies can be grouped into mechanical, pyrometallurgical, hydrometallurgical, and emerging direct-recycling processes. Each has characteristic recovery limits, energy demands, and environmental footprints.

    Technology Route Typical Role Recovery Profile Key Constraints
    Mechanical (shredding, sorting) Pre-treatment, liberation, scrap upgrading Wide range (single digits to >70%) depending on material purity Material mixing, fines losses, limited element-specific separation
    Pyrometallurgical Smelting, high-temperature refining Variable, often 20-60% for complex multi-metal feeds High energy use, off-gas treatment, limited lithium/volatile element capture
    Hydrometallurgical Leaching, solvent extraction, precipitation Frequently above 40% and rising; best-in-class battery flowsheets claim >95% of contained metals Reagent consumption, effluent management, slower kinetics, complex SX circuits
    Direct recycling / re-manufacturing Cathode relithiation, magnet reprocessing Potentially high value retention with lower energy input Strict feed quality requirements, product qualification, still early-stage

    Mechanical Pre-Treatment and Sorting

    Virtually every recycling chain starts with some form of mechanical pre-treatment: shredding, milling, screening, magnetic separation, eddy-current sorting, and density or optical sorting. These steps liberate metals from casings and substrates, concentrate high-value fractions, and reduce transport volumes.

    AI-enabled optical sorters and robotic disassembly systems are increasingly deployed in e-waste and battery dismantling lines. Their role is less about thermodynamic efficiency and more about reducing contamination, improving worker safety, and stabilising feed quality into downstream chemical processes.

    Pyrometallurgy: Scale with Selectivity Trade-Offs

    Pyrometallurgical processes — furnaces, converters, and rotary kilns operating at hundreds to over a thousand degrees Celsius — offer robust throughput and flexibility. They can treat heterogeneous scrap, destroy organics, and produce metallic alloys or mattes that are amenable to further refining.

    In PGM and precious metals recycling from autocatalysts, integrated smelter-refinery complexes combine high-temperature furnaces with precious metal refining circuits, achieving high recovery rates for PGMs while co-producing base metals. For black mass, some flowsheets rely on smelting to produce a cobalt-nickel alloy, with lithium reporting to slag or off-gas unless specifically captured.

    The key trade-offs are energy intensity and selectivity. High-temperature processes often struggle with light elements such as lithium and can volatilise halogens and organic contaminants, necessitating sophisticated off-gas cleaning. Environmental regulations on dioxins, fluorides, and heavy metal emissions tighten the operating envelope and raise compliance costs.

    Process flow from black mass to recovered battery metals using hydrometallurgical methods.
    Process flow from black mass to recovered battery metals using hydrometallurgical methods.

    Hydrometallurgy: Selectivity with Wastewater Complexity

    Hydrometallurgical routes use aqueous chemistry to leach metals into solution, followed by separation via solvent extraction (SX), ion exchange, precipitation, and electrowinning. For many strategic metals, hydrometallurgy is emerging as the midstream backbone of high-efficiency recycling.

    Battery black-mass circuits typically include acid leaching (sulphuric, hydrochloric, or mixed systems), oxidation-reduction control to separate manganese and iron, SX to split cobalt and nickel, and precipitation or crystallisation to produce battery-grade sulphates or hydroxides. Some commercial technologies report over 95% recovery of cobalt, nickel, and manganese; lithium recovery remains more variable, depending on flowsheet design.

    In rare earth recycling from magnet or phosphor scrap, hydromet circuits leverage the same SX chemistry used in primary REE separation, but often operate with more challenging impurity profiles (iron, aluminium, phosphates). The number of SX stages, organic losses, and aqueous effluent loads drive both CAPEX and OPEX.

    Hydrometallurgy trades furnace energy for reagent manufacture and effluent treatment. Waste streams — acidified brines, sodium sulphate, fluorides, and organic residues from extractants — create non-trivial tail management obligations under environmental permits.

    Direct Recycling and Functional Material Recovery

    Direct recycling aims to preserve the functional structure of materials rather than dissolving them to elemental form. Examples include relithiating spent cathode powders, recovering and re-sizing graphite anodes, or reprocessing NdFeB magnet alloy into new magnets without complete chemical breakdown.

    This approach can be far less energy-intensive and preserve more of the embedded manufacturing value. However, it demands tight control of feedstock quality and consistent chemistries. Mixed chemistries (NMC, LFP, NCA), degradation products, and cross-contamination from collection make standardisation difficult in real-world streams.

    Direct recycling is therefore best suited to vertically integrated systems with known product designs — for example, internal scrap from a cell manufacturer or closed-loop agreements with specific OEMs — rather than heterogeneous municipal or cross-OEM waste streams.

    What sets the physical and economic recovery limits?

    The distance between theoretical recyclability and actual recovered tonnage is governed by three interacting limits: thermodynamic, design-for-recycling, and economic.

    Thermodynamic and Process Limits

    From a strictly physical perspective, complete recovery is rarely achievable. Dilution, mixing, side reactions, and phase equilibria lead to inevitable losses in slags, filter cakes, and off-gases. Each additional increment of recovery typically demands disproportionate increases in energy, equipment complexity, or reagent consumption.

    For example, chasing the last percentage points of lithium from a complex leach liquor may require multiple precipitation and impurity control steps, producing additional residues and raising effluent loads. Similarly, recovering trace gold or palladium from low-grade slimes in a copper refinery is possible, but often uneconomic beyond a certain cut-off grade.

    Product Design and Dissipative Uses

    Many strategic metals are used in inherently dissipative or low-mass applications: thin-film coatings, solder pastes, phosphors, catalysts with nano-scale dispersion, and additives in alloys. Once dispersed at that scale and intermixed with organics or ceramics, recovery becomes either technically infeasible or grossly uneconomic.

    Even where designs theoretically support recycling — such as magnets embedded in motors or generators — mechanical access can be a bottleneck. Extracting small magnets from sealed motors at scale without heavy manual labour remains challenging, despite robotics advances.

    Economic Cut-Offs and Down-Cycling

    Recycling economics hinge on the value per tonne of recoverable metal, less the cost of collection, logistics, processing, compliance, and financing. When elements are present at ppm levels in mixed waste, even high market prices may not offset the full cost stack.

    This drives widespread down-cycling. For example, mixed low-grade copper and precious metal scrap may be routed to bulk smelters where copper is recovered efficiently but much of the precious metal content is dispersed into slags or dusts that are only partially retreated. Similarly, lithium in pyrometallurgical battery recycling often reports to slag that is not systematically reprocessed.

    The result is a structural gap between theoretical circularity and what multi-metal flowsheets deliver in practice. As a working heuristic for strategic planning, recycling behaves more as a high-value capture mechanism for a limited set of elements than as a universal recovery engine.

    How do regional capacity and policy create friction?

    Recycling capacity build-out is regionally skewed, and policy frameworks heavily influence which routes are feasible.

    China currently holds a dominant position in battery pretreatment and material recovery, with projections pointing to more than 70% market share in these segments toward 2030. State-backed enterprises are consolidating end-of-life EV batteries, with clear policy signals to retain critical metal value domestically. This concentration provides scale and learning-curve advantages but also increases geopolitical dependence for downstream users of recycled materials.

    Conceptual visualization of how recycling’s contribution to metal supply grows over time relative to primary mining.
    Conceptual visualization of how recycling’s contribution to metal supply grows over time relative to primary mining.

    In Europe and the United States, announced recycling capacity for batteries and some critical metals is substantial, but modelling suggests that by 2040 it would only cover around 30% of the expected domestic end-of-life feedstock. This implies ongoing reliance on exports of waste or intermediate products, or on continued landfilling and energy recovery for a portion of complex waste, unless additional capacity or alternative routes emerge.

    India and several Southeast Asian economies sit at the other end of the spectrum, with announced capacity projected to cover only a small share of anticipated feedstock by 2040. Informal recycling of e-waste remains widespread, with associated safety and environmental risks, while formal hydromet and pyromet infrastructure is less developed.

    Cross-border shipment of hazardous waste for recycling is increasingly constrained by the Basel Convention and its amendments, as well as unilateral controls on “waste” exports. Classification disputes — whether a material is a recyclable product or a hazardous waste — introduce legal uncertainty, delay shipments, and raise storage and working-capital requirements for recyclers.

    At the same time, instruments such as the EU Battery Regulation, extended producer responsibility (EPR) schemes for electronics, and national critical mineral strategies are tightening obligations around collection and minimum recycled content. These regulations simultaneously create predictable feedstock flows and higher compliance complexity for operators across the chain.

    What are the operational risks and failure modes?

    Recycling facilities handling strategic metals face a distinct set of operational, environmental, and safety risks that shape feasible technology choices.

    Safety and Process Stability

    Battery and e-waste handling introduces elevated fire and explosion risks. Lithium-ion cells can undergo thermal runaway during shredding or storage, particularly if damaged or partially charged. Facilities rely on inerting (nitrogen, CO2), temperature monitoring, and stringent pre-sorting to stabilise operations, adding to both CAPEX and OPEX.

    Chemical hazards are equally material. Fluoride-bearing electrolytes, if not properly neutralised and scrubbed, generate HF and other toxic compounds. Cyanide or aqua regia systems used in some precious metal recovery operations require tight containment and emergency response capabilities.

    Environmental Compliance and Waste Management

    Hydrometallurgical plants generate large volumes of process water and solid residues. Even when reagents are recycled internally, bleed streams containing dissolved metals, sulphates, fluorides, and organic extractants demand treatment to meet discharge standards. Solid residues, including filter cakes, neutralisation sludges, and slags, may qualify as hazardous waste, requiring secure disposal or further processing.

    In the PGM and precious metal segment, dust control and fugitive emissions of arsenic, lead, and other toxic species are central permitting issues. Inadequate baghouse design or maintenance can rapidly erode regulatory goodwill and constrain throughput.

    Feed Quality and Offtake Risk

    Many recycling flowsheets are highly sensitive to feed composition. Shifts in battery chemistries (for example, growing penetration of LFP at the expense of high-nickel NMC) change the value distribution in black mass and can undermine the business case of circuits optimised for cobalt and nickel recovery.

    On the offtake side, downstream refineries and cathode/magnet makers increasingly demand tight impurity specifications. Delivering battery-grade or magnet-grade products from heterogeneous scrap requires consistent process control, rigorous sampling, and robust metal accounting. Failure to meet specifications can downgrade material to lower-value outlets, eroding the economic rationale of high-capex recycling assets.

    Where does recycling change the supply balance by 2030-2040?

    Scenario analysis across metal classes reveals a clear pattern: recycling meaningfully alters supply-demand balances in some segments, while remaining structurally peripheral in others, at least through 2030.

    • PGMs and precious metals: Recycling already accounts for a significant share of PGM supply and a substantial share of gold from jewelry and bullion. Further incremental gains are likely, but the system is already close to its practical collection and processing ceiling.
    • Copper, nickel, and cobalt: As EV fleets, grids, and industrial assets mature, post-consumer scrap volumes become large enough for recycling to offset a material fraction of new mine requirements, especially under strong policy support. However, until the 2030s, primary mining remains the dominant supply pillar.
    • Lithium and graphite: Even under optimistic technology trajectories and strict regulatory targets, recycling contributes a relatively small fraction of supply by 2030, with more impactful displacement only emerging in the 2035–2045 window as first-wave EV packs retire in bulk.
    • Rare earths and niche criticals: Recycling offers targeted relief for specific applications (magnets, phosphors, catalysts) but remains far from reshaping global supply, given the dominance of primary production and the fragmentation of end-of-life flows.

    One structural insight stands out: in critical metals, recycling behaves more as a volatility dampener than a volume replacement. When integrated into metal balance modelling, high-efficiency recycling reduces the amplitude of supply shocks and price spikes but does not eliminate dependence on new projects in politically or geologically constrained regions.

    From an industrial resilience perspective, strategically located recycling capacity — near demand centres, powered by relatively low-carbon grids, and embedded in transparent regulatory regimes — functions as critical infrastructure. It provides a backstop in disruption scenarios, shortens logistics chains, and offers options for rapid response to material bottlenecks, even if it cannot fully close the loop.

    What does realistic circularity mean for strategic metals?

    The emerging reality is more nuanced than the slogan of an imminent circular economy for critical materials. Physics, design choices, and economic thresholds impose firm ceilings on recoverable fractions, especially by 2030. Recycling already plays an indispensable role in PGMs, copper, and certain industrial scraps, and it is rapidly gaining importance in battery midstreams, but it does not erase the requirement for new primary supply in strategic metals.

    The critical operational insight for the next decade is that capacity growth in recycling will continue to run ahead of post-consumer feedstock in many regions, while regulatory intensity, product redesign, and offtake specifications raise the bar for process performance. Facilities that integrate robust mechanical pre-treatment, flexible hydrometallurgical flowsheets, and disciplined environmental management are better positioned to convert nominal capacity into effective recovered tonnage.

    For Materials Dispatch, recycling flows are treated as a dynamic but bounded component of the broader supply architecture. Continuous monitoring of policy shifts, technology performance, and lifetime distributions of critical-metal-bearing assets remains essential, as these weak signals will determine how far recycling can stretch its role in the strategic metals system beyond 2030.

    Note on Materials Dispatch methodology Materials Dispatch integrates regulatory text monitoring (including instruments such as the EU Battery Regulation and MOFCOM directives), market and production data from agencies like the IEA and USGS, and end-use technical specifications from OEMs and standards bodies. This triangulation supports a grounded view of how recycling technologies, material flows, and recovery limits interact across the full critical materials value chain.