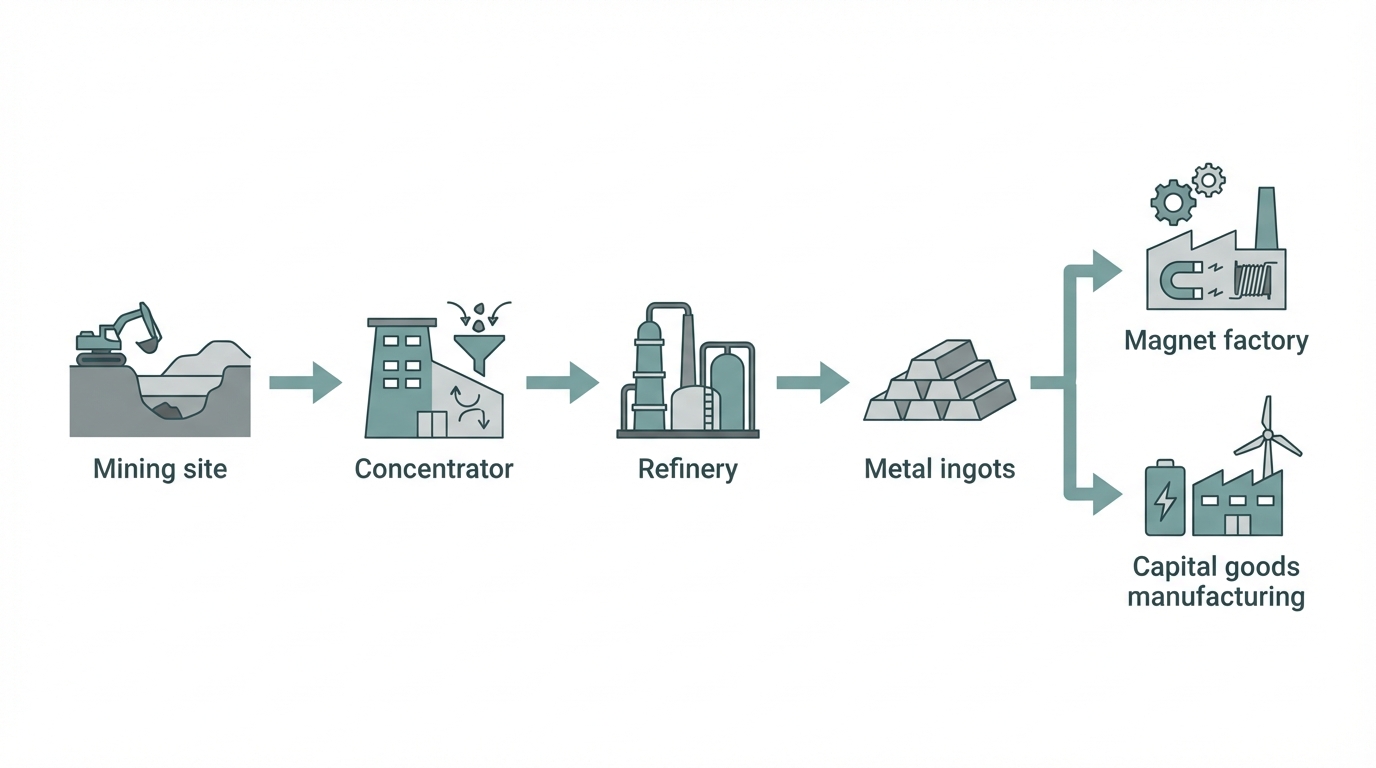
Materials Dispatch cares about the November 2026 cliff because it compresses several recurring failure modes observed across critical materials into a single hard deadline: complacent diversification rhetoric, slow-moving alternative projects, and an underestimation of how aggressively Beijing is prepared to weaponise “ordinary” industrial inputs. In recent sourcing cycles monitored by the team-covering defense electronics, power semiconductors, and specialty machining-gallium, germanium, antimony, and superhard materials have repeatedly shown up as quiet single points of failure in otherwise sophisticated procurement plans.
The suspension embedded in China’s MOFCOM Announcements 70 and 72 created a time-limited buffer. The military end-use ban was never lifted. The export control architecture remains intact. The question now is brutally simple: were the last 20 months used to build credible non-Chinese supply for gallium, germanium, antimony, and superhard materials, or were they mostly consumed by process, politics, and slide decks?
- The suspension of China’s export ban on gallium, germanium, antimony, and superhard materials expires on 27 November 2026; the underlying control regime and military end-use ban remain in force.
- MOFCOM Announcements 70 and 72 created a dual regime: a narrow, conditional reprieve for civilian flows and a de facto blackout for defense and many dual-use applications.
- Analyses from FDD, Clark Hill, and Global Trade Alert converge on one point: non-Chinese gallium and germanium capacity has expanded far more slowly than policy rhetoric implied.
- Most Western alternative projects for gallium and germanium remain in permitting, pilot, or construction phases, with timelines extending well beyond the November 2026 expiration.
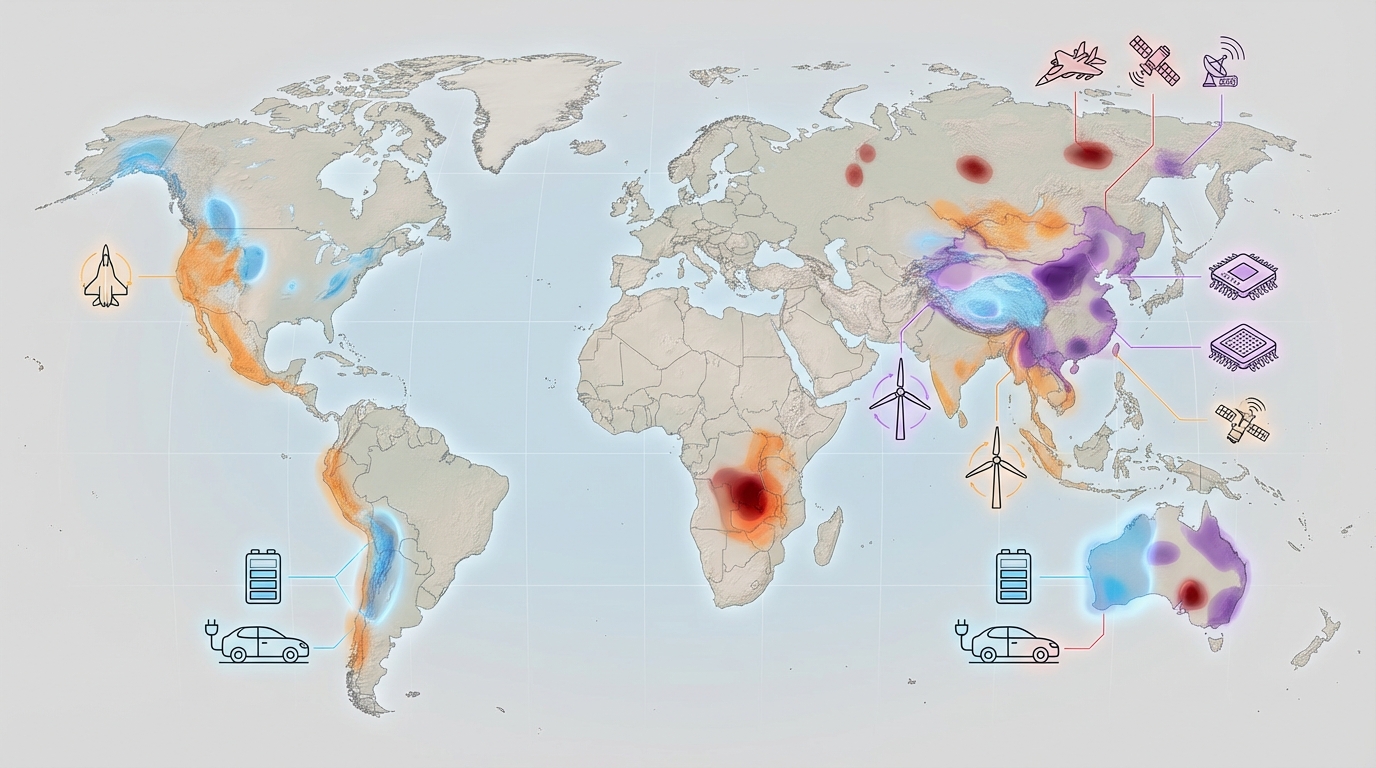
- Operational exposure now concentrates in defense electronics, infrared optics, precision machining, and advanced tooling, where substitution and recycling options are limited or late.
FACTS: The Control Architecture and the November 27, 2026 Cliff
MOFCOM Announcements 70 and 72: Scope and Structure
On 15 November 2025, China’s Ministry of Commerce (MOFCOM) issued Announcement No. 70, introducing export controls on gallium, germanium, antimony, and a basket of “superhard materials,” including synthetic diamond and cubic boron nitride. The measure cited national security grounds and brought these materials under a licensing regime for all destinations. Exporters were required to apply for licenses and provide detailed documentation on product specifications, end-users, and end-use sectors.
On 27 November 2025, MOFCOM followed with Announcement No. 72, which did not dismantle this structure but overlaid a time-limited suspension of the ban for civilian trade. According to Chinese government notices and subsequent regulatory analyses, including work by Clark Hill and Global Trade Alert, key elements included:
- A suspension period running until 27 November 2026, during which certain exports for non-military applications could proceed under license.
- Quota-style volume management, with annual ceilings for gallium, germanium, antimony, and superhard materials reportedly set below pre-control export levels.
- Stricter documentation requirements on end-use and end-user, including declarations that the materials would not be directed to military applications or re-exported for such purposes.
- Administrative timelines for license review that extended up to several months in complex cases, effectively constraining just-in-time supply.
Crucially, the military end-use ban embedded in Announcement 70 was not undone by Announcement 72. Multiple legal and policy readings, including detailed work from FDD, underline that the suspension applied to civilian and narrowly defined commercial flows only. Materials destined for military end-use or for facilities clearly linked to defense programs remained either subject to a much higher bar for licensing or effectively barred.
The Military End-Use Ban That Never Went Away
From the outset, the control language around “military end-use” and “military end-user” was left deliberately broad. The Chinese framework tracks concepts familiar from other export control regimes but interprets them expansively. FDD’s analysis of licensing patterns under the suspension period reports that a large majority of applications from entities with any defense or dual-use exposure faced rejections or were never formally approved.
In practice, this meant that throughout the suspension period:
- Programs involving gallium arsenide (GaAs) and gallium nitride (GaN) semiconductors for radar, electronic warfare, and secure communications equipment encountered sustained difficulty sourcing Chinese-origin gallium under license.
- Defense and high-end industrial users relying on germanium optics for infrared imaging and missile guidance were frequently classified as too close to military end-use to qualify under the suspended regime.
- Orders of antimony and superhard materials related to aerospace machining, turbine manufacture, and other defense-adjacent uses came under higher scrutiny or were denied.
As a result, while some commercial flows resumed under license after late 2025, defense and dual-use channels were structurally constrained even during the “reprieve” period. The suspension never represented a return to the pre-control status quo for these segments.
Timeline and Escalation Logic
Global Trade Alert and law firm chronologies trace the escalation as part of a broader sequencing of Chinese critical materials policy:
- Early and mid-2025: tightening of rare earths-related controls and signalling that Beijing was prepared to apply export licensing to strategic inputs used in high-tech and defense supply chains.
- 15 November 2025: MOFCOM Announcement 70 introduced formal controls on gallium, germanium, antimony, and superhard materials, with immediate licensing requirements.
- 27 November 2025: MOFCOM Announcement 72 announced a suspension of aspects of the ban for one year, effectively running until 27 November 2026, while preserving the underlying control architecture and the military end-use exclusion.
- Through 2026 (to date): no public indication from Beijing of an automatic extension, phase-out, or transition mechanism beyond the 27 November 2026 date.
Trade monitoring databases highlight that, even under the suspension, export volumes for these materials from China did not revert fully to pre-2025 patterns. Various datasets referenced by Clark Hill and other analysts show material declines in reported export volumes and a concentration of remaining flows in specific customer geographies and sectors.
Reported Market and Supply Chain Responses
Industrial reporting and trade data across late 2025 and early 2026 describe a recognisable pattern:
- Stockpiling by major semiconductor, optics, and specialty alloy producers as soon as it became clear the suspension was time-limited and contingent.
- Lengthening lead times and increased use of intermediaries and traders to navigate licensing uncertainty and documentation requirements.
- Significant reported price volatility for gallium, germanium, and antimony in early 2026, captured in trade press and commodities bulletins, commonly linked to perceived pre-cliff hoarding.
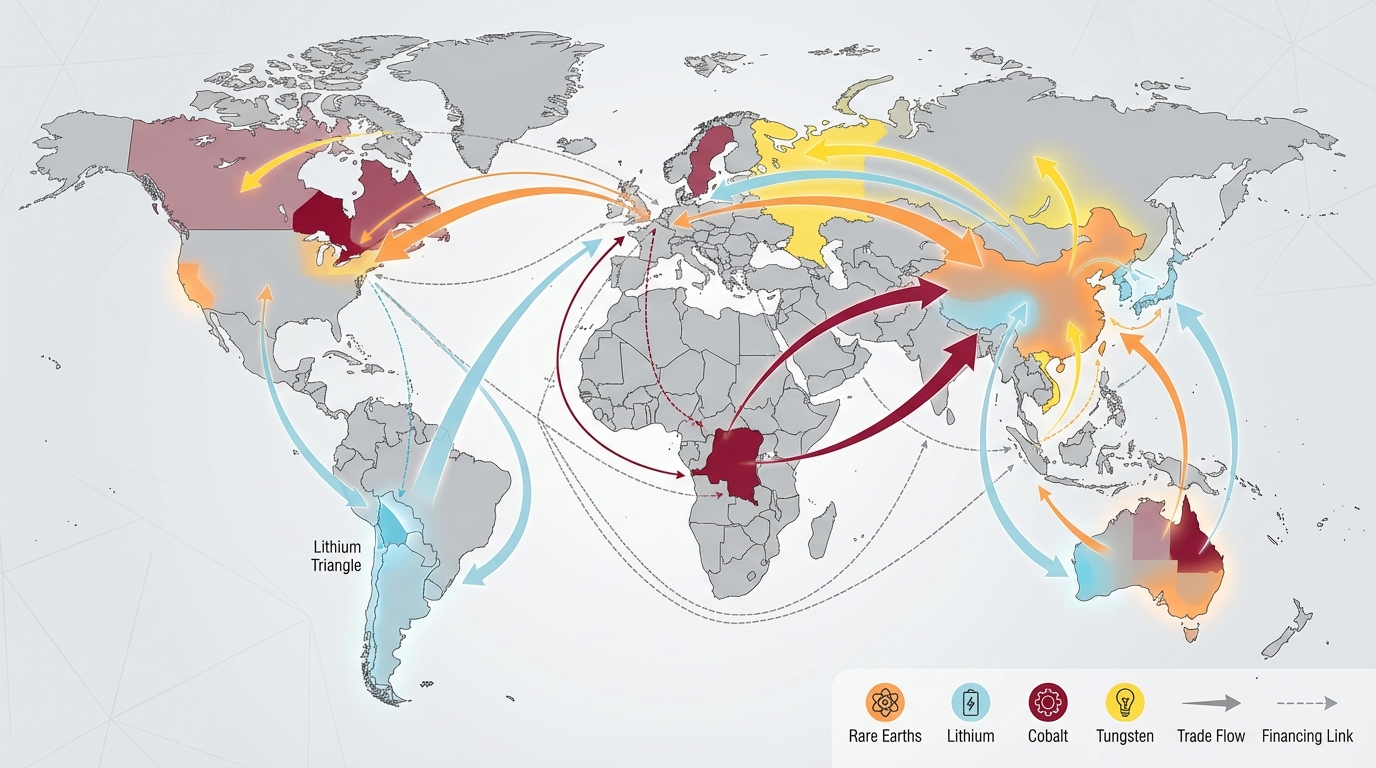
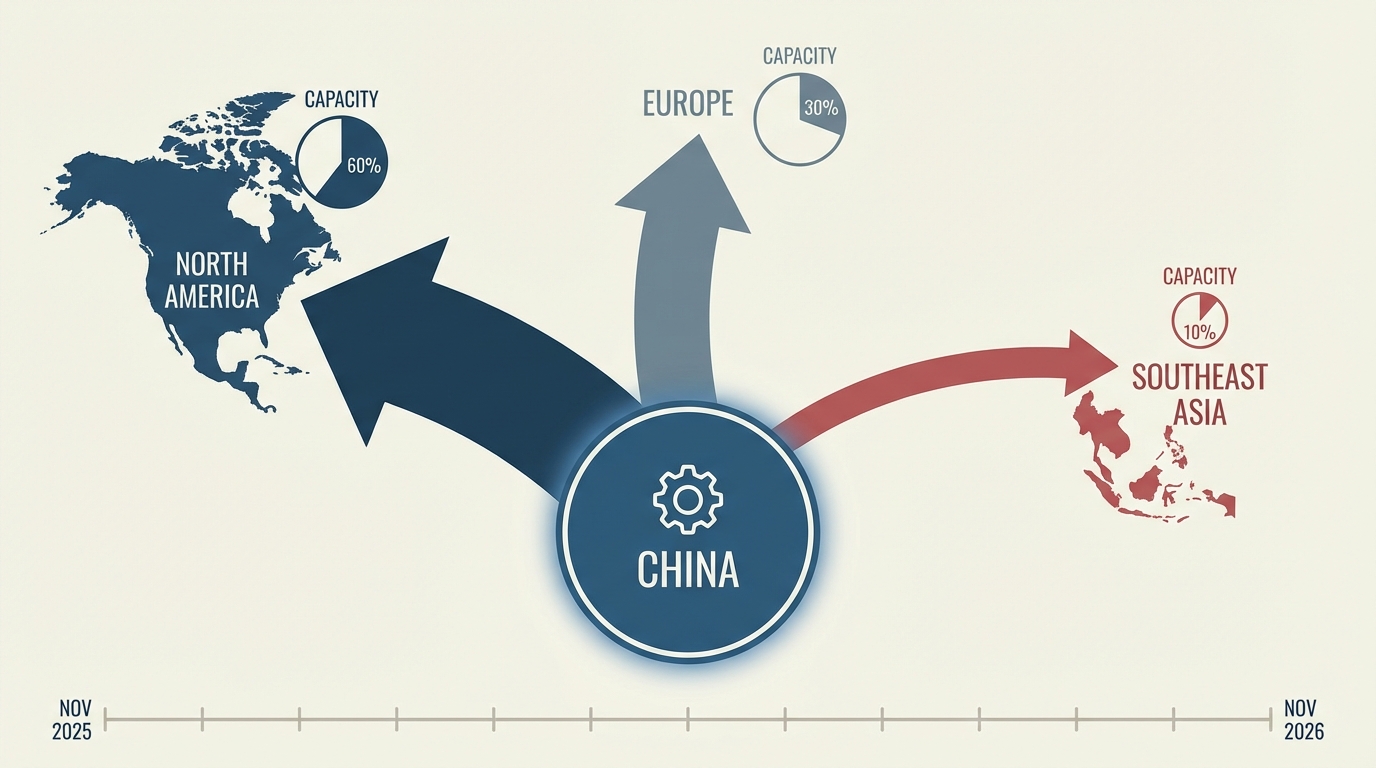
- Growth in apparent imports of gallium and related products into third countries in Southeast Asia and elsewhere, which FDD and customs data analyses flag as potential trans-shipment vectors.
From a factual standpoint, two elements are clear by early April 2026: the suspension has always been partial and conditional, and its formal expiration date of 27 November 2026 has not been paired with any binding commitment from Beijing to normalise trade thereafter.
Status of Western Alternative Gallium and Germanium Projects
Against this regulatory backdrop, multiple government programs and private projects in North America, Europe, and allied jurisdictions have sought to develop non-Chinese gallium and germanium capacity. Public company disclosures, government critical minerals reports, and think tank tracking (including FDD and Clark Hill) converge on several factual observations as of early 2026:
- Non-Chinese gallium production, while growing, remains a small share of global refined supply. FDD characterises it as still “under 10% of global needs,” with most incremental capacity coming from expansions at existing byproduct-processing facilities rather than new standalone projects.
- Key Western gallium initiatives-including greenfield refining in the United States and expansion of European processing plants—are generally still in construction, advanced planning, or early ramp-up. Public timelines frequently point to start-up dates after 2026.
- Germanium projects in Canada, the United States, and parts of Europe are predominantly embedded as byproduct streams in zinc, copper, or coal operations. Several of these initiatives remain at pilot or feasibility stage, with permitting and community challenges explicitly cited in company communications.
- Some non-Chinese refining operations in Asia have increased throughput but continue to rely heavily on Chinese-origin intermediate feedstock, limiting their ability to insulate downstream users from Chinese export controls.
Across the project set, the picture that emerges from company filings and government progress reports is one of incremental, but not transformative, capacity growth within the 20‑month suspension window.
INTERPRETATION: A Narrow Reprieve, Largely Squandered
The Suspension as Tactical Pause, Not Policy Reversal
Materials Dispatch reads MOFCOM 70/72 not as a misstep temporarily corrected by Beijing, but as a deliberately calibrated pressure mechanism. The design is asymmetric: structurally constrain defense and dual-use channels via a military end-use ban that never relaxes, while allowing enough civilian trade under license to dampen the political backlash and keep industrial dependence intact.
If that reading is accurate, then the 27 November 2026 date was never an invitation to assume that “normal” trade would resume. It was a fuse. From this standpoint, Western governments and industrial champions had a finite period—roughly 20 months—to convert high-level diversification ambitions into concrete, operationally meaningful non-Chinese supply.

The weight of evidence from FDD’s assessments, Clark Hill’s trade reviews, and recorded project timelines suggests that this period has been used only partially and unevenly. Rhetoric moved faster than engineering, permitting, and procurement reform.
Defense Exposure: De Facto Blackouts, Even During the Reprieve
For defense procurement and high-end dual-use manufacturing, the most uncomfortable reality is that the “reprieve” never truly applied. Licensing hurdles under MOFCOM’s military end-use provisions meant that Chinese-origin gallium for GaAs/GaN radar chips, germanium for infrared optics, and ultra-hard abrasives for precision machining remained severely constrained from late 2025 onward.
In sourcing and auditing work followed by Materials Dispatch across radar, missile, and secure communications programs, several recurring patterns stand out:
- Tier‑1 defense primes frequently reported that key foundries and component suppliers either could not certify the absence of Chinese gallium/germanium inputs or could only do so by drawing down finite stockpiles.
- Efforts to dual-qualify non-Chinese material for demanding defense specifications encountered long validation cycles and, in some cases, lower initial yields, affecting program schedules.
- Scrambles to secure recycled gallium and germanium from scrap streams revealed that recycling infrastructures, while technically viable, remained undersized and under-incentivised relative to the risk.
These dynamics indicate that, for core defense applications, the cliff was not deferred to November 2026—it began in late 2025. The upcoming date simply threatens to extend that constrained regime more deeply into civilian and dual-use sectors if Beijing chooses not to prolong the suspension or to narrow it further.
Alternative Supply: Ambitious Announcements, Slow Translation into Tonnage
The divergence between public ambition and physical tonnage is stark. Since late 2025, Western governments have announced critical minerals funds, strategic stockpile top‑ups, and “friendshoring” frameworks. Yet project-level evidence indicates that gallium and germanium have often sat behind more politically visible commodities such as lithium and rare earths.
From the vantage point of Materials Dispatch’s project tracking:
- Several headline gallium refinery projects in North America and Europe remain in mid-construction with commissioning dates beyond 2026, limiting their ability to mitigate a November 2026 disruption.
- Multiple germanium initiatives in North America have encountered environmental review delays, local opposition, or capital reallocation, pushing out expected start dates.
- Refiners in allied Asian jurisdictions have increased gallium and germanium output but remain heavily dependent on Chinese concentrates and intermediates, providing more processing flexibility than true supply independence.
- Where funding has been allocated through defense or energy security programs, internal competition between different critical materials has often diluted the focus on these specific elements.
If the FDD characterisation that non-Chinese gallium production remains below 10% of global requirements is accepted, then the structural dependency remains overwhelming. Under that assumption, the November 2026 deadline risks exposing how little has changed behind the policy announcements.
Operational Risk Profile Heading into November 2026
Assuming that Beijing allows the suspension to expire on 27 November 2026 without broadening civilian exemptions, the near-term risk distribution looks skewed in several directions:

- Defense and aerospace systems: Already strained supply chains for GaN/GaAs semiconductors, infrared optics, and precision machining could see further tightening, forcing schedule adjustments, re‑prioritisation of programs, or additional performance tradeoffs where substitution is technically possible.
- Semiconductor and photonics manufacturing: Foundries and component makers that have relied on licensed Chinese gallium and germanium during the suspension face renewed uncertainty over continuity of supply, particularly where alternative qualification has lagged.
- Industrial tooling and superhard materials: Tooling for turbine, aerospace, and high-performance automotive parts—where cubic boron nitride and synthetic diamond are embedded—may confront longer lead times and more fragmented sourcing, with implications for maintenance and expansion projects.
- Stockpiles and inventory strategies: Public reporting already points to stockpiling in 2025-2026; the extent to which those inventories are centrally audited, quality-controlled, and allocated toward defense versus civilian uses will shape how the cliff is experienced in practice.
All of this unfolds under the shadow of an export control regime that has already demonstrated administrative discretion. Even if some civilian licenses continue post‑November, the ability of Chinese authorities to tighten or loosen the tap by redefining “sensitive” applications remains a structural feature.
Why the Window Was So Hard to Use
From an operational perspective, it is tempting to describe the Western response as simply “too slow.” That underestimates the structural frictions at work, which recur across multiple supply chains tracked by Materials Dispatch:
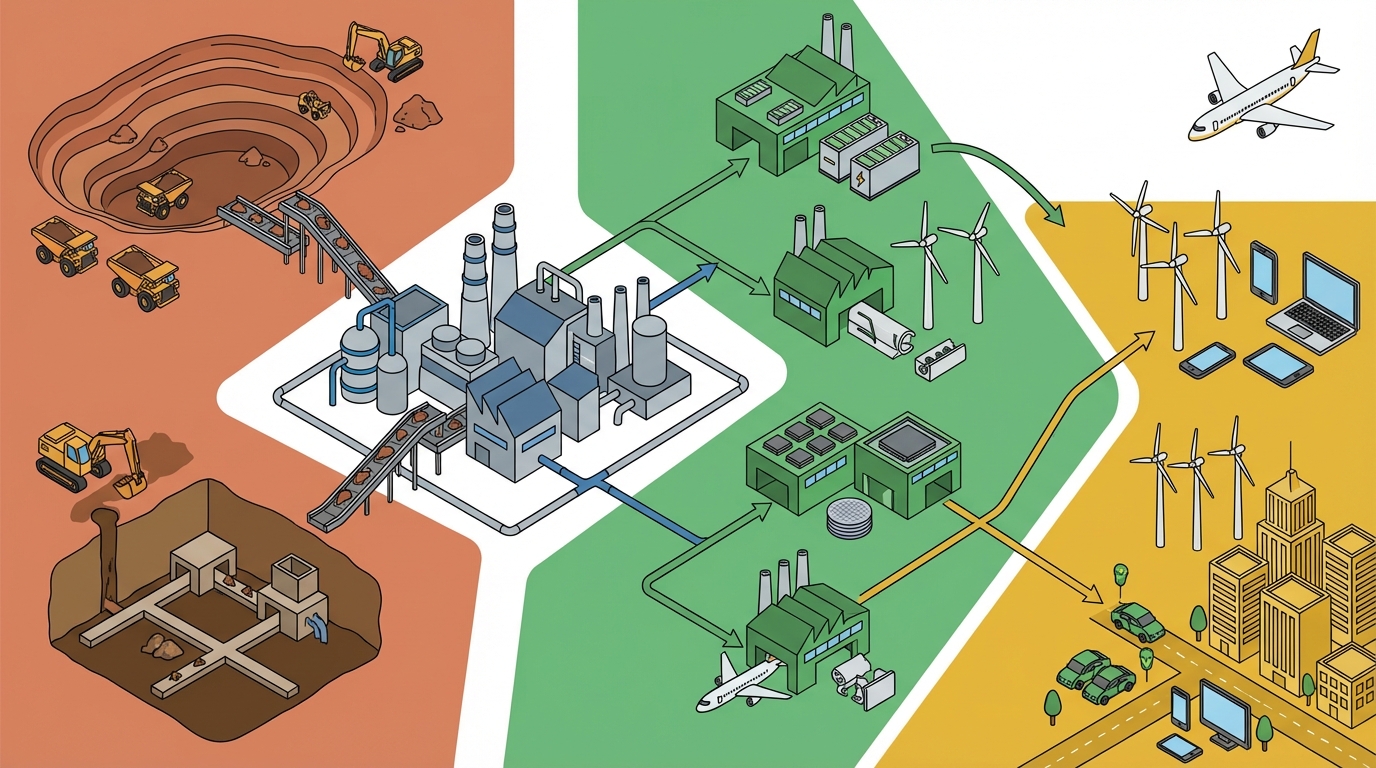
- Permitting and social licence: Gallium and germanium are often byproducts of base metal operations. Accelerating their recovery implies expansions or process changes at mines and smelters that already face legal challenges and local opposition, particularly in North America and Europe.
- Capital allocation priorities: Corporate and governmental capital has gravitated toward marquee battery and rare earth projects. Gallium and germanium, though strategically critical, lack the same political visibility and consumer-facing narrative.
- Technical lock-in: Defense and telecom specifications are written around established materials and supply chains. Re‑qualifying components based on alternative sources or substitute chemistries is neither quick nor risk‑free, especially when reliability and long-term performance are paramount.
- Fragmented responsibility: Within many organisations, gallium, germanium, antimony, and superhard materials fall between categories—neither pure raw materials nor standard electronic components—leading to diffuse accountability for securing them.
If these patterns persist, the November 2026 cliff becomes less an abrupt shock and more the visible culmination of choices and delays that have already locked in several years of heightened vulnerability.
WHAT TO WATCH: Signals into the November 27, 2026 Deadline
Several observable indicators over the coming months will clarify whether the cliff turns into a controlled descent or a sharper dislocation:
- MOFCOM communications: Any draft regulations, Q&A documents, or informal guidance from MOFCOM and associated agencies on the post‑November status of Announcements 70 and 72, particularly language around “continuation,” “adjustment,” or “normalisation.”
- License and export data: Quarterly statistics from Chinese authorities on approved versus rejected licenses for gallium, germanium, antimony, and superhard materials, and any notable changes in rejection rates for dual-use categories.
- Global Trade Alert and law firm timelines: Updates to trade measure databases and legal briefings that capture new restrictive or permissive elements from both China and Western jurisdictions.
- Project milestones at key alternative suppliers: Groundbreaking, commissioning, or first-production announcements at North American and European gallium and germanium facilities, along with any reported supply agreements into defense, semiconductor, or optics value chains.
- Defense and industrial procurement signals: Changes in sourcing guidelines, material specifications, or supplier qualification frameworks from defense ministries, major primes, and leading semiconductor and optics manufacturers.
- Recycling and substitution initiatives: Concrete scaling steps at recycling plants recovering gallium and germanium, and deployment of design changes that reduce or substitute these materials in non-critical applications.
- Stockpile policy evolution: Official communications on strategic reserves for these materials, including revisions to stockpile targets or drawdown protocols.
Conclusion
The November 27, 2026 expiration of China’s suspension is not a technicality; it is the point at which an already asymmetric regime can tighten further with minimal administrative effort from Beijing. The military end-use ban never went away, and the architectural logic of MOFCOM 70/72 has been to preserve leverage, not to de-escalate.
Across the projects and policies tracked by Materials Dispatch, Western systems have made progress on documentation, awareness, and some capacity additions, but far less progress on hard, diversified tonnage than the 20‑month window warranted. Unless alternative sources accelerate sharply, the cliff will expose just how limited the diversification achievements have been behind the announcements.
For supply chain strategists, compliance teams, and defense procurement officials, the next eight months are less about discovering the problem and more about quantifying the exposure realistically. Materials Dispatch will continue active monitoring of regulatory and industrial weak signals that will determine how this cliff plays out in practice.
Note on Materials Dispatch methodology Materials Dispatch analysis triangulates official texts and implementing rules from trade and export control authorities with ongoing monitoring of specialist legal, policy, and market commentary. This is cross‑checked against observable project milestones, company disclosures, and end-use technical specifications in sectors such as defense electronics, optics, and advanced machining. The objective is not to forecast prices, but to map structural dependencies and operational constraints as they evolve.