Category: Sentiment Analysis

  • Why stockpiling alone won’t save oems in the next materials shock

    Why stockpiling alone won’t save oems in the next materials shock

    Why this debate matters for OEMs now

    Materials Dispatch approaches critical materials not as an abstract geopolitical topic, but as a daily operational constraint for automotive, defense, electronics, and industrial OEMs. Over the last decade, the firm has watched multiple supply shocks – from the 2010 rare earths dispute and COVID-era logistics breakdowns to Russia-related disruptions in nickel, palladium, and neon – translate directly into halted production lines, emergency sourcing at any quality, and bruising internal audits on risk governance.

    In that context, stockpiling has become the instinctive response. Boards ask for buffer days of inventory; procurement teams build “strategic reserves”; public agencies launch shared storage schemes. The reflex is understandable: inventories are visible, easy to explain, and can be booked as a concrete risk-management line item. Yet recent policy moves – Chinese export controls on gallium, germanium, and graphite, tightening sanctions regimes, emerging EU cyber and ESG rules on mining, and talk of new tariffs on refined metals – have made one conclusion inescapable for this publication: stockpiling alone is structurally misaligned with the way the next shock is likely to unfold.

    The next materials crisis will be driven less by sheer tonnage scarcity and more by policy decisions on where refining happens, who is allowed to export, and which upstream assets can keep operating under regulatory and cyber pressure. Stockpiles can buy time; they cannot fix that geometry.

    Key points

    • Stockpiling provides a tactical buffer but does not address structural exposure to concentrated refining, export controls, and regulatory shutdown risks.
    • Critical materials refining remains heavily centered in China for rare earths, battery inputs, and several strategic metals, limiting the effectiveness of any downstream inventory buffer.
    • Public and private stockpile schemes increasingly intersect with tariffs, export controls, and cybersecurity rules, creating complex compliance and replenishment obligations.
    • Diversified non-Chinese mining and refining projects, along with magnet, battery, and wiring redesign, could materially reshape exposure, but timelines are measured in years, not quarters.
    • Interpreting upcoming policy milestones and project FIDs correctly is likely to matter more than any single warehouse volume in determining OEM resilience.

    FACTS: Structural exposure, stockpiling responses, and the emerging project map

    Concentrated refining and structural tightness

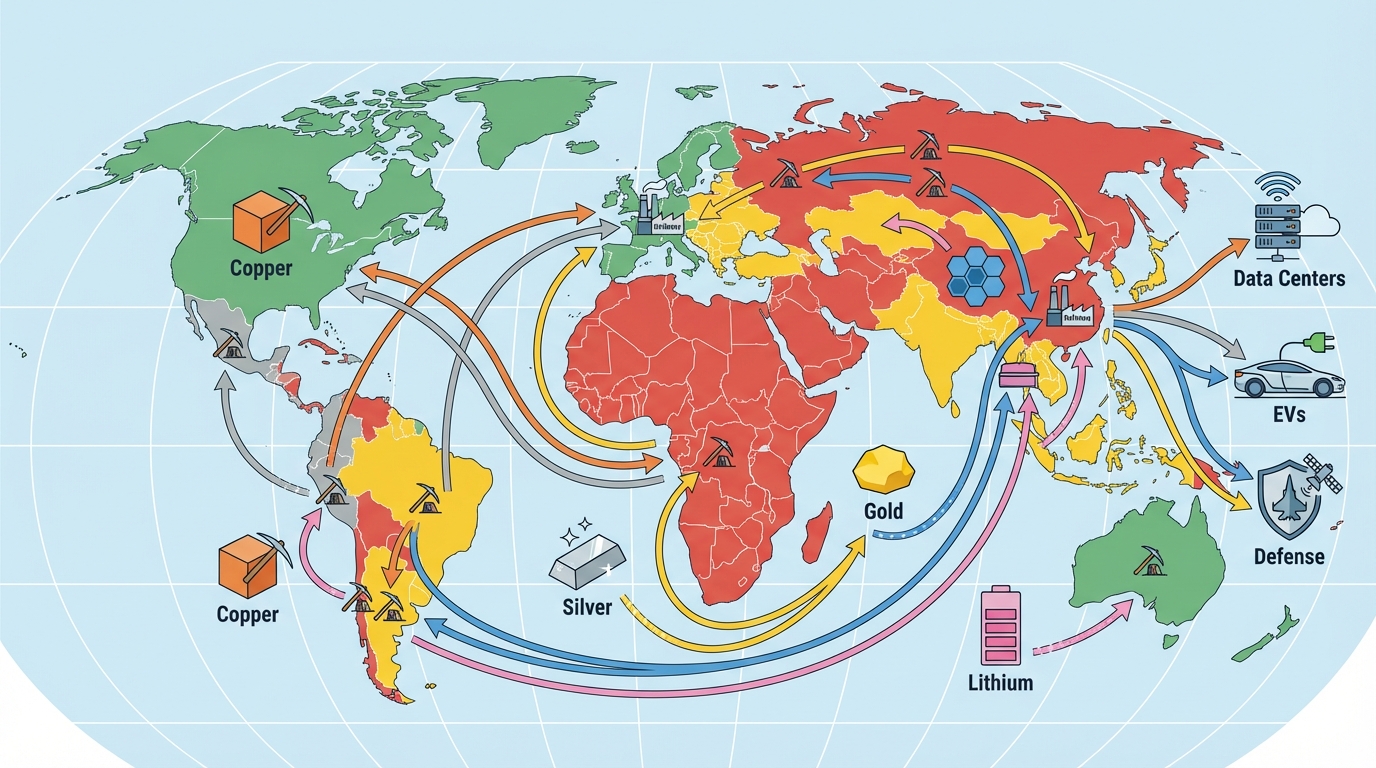
    Several converging facts define the baseline. First, refining and separation for many strategic and energy-transition materials are geographically concentrated. For key rare earth oxides used in permanent magnets, China has controlled the dominant share of global separation capacity for years. Similar patterns hold for segments of the graphite, lithium chemicals, and cobalt refining chains. For OEMs that rely on neodymium-iron-boron magnets, high-purity graphite, or cobalt-bearing battery chemistries, the “single point of refining” problem is already visible in supplier mapping exercises.

    Second, multiple technical agencies and industry groups have flagged potential medium-term deficits in refined copper and certain battery materials in North America and Europe, driven by electrification, data center buildout, and defense demand. In copper, projections for the mid-2020s point to a refined deficit in the United States measured in the hundreds of thousands of tonnes on an annual basis if new smelting and refining capacity does not accelerate. For rare earths, various analyses have highlighted a potential mismatch between projected demand for neodymium and dysprosium in EV motors and wind turbines and committed non-Chinese capacity.

    Third, policy tools have shifted decisively from rhetoric to implementation. China has implemented export controls on gallium, germanium, and certain graphite products, explicitly linking export permissions to national security concerns. The United States, European Union, Japan, and others have deployed sanctions, tariffs, and industrial subsidies directly targeted at reshaping critical materials supply chains. EU rules such as the Carbon Border Adjustment Mechanism (CBAM) and the NIS2 Directive extend climate and cyber obligations upstream into metals and mining, including operators of rare earth and battery-metal facilities.

    How stockpiling has been structured so far

    Stockpiling is not new. The United States has operated some form of strategic materials stockpile since the mid-20th century, and Japan’s post-2010 rare earth strategy prominently featured government-coordinated inventories. OEMs in automotive and defense have, over the last decade, built their own refined metal and component buffers, typically measured in weeks or a few months of normal consumption.

    Recent years have added new institutional forms. Public–private vehicles have emerged where commodity traders, OEMs, and export credit agencies co-finance shared pools of strategic metals. These schemes typically define a list of eligible materials (often aligned with national “critical minerals” lists), set trigger conditions for drawdowns (for example, formal export bans or sustained benchmark-price spikes), and allocate replenishment obligations among participating parties. From a governance standpoint, they sit somewhere between a traditional national stockpile and a syndicated revolving inventory facility.

    On the corporate side, risk committees and procurement teams have pushed suppliers to hold more inventory, sometimes funded through prepayments or take-or-pay frameworks. In many OEMs observed by Materials Dispatch, this has led to parallel inventory chains: conventional just-in-time flows for routine operations, and a “shadow” layer of safety stock in warehouses, bonded facilities, or supplier premises, often in multiple jurisdictions to hedge customs and sanctions exposure.

    Global OEM critical minerals supply chains face converging geopolitical and policy risks.
    Global OEM critical minerals supply chains face converging geopolitical and policy risks.

    Policy and regulatory context around the next shock

    Several regulatory threads intersect with critical materials stockpiling:

    • Export controls and sanctions. China’s moves on gallium, germanium, and graphite demonstrated that export permits can be turned into tactical levers. Western sanctions on Russian metals (including certain alumina, copper products, and PGMs) have likewise shown how quickly a product can shift from fungible to constrained in specific markets.
    • Tariffs and trade remedies. The United States and European Union have used anti-dumping duties and targeted tariffs on aluminum, steel, and some downstream products. Discussions have expanded to refined copper and semi-finished goods, with some policy scenarios for the latter half of the decade contemplating higher tariffs on refined imports that could incentivize pre-emptive stockpiling.
    • Cyber and operational resilience rules. The EU NIS2 Directive broadens cybersecurity obligations to a wide list of “essential and important entities”, including parts of the mining and metals value chain. This introduces mandatory risk assessments, incident reporting, and network segregation for operational technology (OT) in mines, refineries, and processing plants, with national transposition deadlines around 2024–2025.
    • Climate and ESG-linked trade instruments. CBAM and similar mechanisms intend to reprice carbon-intensive imports, including some steel and potentially other metals, over time. ESG-focused taxonomies and due-diligence laws are pushing OEMs to map supply chains down to mine sites, raising the bar for any stockpile sourced from opaque or high-emission operations.

    These instruments create an environment in which access to material is governed not only by mine output, but also by which jurisdictions are allowed to move which products, under what conditions, and with what data trails.

    Key non-Chinese projects reshaping the landscape

    Alongside stockpiling, a wave of projects outside China is attempting to rebalance supply for rare earths, lithium, and select strategic metals. As of late 2024, several clusters stand out:

    • North American rare earths and magnet materials. MP Materials’ Mountain Pass operation in California has resumed large-scale rare earth production, with an ongoing build-out of separation and magnet-making capacity. In Canada and the United States, Energy Fuels (White Mesa), Texas Mineral Resources (Round Top), and other players are pursuing rare earth recovery from monazite, polymetallic deposits, and recycling streams, often with Department of Defense or Department of Energy support.
    • Australian and Angolan rare earth chains. Lynas’ Mt Weld mine and Kalgoorlie processing plant, Iluka’s Eneabba rare earth refinery, Arafura’s Nolans project, Northern Minerals’ Browns Range, and Pensana’s Longonjo–Saltend combination form the core of a non-Chinese rare earth separation pathway spanning Australia, Angola, and the UK. Several of these projects focus on high-value magnet elements such as neodymium and dysprosium.
    • Battery raw materials in the Americas. In lithium, Albemarle’s Silver Peak brine operations and Lithium Americas’ Thacker Pass project in Nevada have become focal points for U.S. supply, supported by loan guarantees and offtake commitments from major automakers. In parallel, recycling-focused facilities (for example, magnet and motor recycling in Canada and Europe) seek to recover neodymium and other critical inputs from end-of-life products.
    • Recycling and circular flows. Neo Performance Materials and other specialized processors are building capacity to take scrap magnets, motors, and batteries from North America, Europe, and East Asia, converting them into separated rare earth oxides or alloys suitable for new magnet production. These facilities are typically smaller by tonnage than greenfield mines but can contribute disproportionately to supply security because they are located inside allied jurisdictions and rely on urban scrap rather than imported ore.

    Public discourse around these projects generally emphasizes offtake agreements with OEMs, government-backed financing, and the link to national security or electrification goals. For Materials Dispatch, they also represent the practical limits of what stockpiling can achieve: no amount of warehouse inventory in Europe or North America can substitute for absent or underdeveloped refining and separation capacity in these regions.

    INTERPRETATION: Why stockpiling alone will underperform in the next shock

    Stockpiles merely delay the impact of policy and refining shocks

    From Materials Dispatch’s standpoint, the core weakness of a stockpile-centric view is simple: it assumes that a future disruption will look like a temporary logistics issue or short-lived price spike. That assumption is increasingly out of step with reality. When a government introduces an export licensing regime for a critical input, or when a cyber incident disables a major refinery under tightened regulatory scrutiny, the disruption is not a two-week event. It is a structural regime change.

    In that context, stockpiles function as a time-limited grace period. They allow OEMs to keep assembling vehicles, aircraft, or electronics for a few months while policy, legal, and technical teams scramble. But if refining capacity remains concentrated and alternative supply paths are not already qualified, the buffer simply postpones the moment when production has to slow or stop. This is what Materials Dispatch means when describing stockpiling as a band-aid on a hemorrhaging chain: it covers the wound, it does not address the underlying cause.

    The 2023–2024 experience with gallium and germanium export controls already hinted at this dynamic. Downstream users with inventories were initially insulated; as export licenses tightened, the market split between those who had pre-qualified non-Chinese sources or could redesign components, and those who were left bidding within a shrinking, policy-constrained pool. The next shock in rare earths, graphite, or refined copper would likely follow a similar pattern.

    Capital-intensive non-Chinese mining and refining projects are essential to reduce dependence on stockpiles.
    Capital-intensive non-Chinese mining and refining projects are essential to reduce dependence on stockpiles.

    The operational drag of parallel inventory chains

    From a supply-chain operations perspective, large stockpiles introduce non-trivial friction. Maintaining separate inventories for steel, aluminum, copper, and rare earth–bearing components already results in duplicated freight, insurance, and warehousing flows. Layering strategic stockpiles on top of just-in-time operations effectively doubles quality-control regimes, audit trails, and ESG documentation requirements for the same tonne of material.

    In audits observed by Materials Dispatch, OEMs that built extensive critical-minerals buffers often discovered that, in practice, the reserves were treated as untouchable except in extreme emergencies. Plant managers hesitated to draw them down because replenishment terms were uncertain, or because the materials had been procured under different specifications or ESG criteria than day-to-day supplies. In several cases, parallel inventory chains drove up working capital and complexity far more than they improved real-world resilience.

    There is also a degradation dimension that stockpiling enthusiasts tend to downplay. For many metals, declining ore grades, evolving process technologies, and tighter product specifications mean that material produced today is not perfectly fungible with material that will be required five or ten years from now. Holding large volumes of undifferentiated raw oxides or concentrates can therefore lock OEMs into older specifications just as defense and EV platforms move to new magnet chemistries or higher-voltage battery designs.

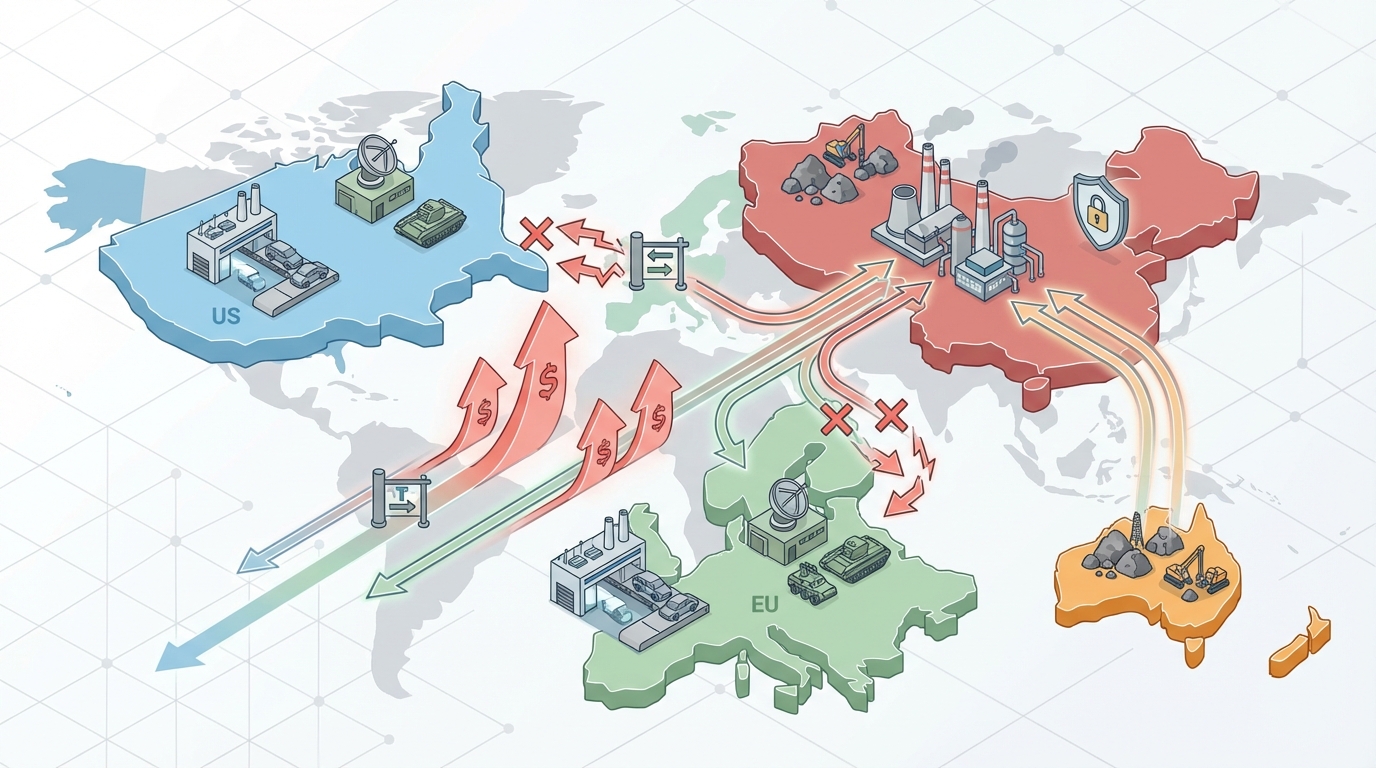
    Diversified projects and long-term agreements as structural mitigants

    If stockpiles address timing, diversified projects address topology. Non-Chinese rare earth projects in Australia, North America, and Africa; lithium brine and hard-rock developments in the Americas; magnet and battery recycling plants in Europe and Canada – collectively, these assets reshape where physical and political bottlenecks sit in the chain. When separation and alloying occur under regulatory regimes aligned with downstream OEMs, export controls and sanctions have less leverage, and logistics rerouting becomes more feasible.

    In practice, many of these projects hinge on long-term supply and processing agreements with OEMs or tier-one suppliers. These contracts often help secure project financing and underpin final investment decisions. They also lock in technical collaboration on specifications, quality-control regimes, and ESG reporting. From a resilience standpoint, the critical feature is not that offtake agreements exist, but that they connect physical assets in jurisdictions less prone to sudden export curbs with end-use platforms that can absorb that material at scale.

    that said, such diversification comes with its own constraints. Project development timelines are long, permitting is politically contested, and ESG expectations are rising. Several of the flagship rare earth and lithium projects outside China have faced legal challenges from local communities, environmental groups, or competing land users. That means OEMs and policymakers trying to use project pipelines as a hedge against future shocks need to accept that delays, redesigns, and partial scale-backs are intrinsic features, not exceptions.

    Design-led mitigation: material substitution and efficiency

    Materials Dispatch’s analysis of procurement crises over the past decade repeatedly converges on one conclusion: the only truly durable hedge is design. The rare earth episode of 2010–2012 triggered a wave of motor and magnet redesign work, leading to lower dysprosium content in traction motors and increased use of ferrite or hybrid magnet configurations where performance allowed. Copper tightness has already pushed several EV and industrial platforms toward aluminum for certain busbars and wiring harnesses, trading conductivity and handling complexity for reduced dependence on copper smelting bottlenecks.

    Stockpiling, diversification, and design substitution offer distinct tradeoffs in resilience, cost, and timing.
    Stockpiling, diversification, and design substitution offer distinct tradeoffs in resilience, cost, and timing.

    Similar dynamics are now emerging in batteries. Solid-state and high-manganese chemistries are being pursued partly to reduce reliance on cobalt and nickel. Even where these technologies remain in the pilot or pre-commercial phase, the direction of travel is significant for critical materials planning: if new designs can tolerate a wider range of input chemistries and specifications, they inherently weaken the grip of any single refining node or export regime.

    The trade-off is time. Serious design changes – whether a new magnet recipe for an aircraft actuator or an aluminum-intensive harness for an EV platform – typically require 6–18 months of R&D, prototyping, supplier qualification, and regulatory or customer recertification. From the vantage point of mid-2020s policy risk, that is still faster than building a new refinery or mine from scratch, but far slower than ordering another tranche of stockpiled oxide. This time mismatch is precisely why stockpiles appear attractive politically and corporately, even as they leave the fundamental concentration risk untouched.

    Policy-timed risk: why 2025–2027 matters

    Many of the regulatory levers that affect critical materials are on staggered timelines clustered around the mid-2020s. EU member states are transposing NIS2 into national law, with enforcement likely to tighten around 2025–2026 for mining and processing assets. CBAM is moving from transitional reporting to actual financial adjustments. Trade authorities in the United States and Europe continue to investigate refined metal imports, with scenarios circulating in policy circles that include higher tariffs on refined copper and other semi-finished products later in the decade.

    In parallel, resource-rich states are experimenting with their own levers, from export licensing on graphite in China to changing royalty and processing rules in countries such as Indonesia, Chile, or African jurisdictions hosting rare earth and battery-metal projects. Each such change can, in principle, trigger stockpile drawdowns if it crosses predefined thresholds in public–private “vault” schemes or corporate risk frameworks.

    The uncomfortable implication is that stockpiles created under one tariff, sanction, and ESG regime may have to be replenished under a very different one. If a government or OEM releases inventory in response to an export ban, and the ban persists or is broadened, replenishment could occur at higher prices, under stricter ESG rules, and with fewer eligible suppliers. In that scenario, stockpiling has not removed risk; it has time-shifted and, in some cases, amplified it.

    WHAT TO WATCH

    • New or expanded export controls on refining-intensive inputs. Announcements from major producers on graphite, rare earths, gallium, germanium, or battery precursors are likely to determine how quickly existing stockpiles are drawn down and how tight replenishment windows become.
    • Tariff and trade-remedy investigations on refined metals. Probes into refined copper, aluminum, or semi-finished products in the United States, EU, or key allies could trigger anticipatory stockpiling surges and reshape the economics of holding inventory versus backing new refining capacity.
    • Final investment decisions and commissioning milestones for non-Chinese projects. The timing of FIDs and first production at rare earth projects such as Nolans, Eneabba, Browns Range, Round Top, and at lithium assets like Thacker Pass, will be critical signals for when diversification can move from slideware to physical tonnes.
    • Implementation of NIS2 and similar cyber rules in mining and refining. Early enforcement actions, incident reports, or mandated shutdowns at mines and processing plants will reveal how much operational risk is added by new cybersecurity regimes, and how much that erodes the value of distant stockpiles.
    • OEM design and platform announcements. Public commitments by automakers, aerospace primes, and defense contractors to shift magnet chemistries, wiring materials, or battery architectures away from constrained inputs will indicate how rapidly design-led mitigation is progressing relative to stockpiling.
    • Terms and governance of any shared “vault” or strategic reserve schemes. The specific trigger conditions, replenishment rules, and ESG/cyber requirements written into multi-party stockpile vehicles will determine whether these function as stabilizers or as amplifiers of future shocks.

    Note on Materials Dispatch methodology Materials Dispatch combines continuous text monitoring of government and regulatory announcements with project-level tracking of mines, refineries, and recycling plants, and close reading of OEM and tier-one technical specifications. The analysis above reflects that triangulation rather than reliance on any single dataset, and remains explicitly bounded by stated policy texts and publicly disclosed project status.

    Conclusion

    Stockpiles will remain part of the critical materials toolkit; boards, ministries, and procurement leaders are unlikely to abandon the psychological comfort of physical reserves. Yet the structure of current and emerging shocks – driven by refining concentration, export policy, cybersecurity obligations, and ESG-linked trade instruments – means that inventory buffers alone are poorly matched to the real risk profile.

    In the reading of Materials Dispatch, the decisive fault lines in the next materials shock will run through where refining occurs, which jurisdictions control export valves, and how flexibly end-use designs can accommodate alternative materials and sources. Stockpiling can buy months; diversified projects and design changes can reshape decades. The coming period will reward close, active monitoring of regulatory and industrial weak signals that determine which of these pathways dominates.

  • Why oem boards need a dedicated materials risk dashboard

    Why oem boards need a dedicated materials risk dashboard

    Why OEM Boards Need a Dedicated Materials Risk Dashboard: The Governance Imperative

    Materials Dispatch treats materials risk dashboards as governance infrastructure, not analytics decoration. Strategic metals supply shocks in the last decade have repeatedly shredded production plans, forced emergency redesigns, and raised hard questions in boardrooms about who actually had line of sight on critical inputs. The conclusion from multiple procurement cycles and post‑mortem reviews is blunt: without a dedicated materials risk dashboard, board oversight of strategic metals is largely aspirational.

    Executive Highlights

    • The change: Governance regimes (SEC disclosure, EU CSRD, upcoming critical minerals reporting) increasingly treat supply‑chain resilience for strategic metals as a board‑level responsibility, while market volatility in 2024-2025 has exposed gaps in existing tools.
    • Scope: Rare earths, battery metals (lithium, cobalt, nickel), and precious/PGM metals remain heavily concentrated in a few jurisdictions and assets, with China controlling an estimated ~90% of NdPr magnet capacity and analyses projecting material deficits for both NdPr and lithium by 2025.
    • Coverage gap: Most OEMs operate with fragmented spreadsheets and static risk dashboards that overlook material‑specific exposure, leaving boards blind to early indicators of export controls, mine outages, or sanctions affecting strategic metals.
    • Operational translation: A dedicated materials risk dashboard would typically combine heat maps for 15-20 critical materials, a structured risk register per material, and bow‑tie style causal maps from mine to end‑use component, anchored in ERP/BOM and external data.
    • Limits: Dashboards do not remove geopolitical or geological risk; their value depends on data quality, board engagement, and integration into decision frameworks. They are a governance instrument, not an automatic hedge.

    Context: Why Materials Dispatch Focuses on Dashboards Now

    Over the last ten years, Materials Dispatch has watched three patterns repeat across automotive, aerospace, defense, and electronics OEMs:

    • First, boards approve multi‑billion platform bets premised on secure access to a handful of strategic metals, often without a consolidated view of how exposed those metals are to single assets, single jurisdictions, or regulatory choke points.
    • Second, when disruption hits-whether from Chinese export policy, South African power failures, or instability in the Democratic Republic of Congo-the board’s materials briefing typically arrives late, via a patchwork of procurement, engineering, and sustainability slide decks.
    • Third, quantification of exposure is weak: risk is framed in narrative terms (“high dependence on China”) rather than in clear metrics (share of NdFeB magnet demand tied to Chinese separation capacity; percentage of cathode demand reliant on cobalt refined in high‑risk jurisdictions).

    Materials Dispatch has seen entire procurement budgets redirected in a single quarter after a strategic metals surprise, with board members candidly admitting they had not appreciated how concentrated key inputs were. That is the governance gap a dedicated materials risk dashboard is meant to narrow.

    FACTS: Governance Frameworks and Strategic Metals Market Structure

    This section isolates factual elements: regulatory mechanics, the concentration profile of key materials, and documented disruption patterns.

    Governance and disclosure expectations

    Several regulatory and quasi‑regulatory frameworks have raised the bar for board‑level oversight of supply‑chain risk:

    • U.S. securities disclosure: SEC disclosure rules require listed companies to report material risks and events that could affect financial condition or operations. For OEMs, substantial disruptions in supply of critical inputs can become disclosure events when they affect production, contracts, or revenue.
    • EU Corporate Sustainability Reporting Directive (CSRD): CSRD mandates extensive reporting on sustainability‑related risks and impacts, including those stemming from the value chain. For materials, this encompasses environmental and human‑rights risks in mining and refining, as well as resilience of supply.
    • EU Battery Regulation: The EU Battery Regulation introduces “battery passports” and due‑diligence obligations on raw materials used in batteries, requiring traceability and risk assessment along the chain, explicitly linking governance to lithium, cobalt, nickel, and related inputs.
    • Critical mineral reporting initiatives: U.S. agencies, including the Department of Energy and others, have advanced critical minerals lists and reporting frameworks. While corporate reporting obligations are still evolving, the direction of travel is toward more granular visibility on critical input sourcing.
    • Supply chain risk standards: Standards such as NIST SP 800‑161r1, although framed around cybersecurity and ICT supply chains, codify the expectation that boards and executives oversee systemic supply‑chain risks using structured processes and metrics.

    None of these frameworks explicitly prescribes a “materials risk dashboard.” They do, however, collectively define an expectation: critical supply‑chain risks are board business, not a background operational detail.

    Concentration in strategic metals

    For the metals most relevant to EVs, clean energy, aerospace, and defense, supply is structurally concentrated:

    • Rare earth elements (REEs), especially NdPr: Industry analyses prior to 2024 from firms such as Adamas Intelligence and Wood Mackenzie estimated that China controlled on the order of 90% of global production of neodymium‑praseodymium (NdPr) used in permanent magnets, after accounting for both mining and separation capacity. Non‑Chinese supply is anchored by MP Materials’ Mountain Pass operation in the U.S. and Lynas Rare Earths’ Mt Weld operation in Australia, but these combined capacities remain well below Chinese levels.
    • Projected NdPr deficit: The same analyses projected a global deficit of around 20,000 tonnes of NdPr‑equivalent by the mid‑2020s under then‑current demand trajectories, driven by EV traction motors, wind turbines, and high‑end industrial applications.
    • Lithium: Benchmarking work by specialist consultancies ahead of 2024 suggested that lithium carbonate equivalent (LCE) demand was likely to exceed supply by approximately 200,000 tonnes around 2025 in base‑case EV adoption scenarios, even accounting for announced projects. Production is highly concentrated in Chilean brines (e.g., SQM in Salar de Atacama) and Australian hard‑rock mines, with conversion capacity heavily weighted toward China.
    • Cobalt: More than half of mined cobalt originates in the Democratic Republic of Congo, with significant refining capacity situated in China. This creates a dual concentration: geographic and processing‑chain.
    • PGMs (platinum, palladium, rhodium): Supply is dominated by South African and Russian producers. Norilsk Nickel in Russia and South African operations such as Amplats and Implats account for a large share of global PGM output, feeding autocatalysts and electronics.

    These concentration patterns are not new, but board‑level tools to visualise and track them in relation to individual OEM exposure remain underdeveloped.

    Recent regulatory and geopolitical shocks

    Several episodes illustrate how policy or geopolitical moves in a single jurisdiction can ripple through strategic metals supply:

    • Chinese export controls: China’s 2023 export licensing requirements for gallium and germanium, followed by expanded controls on certain graphite products, demonstrated the state’s willingness to use materials policy as a strategic instrument. Industry debates have since focused on whether rare earth magnets or other critical materials might be next.
    • Antimony export curbs and price shock: In 2024, Chinese antimony export licensing and tighter controls were associated with a sharp spike in antimony prices. Market commentary described moves from roughly $12,000 per tonne to around $38,000 per tonne in a short window. This briefing does not address pricing strategies or contracting, but notes the episode as an indicator of volatility and concentration risk.
    • Instability in antimony and cobalt supply regions: Security and political developments in Myanmar (antimony) and the DRC (cobalt) have led to intermittent production interruptions and uncertainty about future output, as reported by mining and commodity outlets.
    • Energy and labour constraints in PGM hubs: South African mining operations have repeatedly faced power rationing and labour actions, affecting PGM production. Russian operations have grappled with sanctions risk and logistics constraints.

    These are not abstract “macro” developments; they map directly onto OEM bill of materials and platform roadmaps when the metals involved sit in magnets, cathodes, catalysts, or high‑reliability electronics.

    Board-level materials risk dashboard for strategic metals oversight.
    Board-level materials risk dashboard for strategic metals oversight.

    State of materials risk information inside OEMs

    Across automotive, aerospace, and electronics OEMs observed by Materials Dispatch, several common information patterns emerge:

    • Critical materials dependencies often sit deep in multi‑tier supply chains (e.g., rare earth magnets in outsourced drive units; PGM coatings in purchased chips), with limited traceability beyond the first tier.
    • Enterprise risk dashboards focus heavily on financial, cyber, and compliance risks; materials risk appears, if at all, as a qualitative entry (“raw material volatility”) without material‑specific metrics.
    • Procurement teams may track key commodity trends, but typically on spreadsheets or vendor systems that are not integrated into board reporting packs.
    • Incident reporting (strikes, environmental shutdowns, export restrictions) is monitored by individual teams or regional offices, rarely fused into a single view of “strategic metals risk” across the portfolio.

    That is the factual baseline against which the dashboard discussion takes place.

    INTERPRETATION: Why a Dedicated Materials Risk Dashboard Changes Board Governance

    This section sets out a reading of those facts: what a materials risk dashboard would do, why boards of OEMs increasingly gravitate toward such tools, and where the limits lie. The reasoning is conditional and does not constitute prescriptive guidance.

    From diffuse data to fiduciary accountability

    If board members carry explicit responsibility for overseeing supply‑chain risks that can halt production or derail strategic programs, relying on scattered spreadsheets and ad‑hoc briefings looks increasingly hard to defend. In that light, a dedicated materials risk dashboard functions less as an analytical “nice to have” and more as the basic instrumentation for discharging fiduciary duty on a high‑risk domain.

    Several directors and risk officers interviewed by Materials Dispatch over recent years have converged on similar language: without a structured, continuously updated view of exposure to strategic metals, board discussions around electrification, autonomous systems, or defense platforms risk operating on partial information. Some have gone as far as to call such dashboards “non‑negotiable for strategic criticality.” That is not a legal standard, but it is a revealing sentiment from those in the governance hot seat.

    What a board‑level materials risk dashboard would typically contain

    Based on existing enterprise risk dashboards and materials‑specific pilots reviewed by Materials Dispatch, a credible board‑facing materials dashboard would usually combine at least three elements:

    • Critical materials heat map: A matrix of 15-20 materials (rare earths, lithium, nickel, cobalt, graphite, PGMs, titanium, tungsten, high‑purity alumina, etc.) scored on dimensions such as supply concentration, geopolitical risk, substitution difficulty, and share of corporate revenue dependent on each material. For example, NdPr magnets for EV drivetrains and defense systems would likely sit in the highest‑criticality quadrant, given China’s ~90% share of NdPr capacity and limited near‑term substitution options.
    • Risk register by material: For each high‑criticality material, a structured record of key assets (mines, refiners, processors), jurisdictions, and suppliers, with associated risk indicators. Indicators might include export control exposure, sanctions risk, environmental enforcement history, labour disruption frequency, and ESG controversies, without drifting into commercial pricing or contracting specifics.
    • Bow‑tie style causal maps: Visuals that trace how threats (e.g., new Chinese export restrictions on rare earth magnets; power shortages in South African PGM operations; instability in DRC cobalt regions) could propagate through specific supply paths into OEM plants, Program A/B/C, and ultimately into delayed vehicle or aircraft deliveries.

    In practice, these elements rely on integration between internal systems (ERP, purchasing, engineering BOMs, compliance reporting) and external datasets (USGS, customs data, specialist market and ESG intelligence). Boards that receive this as a standing item can interrogate exposure, challenge assumptions, and connect strategic decisions-such as platform launches or plant siting—to materials reality.

    Conceptual design of a dedicated materials risk dashboard.
    Conceptual design of a dedicated materials risk dashboard.

    Case lens 1: Rare earth magnets and EV/defense exposure

    Rare earth permanent magnets sit at the heart of EV traction motors, wind turbine generators, and many defense systems. With Chinese capacity dominating NdPr production and separation, and non‑Chinese supply limited to a small number of operations (notably MP Materials’ Mountain Pass and Lynas’ Mt Weld), the system exhibits clear single‑point‑of‑failure characteristics.

    In Materials Dispatch’s reading, a proper materials dashboard would have flagged three signals early in the last cycle:

    • Escalating discussion in Beijing and international media about tightening controls on strategic technologies and related materials, following the gallium, germanium, and graphite moves.
    • Slow ramp‑up and permitting challenges at non‑Chinese REE projects, indicating that diversification was advancing but still fragile.
    • Growing demand from EV, wind, and defense segments converging on the same NdFeB magnet supply base, pushing the projected NdPr deficit into view.

    Boards seeing these signals in an integrated dashboard—overlaid with their own magnet suppliers, platform plans, and regional mix—would be positioned to ask harder questions about design choices (magnet vs. induction motors), regional sourcing balance, and contingency planning. The absence of such visibility has been visible in recent production slowdowns and re‑sourcing scrambles reported across the EV and defense landscape.

    Case lens 2: Battery metals as a cross‑sector choke point

    Lithium and cobalt have shifted from specialist chemicals to cross‑sector chokepoints. Automotive OEMs, stationary storage providers, consumer electronics companies, and defense actors increasingly compete for the same battery‑grade raw materials and processing capacity.

    Analysts’ projections of a ~200,000 tonne LCE supply‑demand gap around 2025, combined with geographic concentration in Chilean brine fields, Australian spodumene mines, and Chinese converters, translate into a straightforward governance question: how exposed is each OEM’s product roadmap to a shortage or disruption at a handful of assets or ports?

    Similarly, cobalt dependence on the DRC, with refining weighted toward China, introduces both ESG and geopolitical dimensions. The DRC has seen repeated reporting of artisanal mining encroachment, security incidents, and community‑company tensions. A board‑level materials dashboard that maps cobalt content from DRC mines through Chinese refiners into specific cathode and cell suppliers would make these linkages explicit, allowing directors to read ESG risk and physical supply risk in one frame.

    Case lens 3: PGMs and electronics – hidden dependencies

    Platinum group metals (PGMs) and gold are textbook “hidden” dependencies: small in unit volume, critical in function. Autocatalysts rely on platinum and palladium; many high‑reliability electronic components depend on PGM and gold plating for corrosion resistance and conductivity. South African operations and Russian producers like Nornickel dominate the supply base.

    Global strategic metals supply chain with integrated risk indicators.
    Global strategic metals supply chain with integrated risk indicators.

    Energy shortages and labour disputes in South Africa, combined with evolving sanctions and logistics constraints affecting Russian metals, have repeatedly constrained PGM flows. Yet many OEM boards first encounter PGM supply as a line item under “cost headwinds” rather than as a structured resilience question: how many programs, in which regions, rely on PGMs from high‑risk sources, and what technical or sourcing alternatives exist?

    A materials dashboard that connects PGM exposure to specific plants, programs, and suppliers could reframe those conversations from reactive margin management to forward‑looking resilience governance, particularly as emissions regulations and electrification trajectories reshape PGM demand patterns.

    Implementation realities, trade‑offs, and failure modes

    Experience with enterprise risk dashboards across sectors suggests several practical realities that also apply to materials dashboards:

    • Data integration is the hard part: Extracting materials exposure from ERP and BOM systems, especially where multiple generations of IT coexist, is technically demanding. Multi‑tier supplier data is often incomplete. Without disciplined data governance, dashboards risk being visually impressive but analytically hollow.
    • Board engagement determines value: Where boards treat the dashboard as a compliance artefact, it quickly degrades into a static slide in quarterly packs. Where directors actively interrogate scenarios—“What if China added rare earth magnets to its control list?”; “What if DRC exports fell sharply for a year?”—the tool becomes a genuine governance instrument.
    • Risk of false comfort: Over‑precise scoring, especially where underlying data is thin, can create an illusion of control. Materials Dispatch has seen dashboards where criticality metrics imply fine‑grained precision that simply does not exist in upstream data.
    • Trade‑offs visible, not resolved: Dashboards can illuminate the tension between concentration risk and commercial terms, or between ESG performance and supply security. They do not resolve those tensions. Boards remain responsible for explicit choices: accepting certain exposures, redesigning products, or re‑phasing programs.

    In short, a dedicated materials risk dashboard can strengthen governance if it is grounded in realistic data, embedded into board routines, and recognised as an input into judgement rather than a substitute for it.

    WHAT TO WATCH: Signals Around Materials Dashboards and Strategic Metals

    Several weak and strong signals will indicate how far OEM governance is moving toward structured materials risk oversight:

    • Regulatory moves on critical minerals reporting: Any tightening of national or regional reporting requirements for critical mineral sourcing, especially where explicitly linked to board accountability, would increase pressure for dashboard‑style tools.
    • Expansion of export controls and sanctions: Additional Chinese export controls on strategic materials (for example, rare earth magnets or battery precursors), new sanctions affecting Russian or other producers, or tighter environmental/export regimes in producer countries will test which boards have pre‑modelled these scenarios.
    • OEM disclosures referencing materials dashboards: References in 10‑K/20‑F filings, CSRD reports, or sustainability reports to “materials risk dashboards”, “critical materials heat maps”, or similar constructs would signal that boards are formalising this capability.
    • Insurance and ratings scrutiny: If credit rating agencies or insurers begin to factor explicit critical‑materials governance into ratings or underwriting, the board‑level salience of dashboards will increase sharply.
    • Procurement and engineering integration: Evidence that OEMs are embedding materials risk metrics into platform gate reviews, sourcing councils, and capex decisions would indicate that dashboards are not just reporting tools but operational inputs.

    Conclusion

    Strategic metals risk has moved from the margins of OEM governance into its centre. Concentrated supply, intensifying geopolitical use of materials policy, and tightening disclosure regimes collectively mean that board oversight of rare earths, battery metals, and PGMs now sits on the same plane as cyber, financial, and regulatory risk. In that setting, a dedicated materials risk dashboard is less a technology choice than a question of whether boards intend to see, in structured form, where the supply‑chain weak points actually are.

    Dashboards will not avert export controls, mine accidents, or social conflict at remote sites. They can, however, expose where corporate strategy leans most heavily on such fragile foundations, and where mitigation options genuinely exist. Materials Dispatch will continue active monitoring of regulatory and industrial weak signals shaping how OEMs formalise materials risk dashboards in the coming years.

    Note on Materials Dispatch methodology Materials Dispatch analyses strategic metals governance by cross‑referencing official texts and guidance from regulators and standard‑setters, specialised market reporting on supply disruptions and concentration, and the technical specifications of end‑use applications in automotive, aerospace, defense, and electronics. This triangulation is used to assess where regulatory language, market realities, and engineering constraints align or diverge in shaping materials risk dashboards for OEM boards.

  • How to build an internal ‘materials war room’ for your company

    How to build an internal ‘materials war room’ for your company

    A Materials War Room is a cross-functional command center focused on real-time monitoring and coordinated response to disruptions in strategic metals and rare earth supply chains. In practice, it has looked less like a dramatic crisis bunker and more like a disciplined combination of people, data, and routines dedicated to understanding exposures around REEs, lithium, cobalt, nickel, tungsten, PGMs, and related logistics and regulatory constraints.

    In several organizations, the trigger for creating such a war room has been a specific shock: tighter Chinese rare earth export controls, unforeseen outages at DRC cobalt operations, or Indonesian nickel policy shifts that cascaded into cathode plant slowdowns. Over time, these war rooms evolved into standing capabilities rather than ad‑hoc crisis responses.

    Key Operational Tensions and Signals to Track

    • Tradeoffs: Centralizing intelligence vs. preserving local sourcing autonomy; transparency across business units vs. sensitivity around supplier and geopolitical exposure.
    • Risks & failure modes: War room treated as a dashboard-only project, no decision rights; over-reliance on a single geography (e.g., China for REEs, DRC for cobalt, Russia for PGMs); ESG data gaps around artisanal or high-risk sources.
    • Indicators to watch: Export quotas and licensing changes (e.g., Chinese REEs, Indonesian nickel), sanctions and trade restrictions (e.g., Russian palladium, Iranian metals), and chokepoints in logistics (Panama Canal, Red Sea routes, Southern African rail corridors).
    • Organizational signals: Recurring last-minute expediting, board questions about critical minerals, and fragmented internal spreadsheets are common precursors to formal war room setups.
    • Technology tension: Rich alerting through AI and satellite feeds vs. alert fatigue and mistrust of opaque models.

    1. Framing the Scope and Objectives of the Materials War Room

    The starting point observed in effective war rooms has been a sober discussion of scope: which materials, which business units, and which tiers of the supply chain fall under its remit. Many teams have used recent USGS critical minerals lists or the EU Critical Raw Materials Act (CRMA) annexes as a neutral backbone, then overlaid internal dependency mapping: for example, neodymium and dysprosium for permanent magnets in defense systems, lithium carbonate equivalent (LCE) for battery lines, cobalt for aerospace alloys, palladium and platinum for autocatalysts and fuel cells.

    Where scopes have remained vague (“monitor all commodity risk”), war rooms tended to drift into generic market commentary. Where scopes were defined in terms of concrete failure scenarios (“interruptions at these ten named assets or routes would stop these three product lines”), the resulting analysis and escalation paths became more actionable.

    In several cases, executive sponsorship was unlocked not by abstract resilience language, but by anchoring the war room in existing obligations: Sarbanes‑Oxley style annual risk assessments, conflict minerals reporting, or defense procurement requirements around traceability and origin for REE magnets and tungsten components.

    2. Team Composition and Governance: RACI in Practice

    Operational war rooms for strategic metals have typically involved 8-12 core participants drawn from procurement, supply chain, engineering/R&D, legal and compliance, and IT/data. The configuration that recurs most often is a RACI-style structure:

    • Responsible: Supply chain and category analysts who track mines, refineries, and key recyclers (for example, following MP Materials’ Mountain Pass for NdPr oxides, Lynas’ separation facilities, or Glencore’s Mutanda cobalt operations).
    • Accountable: A senior operations or procurement executive empowered to trigger responses such as qualifying an alternative supplier, re‑sequencing production, or drawing on stockpiles.
    • Consulted: Regulatory and ESG specialists familiar with CRMA, U.S. defense sourcing rules, conflict minerals guidance, and sanctions regimes affecting, for instance, Russian nickel and palladium producers.
    • Informed: Finance, product leadership, and in some cases the board risk committee, via concise periodic updates.

    One discovery many teams reported was the risk of role overlap: when multiple functions implicitly believed they were the ultimate decision-makers, reaction time during a disruption lengthened rather than shortened. Explicit decision trees – for instance, clarifying who can approve a temporary sourcing shift from a Chinese rare earths separator to an Australian or US alternative – helped reduce this confusion.

    3. Designing the Physical and Digital War Room Environment

    Material war rooms have taken two complementary forms: a dedicated physical space and a persistent digital environment. The physical space often features large displays with a “single pane of glass” view: maps of key assets and routes, current operational status, open incidents, and a ranked risk list. Typical maps would call out locations such as Mountain Pass (USA) for REEs, Greenbushes (Australia) for lithium, Mutanda and Kamoa-Kakula (DRC) for cobalt and copper, and Norilsk operations in Russia for nickel and palladium.

    Digitally, teams have converged on a mix of business intelligence tools (e.g., Tableau, Power BI), enterprise risk platforms, and custom dashboards fed by:

    Cross-functional materials war room for strategic metals risk monitoring
    Cross-functional materials war room for strategic metals risk monitoring
    • Authoritative geological and production data (e.g., USGS reports, company technical disclosures).
    • Trade and logistics feeds, including vessel tracking for key concentrates and refined products.
    • Regulatory and sanctions updates tied to critical jurisdictions (China, DRC, Indonesia, Russia, South Africa).
    • News and specialist commentary on specific assets such as Lynas’ Kalgoorlie plant ramp-up or Albemarle’s Australian expansions.

    A recurring pitfall has been overloading the environment with datasets without a clear “question hierarchy.” War rooms that worked well tended to start from a small canon of recurring questions – for example, “Which five assets, if disrupted, would halt more than a defined fraction of magnet or battery output?” – and only integrated data that helped answer those questions reliably.

    4. Mapping Critical Assets, Routes, and Dependencies

    An effective foundation has been a curated list of critical assets, processes, and routes. In the REE and strategic metals context, such a list often included:

    • Upstream mines and concentrators (e.g., MP Materials for REO concentrates, Pilbara or Greenbushes for spodumene, Ivanhoe’s Kamoa‑Kakula for copper and associated cobalt).
    • Midstream refineries and separation plants (e.g., Lynas’ facilities in Australia and Malaysia, Chinese magnet producers in Jiangxi and Inner Mongolia, nickel HPAL plants in Indonesia).
    • Recycling hubs (e.g., European PGM and battery recyclers such as Umicore’s sites, North American catalyst recyclers).
    • Transport corridors: DRC to Durban via rail and truck, Indonesian nickel flows to Chinese and Korean smelters, Russian PGMs through Baltic and Turkish ports, and North American road and rail routes to defense contractors.

    In practice, these maps were most useful when linked to bill-of-materials data and product lines. For instance, some aerospace teams tagged specific engine or guidance systems that depended on tantalum or REE components traced to Central African and Chinese assets, which in turn shaped priority levels during scenario analysis.

    5. Structuring Risk Identification Across Categories

    To move beyond ad-hoc issue tracking, many war rooms adopted a categorization framework that echoed information-security standards (such as NIST SP 800‑53 or ISO-style risk catalogs) but applied to materials. Typical categories included:

    • Supply concentration: High dependence on single-country sources (e.g., China for REE separation, DRC for cobalt, Russia for certain PGMs).
    • Geopolitical and regulatory risk: Export quotas, sanctions, nationalization pressures, or resource nationalism (Indonesia’s evolution from ore bans to processing mandates, for example).
    • ESG and social license: Artisanal mining risks in the Copperbelt, community conflicts near Latin American lithium brines, or power and water constraints in South African PGM belts.
    • Technical and quality risk: Qualification bottlenecks when switching from Chinese-made NdFeB magnets to alternative suppliers, or from one lithium chemical form to another.
    • Logistics and infrastructure: Port congestion, canal droughts, rail strikes, or chronic power instability affecting smelters and refineries.

    During initial build-outs, teams often discovered that existing risk registers either treated these issues at an extremely high level (“country risk: high”) or buried them as scattered line items in procurement files. The war room process brought them into a single, continuously updated catalog tied to specific assets and routes.

    6. Risk Scoring and Prioritization: Likelihood, Impact, Velocity

    A common practice has been to translate qualitative discussions into consistent scoring using three axes:

    Operating model of a materials war room for critical mineral supply chains
    Operating model of a materials war room for critical mineral supply chains
    • Likelihood: Based on recent history, political trajectories, climate patterns, and corporate disclosures.
    • Impact: Measured not in prices, but in operational disruption: lost production days, delayed programs, or regulatory non‑compliance risks.
    • Velocity: How quickly disruption would be felt once triggered – for example, just‑in‑time palladium flows from Russian refiners vs. long‑cycle tungsten stockpiles.

    Some teams overlaid a fourth dimension: detectability. Satellite monitoring of mine tailings, vessel tracking, and near-real-time news analytics raised detectability on certain assets, which in turn made some high‑likelihood issues more manageable.

    One illustrative internal exercise modeled a scenario where a tightening of Chinese rare earth export quotas triggered a 30% move in neodymium prices. The exact price path was less important than what it revealed: the need for clear thresholds at which escalation would be triggered, such as activating alternative suppliers in Australia or North America, drawing on strategic stockpiles, or accelerating recycling programs for magnets and catalysts.

    7. Response Playbooks: Diversification, Substitution, Buffers

    Once high‑priority risks were identified, war rooms that delivered tangible value tended to maintain explicit “playbooks” rather than relying on improvised responses. These playbooks covered, for example:

    • Diversification: Examples included shifting part of REE separation volumes from Chinese tolling contracts to emerging Australian capacity, adding non‑DRC cobalt sources (e.g., from Canada or Australia) alongside Glencore and other Copperbelt producers, or qualifying additional PGM refiners outside of high‑risk jurisdictions.
    • Substitution and thrifting: Engineering-led initiatives to reduce cobalt intensity in cathode chemistries, increase platinum-to-palladium substitution where feasible, or redesign components to accept a wider range of REE sourcing specifications.
    • Stockpiles and inventory buffers: Strategic holdings of select PGMs or specialized REE alloys, sized to cover critical programs for a defined period. In some sectors, a six‑month palladium or dysprosium buffer for defense applications appeared as a reference point in planning discussions.
    • Contractual and insurance levers: Diversification and force‑majeure clauses, political risk insurance for high‑exposure assets, and logistics insurance for vulnerable routes like the Panama Canal or the Red Sea.

    One pattern that became evident was that playbooks needed to be tightly coupled to engineering and qualification timelines. For example, an automotive program that depended on a specific Chinese magnet vendor could not simply switch overnight to a new Lynas- or Japanese-made magnet without validating performance, durability, and regulatory certifications. War rooms that mapped those lead times explicitly were better positioned to choose between short‑term buffering and longer‑term redesign.

    8. Monitoring Technology, Data Feeds, and AI

    Data has been central to most materials war rooms, but deployment has varied dramatically. A common baseline included:

    • Regular pulls from geological and mining agencies (USGS, national surveys) and company production reports.
    • Specialist market intelligence on strategic metals and REEs.
    • Regulatory trackers for sanctions, export controls, and environmental approvals.
    • Logistics telemetry – AIS data for bulk carriers, port congestion indicators, and occasionally satellite imagery for mine or smelter activity.

    AI-based systems have increasingly been layered on top, generating alerts when narratives around specific assets change (for example, increased reporting on labor unrest at a South African PGM mine or new draft export rules for Chinese gallium and germanium). However, teams frequently encountered alert fatigue and skepticism about opaque models.

    To address this, some war rooms adopted tiered thresholds: low‑level alerts logged silently in the background, medium alerts surfaced in weekly scans, and high‑severity triggers – such as credible evidence of sanctions on a major PGM producer or closure of a key cobalt export route – pushed directly to the accountable executive with a clear time window for assessment.

    Real-time monitoring of rare earth and strategic metal supply chain risks
    Real-time monitoring of rare earth and strategic metal supply chain risks

    9. Cadence, Simulations, and Learning Loops

    Operational cadence has proved as important as tooling. A pattern that emerged from several organizations involved:

    • Short daily or near‑daily huddles during active disruptions, focused tightly on status, new information, and immediate decisions.
    • Weekly or bi‑weekly “scan” meetings, where the full risk landscape was reviewed, new risks logged, and scores adjusted.
    • Quarterly simulations or “war games” around scenarios such as a sudden Indonesian nickel policy change, tightening Chinese rare earth quotas, an extended South African power crisis affecting PGM supply, or rail disruption out of the DRC.

    Post‑incident reviews turned out to be particularly valuable. For example, one team discovered during a cobalt logistics disruption that critical knowledge about alternative trucking routes out of Katanga was held only by a single regional buyer. The war room process led to codifying that route intelligence and embedding it into the central playbook.

    10. KPIs, Auditability, and Scaling the War Room

    Over time, mature materials war rooms gravitated toward a small set of performance indicators used both to steer internal improvements and to satisfy board or regulator scrutiny. Common examples included:

    • Time to detect: Average time between an external trigger (e.g., public announcement of a quota or ban) and its appearance in the war room dashboard.
    • Time to decision: Duration from confirmed incident to a documented decision on response (diversification, substitution, stockpile drawdown, or other action).
    • Diversification scores: Share of critical materials volume coming from any single country or supplier, sometimes tracked against internal thresholds (for example, maximum exposure levels to one jurisdiction for REE separation or cobalt refining).
    • Compliance coverage: Proportion of critical suppliers with updated ESG, human rights, and sanctions screening records.

    Auditors and compliance teams frequently engaged with war rooms as a single location where evidence of structured risk management could be examined: meeting minutes, risk logs, escalation records, and scenario analyses. In at least one case, such documentation proved decisive in demonstrating that board oversight of critical mineral risks was not merely nominal.

    Scaling often involved either deepening the war room’s role within a particular material group (for example, a dedicated REE cell that followed MP Materials, Lynas, key Chinese separators, and emerging Vietnamese projects in detail) or extending its scope to adjacent materials like graphite, manganese, or high‑purity silicon where similar concentration risks were emerging.

    Closing Observations

    The Materials War Room concept has evolved from an emergency response mechanism into a standing analytical and coordination hub for strategic metals supply chains. Across regions and sectors, a few elements have proven especially consequential: a clearly bounded scope tied to concrete failure scenarios; explicit governance and decision rights; integrated but disciplined data environments; and response playbooks that recognize engineering and qualification realities.

    As export controls, sanctions, climate impacts, and social license pressures continue to reshape the geography of mining, refining, and recycling, organizations that have institutionalized such war rooms appear better positioned to explain their exposure, document their decisions, and adapt their sourcing architectures across REEs, battery metals, and precious metals alike.

  • How to score supplier resilience for strategic materials

    How to score supplier resilience for strategic materials

    In late-stage battery, defense and electronics programs, the most disruptive supplier failures around rare earth elements (REEs), lithium, cobalt, tungsten and platinum group metals have often come from balance-sheet fragility rather than from the most obvious geopolitical hotspots. That observation led several teams to codify a structured 0-100 resilience score, with financial health as the anchor and geopolitical, ESG and operational dimensions layered on top.

    The framework below summarises how to score supplier resilience for strategic materials in a way that can be replicated across vendors and refreshed as markets, regulations and capital structures change.

    Key Operational Points

    • Tradeoffs: A 50% weight on financial metrics often shifts the supplier universe toward larger, more stable groups and away from niche specialists with outstanding technical performance but thinner balance sheets.
    • Risks and failure modes: Data gaps for private or state-owned suppliers, static scores that ignore rapid leverage build-up, and underestimating jurisdictional risk around export controls and logistics bottlenecks.
    • Signals to watch: Deteriorating liquidity, rising debt-to-equity, shrinking interest coverage, regulatory actions (e.g. permits, ESG enforcement), and recurring delivery deviations against plan.
    • Regulatory overlay: The EU Critical Raw Materials Act and new battery and ESG rules in major jurisdictions increasingly link financial resilience to a supplier’s ability to carry the cost of compliance.

    1. Scope, Material Coverage and Data Assembly

    The first step in a resilience score is defining which parts of the strategic materials chain are in scope: upstream mining, intermediate processing (e.g. REE separation, cobalt refining), and downstream conversion (e.g. NdFeB magnets, cathode active material). Each tier has different disclosure patterns and risk drivers.

    In practice, teams start by mapping critical suppliers by material and process step, then assemble a data pack that typically includes:

    • Financial statements and ratios from public filings (EDGAR, SEDAR, ASX, HKEX) or, for private entities, lender packs and audited summaries where accessible.
    • Credit and risk ratings from services such as S&P Global Supplier Risk Management or similar 0-100 scales.
    • Jurisdiction and logistics risk data from platforms like Everstream Analytics, focusing on export controls, sanctions, infrastructure reliability and climate-related disruption.
    • Compliance and ESG disclosures linked to REE, cobalt and lithium traceability requirements and to tightening EU and US regulations.
    • Operational performance history: delivery reliability, quality incidents, production outages and maintenance shutdowns.

    For listed suppliers, assembling this dataset is often a 2-4 week exercise. For non-listed entities in opaque jurisdictions, access to dependable balance sheet and cash flow data can extend the initial scoring effort to several weeks more. Some teams handle this by using a provisional score flagged as “data constrained” until fuller disclosure is obtained.

    2. Building the Financial Health Pillar (50% of the Composite Score)

    Financial health forms the backbone of the rubric and typically carries around half of the total weight. The underlying premise, confirmed in several 2025 pilot programs, is that financial distress signals often appear quarters before visible supply failures, especially in capital-intensive segments such as REE separation, lithium conversion and deep-level PGM mining.

    A common structure for the financial pillar uses four core ratios, normalised to a 0–50 sub-score:

    • Liquidity (20% of composite score; 0–20 points). Based on metrics such as the current ratio or available cash against short-term obligations. Rubrics often allocate the highest scores when liquidity exceeds roughly 2.0x, mid-range scores for ratios in the 1.5–2.0x band, and low scores when liquidity falls below that. For REE processors or lithium converters with large working-capital swings, this metric has repeatedly flagged stress well before missed shipments.
    • Debt-to-equity (around 15% of composite; 0–15 points). Leverage is scored more favourably when below roughly 0.5x, falls into a neutral band between about 0.5x and 1.0x, and drops sharply when leverage climbs beyond that. In South African PGM mining, for example, highly leveraged operators have proven particularly exposed to wage shocks and logistics interruptions.
    • Free cash flow (around 10% of composite; 0–10 points). Persistent positive free cash flow (FCF) after sustaining capex generally attracts higher scores, indicating capacity to self-fund expansions and ESG compliance. Extended periods of negative FCF, as seen in some lithium producers during market downturns, tend to compress resilience scores even when headline earnings remain positive.
    • Interest coverage (around 5% of composite; 0–5 points). An interest coverage ratio above roughly 5x often sits in the top scoring band, 3–5x in a middle band, and below 3x in a high-risk band. In volatile rate environments, this parameter has been a sensitive early-warning indicator.

    In the pilots that inspired this framework, a diversified REE producer with liquidity comfortably above 2x, moderate leverage and positive FCF-profiles similar to MP Materials in the US-typically landed in the upper 40s out of 50 on the financial pillar. Conversely, several small single-asset lithium developers scored below 30, largely driven by thin liquidity and leverage tied to project finance.

    Across a sample of strategic metals suppliers, more than half of the subsequent disruptions traced back to balance sheet weakness, even where operations and quality metrics had previously appeared stable. This experience underpins the decision to allocate around 50% of the total resilience score to financial health.

    Global supply chains for strategic materials and their interconnected risks.
    Global supply chains for strategic materials and their interconnected risks.

    3. Geopolitical and Jurisdictional Adjustments (up to ~20 Points)

    Once the financial sub-score is calculated, the framework applies jurisdiction-specific modifiers reflecting geopolitical, regulatory and logistics risk. These adjustments typically account for up to 20 points of the composite score, and are derived from structured country and route risk assessments rather than subjective impressions.

    Common adjustment categories include:

    • Sanctions and export controls. Suppliers in or heavily exposed to jurisdictions with active or potential sanctions regimes (for example, Russian PGMs or certain Chinese REE segments subject to export licence regimes) frequently receive downward adjustments.
    • Resource nationalism and permitting risk. Countries with a track record of abrupt royalty changes, licence reviews or moratoria on new projects, particularly for lithium and cobalt, often trigger score deductions even where corporate finances are solid.
    • Infrastructure and logistics reliability. South African PGM value chains, for instance, have been affected by rail and port constraints; Myanmar’s tin and cobalt flows have faced intermittent disruptions; certain Latin American bulk mineral exports have contended with port congestion and climate-related events.
    • Rule of law and contract stability. Australian, Canadian, EU and US jurisdictions often receive neutral or slightly positive adjustments for legal predictability, balanced against longer permitting timelines.

    Risk analytics providers such as Everstream typically express these factors as geo-risk scores that can be translated into modest point bonuses or deductions. A Chinese REE separator with strong finances but heavy exposure to quota-based export controls, for example, may lose several points relative to a financially comparable Australian or North American peer.

    4. ESG-Linked Financial Pressures (around 15 Points)

    In strategic materials, ESG factors often translate directly into balance sheet stress or resilience. Environmental compliance expenditure, rehabilitation obligations, carbon costs and social licence all affect long-term solvency. Rather than treat ESG as an entirely separate dimension, many teams translate it into a distinct 0–15 point block tightly linked to financial impact.

    Typical scoring elements include:

    • Access to sustainability-linked finance. Suppliers that have secured sustainability-linked loans or green bonds tied to clear environmental performance targets often demonstrate both market confidence and lower funding risk. Iluka Resources’ Eneabba rare earths development in Australia is a frequently cited example of ESG-linked financing bolstering perceived resilience.
    • Regulatory and community disputes. Repeated fines, litigation or community opposition-such as those seen around some REE processing facilities in Southeast Asia—can drive negative adjustments due to the risk of forced shutdowns or expensive retrofit requirements.
    • Traceability and human rights exposure. Cobalt supply chains with exposure to artisanal mining in the DRC, or gold sourced from conflict-affected areas, often carry a higher risk of regulatory or reputational shocks. Robust traceability systems can partially offset that risk.
    • Carbon and energy intensity. PGM smelting, alumina refining and some REE processes are energy-intensive. Exposure to volatile power markets or tightening carbon regimes in the EU and UK can erode margins and raise financing costs, feeding back into financial scores.

    In several battery and electronics case studies, suppliers that invested early in ESG compliance and traceability improved their ESG sub-scores by a few points and, more importantly, preserved access to capital at acceptable terms when new regulations took effect.

    5. Operational Performance and Continuity Metrics (around 15 Points)

    The remaining portion of the composite score—often about 15 points—captures the day-to-day ability of a supplier to deliver material reliably and at consistent quality. Financially robust firms can still underperform here, and operational fragility can amplify the impact of even moderate financial stress.

    Framework for scoring supplier resilience using a composite 0–100 rubric.
    Framework for scoring supplier resilience using a composite 0–100 rubric.

    Operational sub-metrics commonly used include:

    • On-time, in-full (OTIF) performance. Historical delivery records over several years, adjusted for force majeure events, provide a direct view of execution capability. Strategic metals vendors supplying defense and aerospace programs often track this at high granularity.
    • Asset concentration. Single-mine or single-smelter suppliers of PGMs, tungsten or tantalum are more exposed to site-specific failures than diversified producers such as Glencore with multiple copper–cobalt or nickel operations.
    • Redundancy and maintenance practices. The presence of backup equipment, alternative processing lines or tolling partners can materially reduce disruption risk.
    • Quality consistency. Frequency of quality excursions, particularly for battery-grade chemicals or magnet-grade REEs, directly impacts downstream yield and can create hidden resilience risk.

    A recurring discovery in REE and lithium programs has been that some suppliers with impeccable OTIF histories but weak financials experienced sudden service failures when credit lines tightened, whereas suppliers with slightly lower OTIF but stronger balance sheets weathered shocks more effectively.

    6. Composite Scoring, Thresholds and Refresh Cycles

    Bringing the pieces together, many teams adopt a 0–100 composite score with indicative weights such as:

    • Financial health: 50 points
    • Geopolitical and jurisdictional risk: 20 points
    • ESG-linked financial impact: 15 points
    • Operational performance and continuity: 15 points

    Scores are usually banded. In pilot applications across dozens of strategic metals suppliers, those with composite scores below roughly 60 were disproportionately represented among subsequent disruption events, while suppliers above 80 rarely experienced severe interruptions. Overall, the rubric showed an approximate 85% correlation between risk bands and actual disruption avoidance in those pilots, which encouraged further refinement.

    Initial scoring campaigns for a new supplier panel often require 4–6 weeks, reflecting the time needed to obtain data, reconcile discrepancies and validate metrics with internal finance and risk teams. Once baselines are established, quarterly refresh cycles in the range of 1–2 weeks have been common, anchored on new financial reports, updated geo-risk assessments and any significant ESG or operational events.

    Illustrative examples often cited internally include:

    • Lynas Rare Earths. Refinancing and regulatory developments around its Malaysian processing plant altered leverage and permitting risk over time, creating noticeable shifts in both the financial and ESG/jurisdictional sub-scores.
    • Albemarle. Large growth capex programs in lithium, combined with market downturns, compressed free cash flow and affected the financial pillar, even as operational capabilities remained strong.
    • Glencore. Diversified asset portfolios and multi-region exposure helped offset risks from specific assets such as copper–cobalt operations in the DRC when scenario stress tests were applied.

    7. Stress Testing and Scenario Analysis

    Static scores give only a snapshot. Stress testing examines how a supplier’s resilience score would evolve under adverse but plausible scenarios over a one- to three-year horizon.

    Typical scenarios for strategic materials include:

    • Export controls and trade restrictions. For REEs and critical battery raw materials, teams model the impact of tighter export licence regimes or quotas, particularly for Chinese-origin feedstocks, on revenue, cash flow and capital access.
    • Operational disruption. Strikes, tailings incidents, power shortages or key equipment failures at a single-asset PGM or tungsten mine are modelled as multi-month production losses, with consequences for liquidity and covenant headroom.
    • Regulatory tightening. Implementation of the EU Critical Raw Materials Act or updated EU Battery Regulation can introduce additional compliance costs and potential temporary curtailments for suppliers without robust ESG systems.
    • Macroeconomic shocks. Changes in interest rates or demand cycles that affect financing conditions and debt service.

    The stress test output is then translated into revised financial, ESG and operational sub-scores. In several applications, scenarios that pushed liquidity and interest coverage below the higher scoring bands reduced the composite resilience score by more than 10 points, reclassifying some suppliers into higher-risk categories even before any real-world incident occurred.

    Analyzing supplier financial health as the foundation of resilience scoring.
    Analyzing supplier financial health as the foundation of resilience scoring.

    8. Common Failure Modes in Supplier Resilience Scoring

    Several recurring issues have emerged across organizations attempting to score supplier resilience for strategic materials:

    • Data gaps and opacity. Private or state-linked suppliers, especially in parts of Asia and Africa, may provide limited visibility into debt structures or related-party transactions. Some teams have used bond yields, trade credit insurance pricing and banking relationships as proxies, but these remain approximations.
    • Static scores. Scores frozen for a year or more have repeatedly failed to capture rapid leverage build-up or deteriorating liquidity, particularly in fast-moving segments such as lithium or cobalt where market conditions can change quickly.
    • Over-weighting historical performance. Long-standing on-time delivery records have, in some cases, obscured emerging financial stress. Several disruptions in REE and silver supply chains occurred at suppliers with near-perfect historical OTIF but eroding balance sheets.
    • Over-complex rubrics. Extremely granular scorecards with dozens of inputs per pillar tend to suffer from missing data and inconsistent application across suppliers, undermining comparability.

    One practical learning has been that a concise set of well-understood metrics, refreshed regularly and combined with structured scenario analysis, has outperformed more elaborate models in anticipating disruptions.

    9. Summary: A Finance-First Lens on Supplier Resilience

    Across defense, battery, aerospace and electronics supply chains, scoring supplier resilience for strategic materials has gradually converged on a finance-first, 0–100 rubric. Financial health typically accounts for half the score, with clear thresholds on liquidity, leverage, free cash flow and interest coverage. Geopolitical context, ESG-linked financial impacts and operational continuity fill in the remaining dimensions.

    In 2025 pilot implementations, this structure correlated strongly—around 85%—with the ability to anticipate and sidestep disruptions, particularly for REE, lithium and PGM suppliers. Case work on companies such as Lynas Rare Earths, MP Materials, Albemarle, Glencore and Iluka Resources illustrated how different balance sheet profiles, jurisdictions and ESG trajectories translate into distinct resilience scores, even when headline production volumes appear similar.

    For organizations dealing with tight markets and heightened regulatory scrutiny, the key insight has been that a quantified, finance-anchored resilience score offers a common language for supply chain, finance, risk and ESG teams to assess strategic metals suppliers and to compare tradeoffs across jurisdictions, technologies and business models.

  • How to integrate strategic materials risk into s&op and fp&a

    How to integrate strategic materials risk into s&op and fp&a

    In electronics, battery, aerospace, and automotive programs, strategic materials such as rare earth elements (REEs), lithium, cobalt, and platinum group metals (PGMs) now drive production feasibility as much as demand. Material shortages have already triggered 20-50% cost spikes in several segments, while the International Energy Agency (IEA) projects a significant cobalt deficit by 2025 and notes that China supplies around 60% of global dysprosium for magnets. Many planning teams have responded by integrating these risks directly into Sales & Operations Planning (S&OP) and Financial Planning & Analysis (FP&A) cycles.

    The following framework describes how organisations are operationalising that integration, what has worked in practice, and where failure modes tend to appear.

    Operational Attention Points & Signals to Watch

    • Key tradeoffs: Higher resilience (often cited at 15-25% disruption reduction) versus increased inventory holding (commonly 5-10% higher) and longer qualification timelines for alternative sources.
    • Critical risks: Hidden Tier‑2/3 dependencies, concentration of supply in a single jurisdiction, and over-reliance on a small number of refineries or separation plants.
    • Failure modes: Static “once-a-year” risk registers, S&OP and FP&A using different assumptions, and mitigation plans not tested against actual disruption scenarios.
    • Indicators to watch: New export controls or quotas on REEs and battery metals, changes to critical minerals lists (U.S., EU, Japan), major mine or refinery incidents, and revisions to IEA/USGS outlooks.
    • Governance signals: Existence of a cross-functional risk board, joint KPIs across supply chain and finance, and automated external data feeds rather than manual tracking.

    1. Map Strategic Materials Exposure Across the Value Chain

    Integration typically starts when planners discover that a disruption does not originate at a Tier‑1 supplier, but several layers upstream. A common example has been neodymium or dysprosium shortages that surfaced as delivery delays at a magnet fabricator, only later traced back to a constrained separation plant in China or to policy moves affecting concentrates.

    1.1 Identify High-Impact Materials in the Portfolio

    Teams usually classify “strategic” materials based on a mix of technical and supply criteria:

    • Function-critical role: Materials whose absence halts assembly or dramatically degrades performance, such as NdFeB magnets in EV drive motors, cobalt in high-nickel cathodes, or PGMs in aerospace turbines and autocatalysts.
    • Limited substitution: Where redesign to another chemistry or alloy would be complex, heavily regulated, or multi-year in validation (e.g., palladium to platinum substitution in catalysts, or LFP vs NMC in battery packs).
    • Concentrated supply base: Exposure to materials dominated by a few mining regions or processors. Examples often cited include REEs concentrated in China, cobalt in the Democratic Republic of Congo, and certain PGMs in Southern Africa and Russia.
    • High demand-growth pressure: Metals flagged by IEA and others as facing structural deficits, such as cobalt (with a projected deficit of around 30% mid-decade) and select REEs.

    The output is usually a shortlist of strategic materials per business line, tagged to specific products, platforms, and revenue streams.

    1.2 Trace Tiered Supply and Logistics Paths

    Once priority materials are known, organisations extend the classic S&OP bill-of-materials view upstream:

    • Link finished products to subcomponents (e.g., motors, catalysts, chips).
    • Map those subcomponents to critical materials (NdPr, Dy, Li, Co, PGMs, high-purity alumina, etc.).
    • Identify Tier‑1 and, where feasible, Tier‑2/3 suppliers, including mining and refining locations.
    • Overlay transport corridors, ports, and choke points.

    In practice, teams sourcing magnets from non-Chinese suppliers such as Lynas Rare Earths or MP Materials have often discovered that while oxide supply was diversified, downstream alloying or magnetising still depended on facilities in China. Similar patterns appear in lithium chains involving Australian miners like Pilbara Minerals or Albemarle, with conversion and cell production tied into Chinese or other Asian hubs.

    1.3 Typical Failure Modes in Exposure Mapping

    Several recurring issues have appeared across programmes:

    • Incomplete Tier‑2/3 visibility: Suppliers report country of origin as the smelter location rather than the mine, masking sanctions or conflict-region exposure.
    • Static documentation: Supply chain maps built as one-off projects, not incorporated into S&OP master data and so outdated within months.
    • Disconnected compliance: ESG or conflict-mineral reports collected for audits, but not linked into planning models that drive sourcing and capacity decisions.

    Programmes that have embedded this mapping into master data, compliance workflows, and supplier portals generally report fewer surprises when disruptions occur.

    2. Bring Strategic Materials Risk into the Monthly S&OP Cycle

    Once exposure is visible, the next step observed in practice is tagging material risk directly onto demand and supply plans. The aim is not to create a parallel “risk process” but to let S&OP scenarios reflect which volumes are structurally fragile.

    Visualizing strategic materials risk across the end-to-end supply chain.
    Visualizing strategic materials risk across the end-to-end supply chain.

    2.1 Risk-Tagged Demand and Supply Plans

    S&OP teams increasingly add strategic-material attributes to product families and supply nodes:

    • Demand side: Forecasts for EV models, data-centre hardware, or aero engines carry tags for their reliance on lithium, Ni-rich chemistries, REEs, or PGMs.
    • Supply side: Supply plans distinguish volumes coming from higher-risk jurisdictions or single points of failure, such as one refinery or one separation plant.
    • Risk metrics: Each material-route combination carries scores for likelihood, impact, and velocity (speed at which disruption translates into lost production).

    During monthly S&OP meetings, planners can then highlight, for example, that the next quarter’s magnet demand for a new e‑axle programme is 80% exposed to dysprosium sourced from a single country that already supplies around 60% of global Dy used in magnets.

    2.2 Scenario-Based Balancing of Demand and Supply

    Rather than a single “constrained plan,” many organisations now run multiple S&OP scenarios incorporating strategic materials risk:

    • Base case: Assumes current supply portfolios hold, with moderate disruption probabilities.
    • Adverse case: Reflects downside events such as export restrictions on specific REEs, energy rationing in refining hubs, or enforcement shifts in the U.S. Inflation Reduction Act (IRA) and EU critical raw materials regulations.
    • Substitution/reallocation case: Tests whether production can shift to chemistries or product mixes that rely less on constrained materials (e.g., LFP-heavy mix for batteries, different PGM loadings in catalysts).

    In one aerospace example, planners discovered during scenario runs that a relatively small increase in PGMs safety stock dramatically reduced the risk of grounded aircraft, whereas diversifying to an additional supplier would have taken years of qualification. That kind of insight rarely emerges without explicit risk-tagged S&OP simulations.

    3. Translate Material Risk into FP&A Models

    Embedding risk in S&OP creates operational visibility, but finance teams still require a way to translate it into budgets, cash-flow forecasts, and project economics. This is where probability-impact scoring, Monte Carlo simulations, and risk-adjusted scenarios enter FP&A routines.

    3.1 Probability-Impact Scoring and Monte Carlo Simulation

    FP&A teams commonly maintain a register of strategic materials with estimated disruption probabilities and financial impacts. Typical inputs include:

    • Supply deficits and demand growth: For cobalt, analysts frequently refer to IEA forecasts signalling a deficit of around 30% mid-decade under certain scenarios.
    • Price and basis-risk volatility: Historical volatility during past disruptions, such as PGMs spikes linked to labour unrest or sanctions.
    • Volume-at-risk: Percentage of annual output exposed to high-risk jurisdictions or single-source refiners, derived from S&OP exposure mapping.

    These parameters feed into Monte Carlo runs or discrete downside scenarios. The output is a distribution of potential margin, EBITDA, or cash-flow outcomes rather than a single forecast. Some organisations then calculate risk-adjusted net present values for major projects (for example, new cell plants, magnet lines, or recycling capacity) by explicitly including the probability of material constraints.

    High-level framework for embedding materials risk into S&OP and FP&A cycles.
    High-level framework for embedding materials risk into S&OP and FP&A cycles.

    3.2 Linking Risk Outputs Back to Planning Decisions

    What distinguishes mature practices is not the sophistication of the model, but the way results are fed back into operational decisions:

    • S&OP inputs: FP&A provides bands for “risk-adjusted available supply” by material, which S&OP uses when approving demand plans and allocations between customers or regions.
    • Inventory strategy: Analysis often supports holding 3–6 months of safety stock for the highest-risk materials. One battery manufacturer quantified that holding an additional 1,000 MT of NdPr equivalent, at an illustrative $80/kg, implied roughly $50M of working capital.
    • Capital allocation: Risk-adjusted scenarios highlight where nearshoring, diversification, or recycling could change the distribution of outcomes, supporting board-level discussions.

    For example, several OEMs have modelled the impact of incorporating more recycled material through partners such as Li‑Cycle or PGM recyclers like Heraeus, observing that even modest secondary feedstock shares can materially reduce downside tails in the distribution.

    4. Align Mitigations Across Procurement, S&OP, and FP&A

    Mitigation levers-diversification, nearshoring, buffers, design changes, and recycling-only reduce risk when they are consistently reflected in both operational and financial plans. Fragmented responses are a frequent cause of disappointment.

    4.1 Diversification and Nearshoring Tradeoffs

    Procurement-led initiatives have included:

    • Geographic diversification of lithium supply across Australian and South American sources, with processing partly shifted to North America or Europe.
    • Alternative REE chains using miners and separators like Lynas and MP Materials to reduce reliance on a single country, even when some magnet manufacturing still sits in East Asia.
    • Mixed PGM sourcing between South African producers such as Sibanye-Stillwater and Russian entities like Nornickel, sometimes complemented by higher recycling intake.

    FP&A teams usually model these strategies as portfolios of supply routes, each with distinct disruption probabilities, compliance profiles (e.g., IRA-eligible, EU-critical compliant), and working-capital implications. S&OP then incorporates these portfolios when approving allocation and capacity plans.

    4.2 Buffers, Substitution, and Recycling

    Other levers are more operational but still have strong financial effects:

    • Tiered safety stocks: Higher buffers for the riskiest REEs and PGMs, lower for more diversified metals, with inventory levels reviewed quarterly as risk scores evolve.
    • Design and substitution roadmaps: For instance, some EV programmes maintain optionality between nickel-rich and LFP chemistries, while catalyst makers work on PGM thrift or rebalancing between platinum and palladium.
    • Recycling integration: Firms such as Li‑Cycle in batteries or Heraeus in PGMs feature as strategic partners in S&OP and FP&A plans, providing a secondary stream that is less exposed to primary mining disruptions.

    In one consumer electronics example, alignment between procurement, S&OP, and FP&A enabled a major OEM, similar to Apple, to accelerate the use of recycled REEs in speakers and haptics. The result, as reported internally, was not only reduced primary dysprosium exposure but also smoother quarterly planning, since recycled inputs proved less correlated with geopolitical shocks.

    5. Governance, Data, and Automation

    Early integration attempts often faltered because they relied on ad hoc heroics or one-off analysis projects. More stable approaches share three elements: governance, consistent metrics, and automated data feeds.

    Linking mine and logistics disruptions to financial and operational planning.
    Linking mine and logistics disruptions to financial and operational planning.

    5.1 Cross-Functional Risk Board and Joint KPIs

    Organisations that have institutionalised this work typically operate a cross-functional risk board bringing together S&OP, FP&A, procurement, engineering, and sustainability. The board reviews a concise set of joint indicators, such as:

    • Material-related disruption downtime as a percentage of total production time (with many aiming to keep this below low single digits).
    • Variance of material-related spend against planned ranges (often targeted within a 10% band, depending on volatility).
    • Share of volume sourced from high-concentration jurisdictions for each strategic material.
    • Share of recycled or secondary material in total supply for relevant metals.

    These metrics keep discussions anchored in system-level outcomes rather than siloed cost or availability concerns.

    5.2 External Data Feeds and Early-Warning Indicators

    Another discovery in many programmes has been the importance of data timeliness. Annual reports from USGS or IEA provide strategic context, but disruptions in REEs, cobalt, or PGMs often unfold over weeks or days.

    • Automated feeds: Some firms have connected planning dashboards to structured data from USGS, IEA, customs statistics, and curated news wires, feeding into risk scores almost in real time.
    • Event triggers: S&OP and FP&A models often include triggers for re-running scenarios when major events occur-new export controls, sanctions, mine accidents, or abrupt shipping bottlenecks.
    • Vendor intelligence: Larger OEMs maintain structured dialogues with key suppliers such as Albemarle, Ganfeng, Lithium Americas, Lynas, Sibanye-Stillwater, and specialist recyclers, integrating qualitative forward views into planning cycles.

    Experience from 2020–2024 suggests that organisations with this kind of monitoring in place tended to re-plan earlier during shocks, accepting temporary working-capital increases in exchange for reduced lost-volume risk.

    6. Summary of Observed Outcomes and Open Questions

    Across battery, aerospace, and advanced manufacturing sectors, integrated approaches to strategic materials risk have produced a few consistent patterns:

    • Embedding material risk identification into monthly S&OP cycles, rather than treating it as a separate “risk project,” has made production and allocation decisions more realistic and defensible.
    • Translating exposure into FP&A models using probability-impact scoring and Monte Carlo simulation has clarified the financial stakes of choices such as diversification, nearshoring, and recycling investments.
    • Coordinated mitigations—diversified sourcing, tiered safety stocks, design options, and secondary feedstock—have tended to deliver resilience gains often cited in the 15–25% range, albeit with 5–10% higher inventory holding and some delay from qualification and compliance work.
    • Governance via a cross-functional risk board, with a limited set of shared KPIs and automated external data feeds, has helped avoid siloed reactions and stale risk assessments.

    Open questions remain around how aggressively to pursue nearshoring when local capacity is still immature, how to balance long-term offtake-like commitments with flexibility, and how quickly recycling technologies can scale in REEs, lithium, and PGMs. Nonetheless, integrating strategic materials risk into S&OP and FP&A has shifted the discussion from reactive firefighting toward structured tradeoff management between resilience, working capital, and compliance in an increasingly constrained materials landscape.

  • Designing a strategic materials risk index for your supply chain

    Designing a strategic materials risk index for your supply chain

    Designing a strategic materials risk index for supply chains has become a recurring task across energy, defense, and advanced manufacturing. Rare earth elements, battery metals, and precious metals behave differently from bulk commodities: a handful of mines or refineries can control global flows, a single export quota can reshape trade routes, and price series can behave more like small-cap equities than raw materials. A Strategic Materials Risk Index (SMRI) gives organizations and analysts a structured way to compare these exposures across materials, suppliers, and time horizons.

    At its core, an SMRI is a scoring framework that blends quantitative indicators and qualitative judgments into comparable 0-10 style risk scores for each material and, in some cases, for each major supplier. The following methodology reflects what risk teams, commodity analysts, and journalists have been using in practice to move from anecdotal concerns (“lithium is volatile”, “China dominates rare earths”) to disciplined, reproducible assessments.

    Key Operational Attention Points

    • Tradeoffs: Higher geographic diversification can come with weaker traceability or ESG credentials; lower volatility materials may still face acute regulatory or sanctions risk.
    • Failure modes: Overreliance on midstream chokepoints (e.g., rare earth separation in China) often goes underweighted relative to mine-level risk.
    • Signals to watch: export control announcements, mining license changes, refinery outages, and widening bid-ask spreads in thinly traded materials.
    • Data gaps: artisanal and small-scale production, off-exchange trades, and opaque long-term contracts frequently limit visibility for index scoring.

    1. Setting Scope, Risk Appetite, and Time Horizon

    An effective SMRI starts with a clear definition of what is being measured and for what purpose. In practice, teams first map the “material universe” relevant to a given supply chain or coverage angle. For an EV-focused analysis, lithium, nickel, cobalt, graphite, and neodymium-praseodymium (NdPr) tend to dominate. Aerospace and defense analyses often center on titanium, tungsten, high-purity aluminum, and specific rare earths used in guidance systems and permanent magnets.

    Three scoping dimensions tend to matter most:

    • Position in the value chain: Some teams index risk at the ore or concentrate level; others focus on refined products (e.g., battery-grade lithium carbonate equivalent, separated rare earth oxides) or even alloyed forms.
    • Direct vs. indirect exposure: Primary materials used in-house differ from materials embedded deeper in supplier tiers (for example, palladium in catalytic converters sourced as complete units).
    • Risk appetite and mission-criticality: Defense primes, grid-scale storage manufacturers, and jewelers often apply very different tolerance thresholds to disruption, compliance risk, and substitution.

    Time horizon framing is equally important. Near-term security (the next procurement cycle) tends to be driven by operational capacity, logistics, and current policy. Medium-term (one to several years) brings in project development pipelines and foreseeable regulatory shifts. Long-term planning introduces technology substitution, recycling, and industrial policy as dominant factors. Most SMRI implementations so record, at minimum, a “current” and a “strategic” score for each material.

    2. Building the Data Spine for an SMRI

    Before scoring begins, teams typically assemble a data spine that can support consistent comparisons across materials. In practice, this tends to include:

    • Production and reserve data: Country- and company-level output and reserves, often drawn from geological surveys, company filings, and industry databases.
    • Processing and refining capacity: Midstream capacity for separation, refining, and alloying. For rare earths, for instance, China accounts for roughly 70% of global rare earth oxide production and about 85% of rare earth separation capacity.
    • Trade and logistics flows: Import-export data by HS code, dominant routes and ports, and known chokepoints.
    • Geopolitical and regulatory information: Sanctions lists, export control regimes, environmental and labor regulations, and critical raw materials lists (e.g., EU, US, Japan).
    • Market data: Spot prices, where available forward curves, and liquidity indicators such as trading volumes or bid–ask spreads.
    • Supplier-level information: Financial statements, ESG reports, incident logs, and audit outcomes for major producers such as Lynas Rare Earths, MP Materials, Rio Tinto, Glencore, and Newmont.

    Data gaps are unavoidable, particularly for artisanal production and opaque midstream tolling arrangements. Mature SMRIs typically flag such gaps explicitly and incorporate a data-quality or “confidence” overlay rather than silently treating missing information as low risk.

    3. Core Risk Dimensions in a Strategic Materials Index

    Most robust SMRIs converge on five core dimensions. Each dimension is expressed as a 0–10 risk score, where higher values indicate higher risk, based on several sub-factors.

    3.1 Supply Concentration Risk

    This dimension reflects how exposed a material is to disruption from a small number of countries or producers, and from tight capacity.

    • Geographic concentration: One frequently used rubric interprets a score near 10 as “more than 80% of global production controlled by a single country”; a mid-range score around 5 corresponds to “roughly half to four-fifths from the three largest producing countries”; a low score near 1 implies “less than 30% from the top three.” Rare earths and tungsten (with production strongly centered in China, alongside Vietnam and Russia for tungsten) tend to sit at the high end of this scale.
    • Producer concentration: The number and independence of major producers. Markets dominated by a handful of firms, or by national champions closely tied to state policy, typically attract higher scores than diversified, multi-continent producer sets.
    • Capacity utilization and slack: Materials where mines, refiners, or separators run close to nameplate capacity leave little room to offset disruptions. Observed practice often treats “very high average utilization with minimal spare capacity” as high risk and “substantial spare capacity” as lower risk.
    • Midstream chokepoints: Even when mining is diversified, refining and separation can be horizontally concentrated, as seen in rare earth separation or cobalt refining in China.

    Supply concentration scores generally emerge from a weighted blend of these sub-factors, with midstream chokepoints receiving extra attention in materials such as rare earths, cobalt, and battery-grade lithium chemicals.

    3.2 Geopolitical and Regulatory Risk

    Here the index captures country-level instability and policy actions that can restrict supply even when geology and capacity appear ample.

    • Political stability: Teams often draw on composite indices to differentiate between stable jurisdictions and those with elevated risk of expropriation, conflict, or sudden policy shifts. Examples include cobalt production in the Democratic Republic of Congo or nickel in Indonesia.
    • Export controls and trade policy: Previous episodes of rare earth export quotas by China, restrictions on Indonesian nickel ore exports, or evolving controls on gallium and germanium illustrate how quickly trade policy can rewire markets. Materials that have already been subject to such measures tend to score at the higher end.
    • Sanctions exposure: Palladium and platinum sourced from Russia, for instance, intersect with US and EU sanctions regimes. Similar considerations apply to gold or tantalum originating from conflict-affected regions.
    • Compliance burden: Conflict minerals rules (for tin, tantalum, tungsten, and gold), emerging EU due diligence requirements, and national critical raw materials strategies can impose complex reporting and auditing obligations. Materials falling under multiple overlapping regimes are often scored as higher risk on this sub-dimension.

    Different organizations assign different weights here. Defense-oriented entities, for example, frequently place greater emphasis on sanctions and export controls, while consumer-facing brands often assign more weight to ESG and human rights compliance risk.

    3.3 Price Volatility and Market Liquidity

    Strategic materials can behave in markedly different ways financially. Lithium offers a vivid illustration: prices moved from around $5,000 per metric ton in 2020 to approximately $80,000 per metric ton in 2022, before retreating to roughly $15,000 per metric ton in 2024. Such swings contrast with more moderate, though still material, volatility in gold or silver.

    • Historical price volatility: Teams typically track standard deviations of daily or monthly prices over one- and three-year windows, normalised by mean price. Materials with very high relative volatility gravitate toward higher index scores.
    • Market liquidity and depth: Gold and silver, traded on COMEX and via the London Bullion Market Association, tend to exhibit tight spreads and deep order books. In contrast, rare earth oxides and many minor metals trade over the counter with thin volumes and wide spreads, earning higher risk scores.
    • Price discovery mechanisms: Transparent exchange benchmarks generally reduce perceived risk. Markets where a small set of producers, often in one country, effectively set prices through non-public contracts are usually treated as riskier.
    • Macro and policy sensitivity: Some materials track global growth, interest rates, or currency shifts; others respond primarily to technology-specific demand (e.g., EV adoption for lithium and NdPr) or to policy decisions (such as subsidies or bans).

    For journalists, this dimension often provides the most accessible narrative hook, linking a material’s SMRI profile to headline price moves and explaining why thin liquidity can amplify shocks.

    3.4 Supplier Operational and Financial Risk

    Beyond country-level and market-level dynamics, the SMRI often includes a supplier layer for major counterparties.

    • Financial strength: Larger diversified miners such as Rio Tinto, Glencore, or Newmont generally present different risk profiles from single-asset producers or heavily leveraged mid-tier firms. Analysts look at leverage, cash generation, access to capital markets, and ownership structure.
    • Operational reliability: Historical delivery performance, mine uptime, safety incidents, and environmental breaches all feed into perceived risk. A mine operating consistently near technical limits, or with a history of tailings failures, tends to score higher.
    • Asset concentration: Dependence on a single mine, smelter, or separation plant for a large share of global supply creates a structural risk, independent of corporate strength.
    • ESG and community relations: Local opposition, indigenous rights disputes, or non-compliance with environmental permits can delay expansions or even halt operations, affecting medium-term security of supply.

    In an SMRI context, supplier scores are often aggregated with material-level scores to highlight where corporate concentration amplifies or mitigates country and market risks.

    3.5 Substitution and Technology Risk

    This dimension captures how dependent a given application is on a specific material, and how likely technology pathways are to reduce or increase that dependence.

    • Functional criticality: Some materials provide irreplaceable properties in current designs (e.g., neodymium-iron-boron magnets in high-performance motors). Others can be swapped with limited performance sacrifice.
    • Availability of substitutes: The presence of drop-in or partial substitutes, even at some performance loss, often pulls risk scores down.
    • Technology trajectory: R&D pipelines, patent trends, and announced product roadmaps indicate whether demand is likely to pivot away from or further toward a given material. For instance, emerging LFP and sodium-ion chemistries alter longer-term lithium and cobalt exposure.
    • Recycling and circularity: High recycling rates, existing urban mining infrastructure, and recoverability from end-of-life products can temper primary supply risk over longer horizons.

    Because this dimension is inherently forward-looking, SMRIs often express it as a separate “strategic” risk score, alongside a more near-term operational risk score.

    4. Weighting, Aggregation, and Calibration

    Once dimension scores exist, the question becomes how to weight them. In practice, weighting reflects institutional priorities and sector exposure. A precious metals refiner might assign greater weight to price volatility and sanctions risk; a magnet manufacturer might prioritise supply concentration and technology substitution.

    Common practice includes:

    • Setting baseline weights for the five dimensions (for example, equal weighting for an exploratory analysis).
    • Adjusting weights for specific user groups or use-cases (e.g., a “compliance-focused” view vs. a “production continuity” view).
    • Calibrating by back-testing: comparing historic SMRI scores with known disruption events such as China’s rare earth export quotas, the Russia–Ukraine conflict impacts on palladium, or previous cobalt supply squeezes.

    Calibration exercises often reveal where an index underweights midstream chokepoints or overweights price volatility relative to hard physical risks. Iterative refinement tends to bring the framework closer to how disruptions actually propagate through supply chains.

    5. Example Walkthrough: Lithium in an EV-Oriented Supply Chain

    To illustrate how these elements come together, consider lithium as viewed through an EV-focused SMRI lens.

    • Supply concentration: Mining is relatively diversified across Australia, Chile, China, and others, suggesting moderate geographic concentration. However, refining into battery-grade chemicals shows heavier concentration in China, lifting the overall supply concentration score.
    • Geopolitical and regulatory: Producing countries range from relatively stable OECD jurisdictions to Latin American states debating nationalisation and higher royalties. Geopolitical risk is therefore mixed, while regulatory risk around environmental permits and water use is non-trivial.
    • Price volatility and liquidity: The extreme 2020–2024 price swings highlight high volatility. Liquidity is improving, with emerging exchange contracts and benchmarks, but remains shallower than for base or precious metals, so scores here tend to be elevated.
    • Supplier risk: Major diversified miners coexist with specialised lithium producers. Single-asset exposure, project delays, and technical challenges in brine processing can increase supplier-level risk for specific counterparties.
    • Substitution and technology: Current mainstream EV chemistries are heavily lithium-dependent. However, chemistries differ in cobalt and nickel intensity, and long-term innovation (including sodium-ion) introduces uncertainty over multi-decade horizons. Substitution risk is therefore significant but plays out slowly.

    Analysts building an SMRI score for lithium often end up with high scores on volatility, medium-to-high on supply concentration and geopolitical/regulatory risk, and more nuanced, horizon-dependent scores for substitution and technology risk. The resulting index value then anchors discussions about diversification, recycling, or R&D prioritisation, without dictating any single course of action.

    6. Signals, Failure Modes, and Use in Reporting

    Across materials, several recurring failure modes appear when SMRIs are absent or underdeveloped:

    • Treating “number of mines” as a proxy for security while ignoring refining and separation bottlenecks.
    • Focusing solely on prices and ignoring compliance or sanctions risk, particularly in gold, tantalum, and palladium.
    • Underestimating the pace at which export controls or quotas can be introduced, as seen in multiple rounds of Chinese measures on rare earths and other specialty materials.
    • Assuming that technological substitution will arrive faster than project development timelines, especially in defense and aerospace applications.

    For business and policy journalists, a material-level SMRI can also provide a backbone for explanatory reporting. Each dimension translates naturally into narrative angles: concentration becomes a story about geographic dependencies; geopolitical risk links to sanctions and industrial policy; volatility and liquidity illuminate why certain price spikes feel disorderly; supplier and technology dimensions connect to corporate strategy and innovation coverage.

    Over time, as more data points are collected and back-tested against real disruptions, SMRIs evolve from one-off analytical exercises into living tools that support procurement, policy analysis, and public communication about the resilience of strategic materials supply chains.

  • How to brief your c‑suite on strategic materials in 20 minutes

    How to brief your c‑suite on strategic materials in 20 minutes

    How to Brief a C‑Suite on Strategic Materials in 20 Minutes: Framework and Failure Modes

    C‑suite attention on strategic materials has shifted from price cycles to security of supply. Copper deficits linked to AI and electrification, policy‑driven rare earth markets, and central bank gold buying have turned metals into explicit risk topics in board discussions. In many organisations, the only available window to raise these themes is a tightly constrained 20‑minute briefing slot.

    Teams that handle this effectively tend to approach the briefing as a structured risk exercise rather than a market tour: ranking materials by criticality, tying them directly to assets and projects, and using a compact slide deck that surfaces tradeoffs and decision points without drowning executives in data.

    • Tradeoffs / attention points: security of supply vs. premium for diversification; China‑centric refining vs. jurisdictional and ESG constraints; short‑term stockpiles vs. longer‑term substitution and redesign.
    • Risks and failure modes: over‑focusing on prices; underestimating refining chokepoints; ignoring policy timelines; presenting a “tour of metals” with no clear linkage to enterprise risk.
    • Indicators / signals to watch: refined copper deficit updates; export‑control announcements on rare earths; central bank gold purchases; commissioning progress at non‑Chinese projects such as MP Materials; changes in all‑in sustaining costs for silver and other co‑products.

    1. Define the Briefing’s Scope Around Decisions, Not Markets

    In practice, the most effective 20‑minute briefings are built backwards from the decisions executives are likely to face in the next 12‑18 months. In strategic materials, those decisions often cluster around three axes:

    • Buffers and stockpiles – for example, whether to hold additional inventories of copper or rare earth magnet materials to cover project pipelines.
    • Supply diversification – whether to qualify alternative smelters, refiners, or jurisdictions beyond China, even where this implies a premium or higher operating complexity.
    • Product and technology choices – whether to accept redesigns that shift from copper to aluminum, from high‑dysprosium magnets to alternative formulations, or from primary silver to recycled content.

    Clarifying in advance which of these decisions need executive attention influences slide order and depth. For example, a board focused on data center build‑outs reacts most strongly to copper and silver risks, while a defence‑exposed OEM tends to engage more with rare earths and PGMs (platinum group metals).

    Another framing choice that changes the briefing’s character is whether it is primarily diagnostic (mapping exposures and vulnerabilities) or propositional (laying out distinct risk‑mitigation paths with tradeoffs and timing). Diagnostic briefings often emphasise heatmaps and exposure analytics; propositional briefings allocate more time to scenarios and “if‑then” implications.

    2. Rank Materials by 2026 Strategic Criticality

    A 20‑minute slot does not accommodate detailed treatment of every metal. Teams therefore commonly create a ranked list of 4–6 “headline” materials based on a consistent set of criteria, and orient the deck around that list. A pattern often seen in 2024–2026 briefings is:

    • Copper – Forecast refined deficit around 2026; one widely cited estimate is a shortfall of roughly 150,000 metric tons, driven by AI data centers, grid upgrades, and electrification.
    • Rare earths – Approximately 90% of refining and magnet production concentrated in China; export controls and long‑term US Department of Defense offtakes (for example with MP Materials) create a policy‑driven, rather than purely demand‑driven, market.
    • Silver – Multiple years of reported physical deficit, with photovoltaic demand and electrification drawing down inventories; many mines produce silver as a by‑product of copper or lead‑zinc, limiting supply responsiveness.
    • Gold – Central banks have been reported to purchase on the order of 70 tonnes per month on average post‑2022, turning gold into a visible geopolitical reserve tool.
    • Lithium and aluminum – Headlines often describe these as oversupplied, yet refining and smelting remain heavily China‑centric (various analyses place lithium refining around 70% in China, and copper refining near 50%), creating potential chokepoints despite apparent upstream abundance.

    To keep this ranking credible for a C‑suite audience, risk teams typically adopt explicit criteria, such as:

    • Forecast physical balance (deficit, roughly balanced, surplus).
    • Refining and processing concentration by jurisdiction.
    • Sensitivity to export controls, sanctions, and defence policies.
    • Substitution difficulty and switching time in core products.
    • Relevance to the organisation’s largest revenue lines or capital projects.

    The ranked list tends to appear early in the deck as a heatmap: rows as materials; columns as criteria; colour scale from green (manageable) to red (acutely constrained or highly politicised). This becomes the organising backbone for the rest of the briefing.

    3. Ten‑Slide, 20‑Minute Architecture: A Common Pattern

    Across mining, defence, and advanced manufacturing organisations, a recurring pattern emerges: a ten‑slide structure designed to fit roughly 15 minutes of presentation and 5 minutes of questions. Each slide carries a single message, supported by one primary visual and a handful of metrics.

    C‑suite briefing on strategic materials using a concise, data-driven slide deck.
    C‑suite briefing on strategic materials using a concise, data-driven slide deck.

    Slide 1 – Strategic Imperative

    The opening slide usually sets context in one sentence: for example, that “in 2026, metals function as instruments in the US‑China competition over AI and power infrastructure”. Data points often used here include:

    • China’s share of global refining – roughly 70% lithium, 50% copper, and close to 90% rare earths in various industry tallies.
    • Central bank gold accumulation as a signal of geopolitical hedging.
    • A headline copper deficit figure or supply shortfall band for 2026.

    This slide’s failure mode is turning into a generic macro overview with no linkage to the organisation’s assets and contracts. The more it references named facilities, programs, or product lines, the more it anchors subsequent risk discussion.

    Slide 2 – Ranked Material Criticality

    Here, the ranking outlined earlier is translated into a compact table. Copper, rare earths, silver, gold, lithium, and aluminum often appear on a single slide with three columns:

    • 2026 physical balance (deficit/surplus/uncertain).
    • Geopolitical leverage (share of processing in high‑risk jurisdictions; presence of export controls).
    • Enterprise exposure (high/medium/low, referencing revenue or critical projects).

    Some teams add example metrics in footnotes: a cited copper “price floor” around USD 11,400 per metric ton in certain investment bank scenarios, or silver all‑in sustaining costs of approximately USD 23.44 per ounce globally, with lower averages reported in Mexico. The briefing benefit is less about the exact figures and more about the directional signal: structural strain, not a transient spike.

    Slides 3–6 – Deep Dives on Priority Materials

    Typically, the next four slides each focus on one material or tight cluster.

    • Copper – Data center power demand, grid investment, and defence electrification are linked to refined copper requirements. International Copper Study Group forecasts, where used, are summarised visually. Many teams also highlight the observed substitution of aluminum in lower‑criticality wiring after past price spikes, and the lead times reported for new long‑term supply arrangements.
    • Rare earths – Slides often show a pie chart of China’s processing dominance and a simple timeline: Chinese export controls; US Department of Defense equity and offtake support for MP Materials (whose nameplate capacity is frequently cited around 40,000 metric tons of rare earth oxide per year); and anticipated non‑Chinese projects. The term “policy bull market” is sometimes used to describe how prices decouple from traditional supply‑demand fundamentals.
    • Silver – Common elements include consecutive years of market deficit, the proportion of demand from photovoltaics and electronics, and its status as a by‑product metal. All‑in sustaining cost curves help illustrate how marginal supply might respond, but the key message tends to be that silver availability is constrained by base metal project decisions.
    • Gold and PGMs – For gold, the focus is on its dual role as reserve asset and financial collateral; central bank buying and regulatory frameworks (such as Basel III) get airtime. For PGMs, especially platinum and palladium, teams usually stress exposure in catalysts, aerospace alloys, and emerging hydrogen technologies, alongside cost pressures on South African and Russian supply.

    Each of these slides gains impact when it explicitly connects the material to specific plants, product platforms, or customer contracts rather than staying at an abstract commodity level.

    Slide 7 – Key Projects and Jurisdictions

    Executives often react more strongly to named mines, smelters, and refineries than to anonymous tonnage. A typical slide ranks critical projects by both importance and friction. Examples frequently seen in 2026‑oriented decks include:

    Global strategic materials supply chains and risk by region.
    Global strategic materials supply chains and risk by region.
    • US rare earth processing and magnet plants such as MP Materials’ Mountain Pass complex, anchored by US government support.
    • Australian copper and gold projects, viewed as geopolitically stable but regulatory‑intensive.
    • Ghana, Peru, or Mexico as key jurisdictions for gold, copper, and silver, each with their own logistics and community‑relations risks.
    • Indonesian aluminum and nickel projects with heavy Chinese investment, often flagged for potential sanctions or policy volatility.
    • African lithium projects that have contributed to a reported lithium carbonate price near USD 9,100 per ton in some recent analyses, but whose concentrate frequently travels to Chinese refiners.

    This slide helps the C‑suite map the organisation’s exposure to individual political systems and regulatory environments, rather than to abstract “regions”.

    Slide 8 – Policy and Regulation Timeline

    Policy often moves faster than mine development. High‑impact briefings therefore track a tight timeline of:

    • Export controls and quotas on rare earths and other strategic inputs from China and other jurisdictions.
    • US and allied critical minerals strategies, such as a 2026 Critical Minerals Ministerial and downstream implementation actions.
    • Tariffs on copper, aluminum, and battery materials.
    • ESG‑driven permitting changes that could affect project timing in North America, Europe, and Australia.

    Executives often use this slide to understand when key “policy cliffs” intersect with project milestone schedules or procurement renewals.

    Slide 9 – Risk Matrix and Tradeoffs

    After the material‑by‑material deep dives, risk teams frequently consolidate everything into a matrix that crosses probability and impact with specific risk manifestations. For example:

    • Copper allocation shortfalls delaying data center or grid projects.
    • Rare earth magnet disruptions affecting defence or aerospace deliveries.
    • Silver tightness impacting photovoltaic or sensor production.
    • Policy shocks (sanctions, export licences) forcing rapid supplier changes.

    On the same slide, observed mitigation levers are often summarised: stockpiling, long‑term offtakes, supplier diversification into allied jurisdictions, design changes, and recycling or substitution initiatives. Rather than promoting a single path, this matrix clarifies the trade space: which combinations of levers are even feasible within foreseeable timelines.

    Slide 10 – Decision Points and Implementation Risks

    The final slide generally concentrates on a small set of clearly framed decisions or “asks”: authorisation for stockpile ranges, green‑lighting diversification audits, supporting qualification of new jurisdictions, or approving design change studies. The most useful versions also surface implementation risks:

    • Lead times for new supplier qualification and contract negotiation.
    • Balance‑sheet and working‑capital implications of larger inventories.
    • Compliance checks, including sanctions screening and ESG standards.
    • Internal coordination challenges between procurement, engineering, and operations.

    A recurrent failure mode here is vagueness: a long narrative around metals markets with no explicit choices or thresholds. Successful briefings typically make the tradeoffs visible even when final decisions are left open.

    Structured framework for briefing the C‑suite on material criticality, policy timelines, and risk tradeoffs.
    Structured framework for briefing the C‑suite on material criticality, policy timelines, and risk tradeoffs.

    4. Evidence, Metrics, and Signals to Maintain Credibility

    C‑suite audiences tend to scrutinise the origin and robustness of strategic materials data. Risk teams that brief regularly on this topic often maintain a curated evidence pack, combining:

    • Official statistics (for example, USGS critical minerals data, International Energy Agency outlooks).
    • Industry association reports and cost curves for copper, lithium, and silver.
    • Forecasts from well‑known banks or consultancies, clearly labelled as scenarios rather than certainties.
    • Company disclosures on key projects (capacity figures like MP Materials’ ~40,000 metric tons of REO per year, commissioning dates for mines, refinery expansions).
    • Policy documents and press releases regarding export controls, tariffs, and strategic stockpile moves.

    Maintaining clear footnotes and differentiating between historical data and forward‑looking estimates is a practical defence against challenges from finance or legal teams. In several organisations, internal legal or compliance functions pre‑review these decks to ensure alignment with disclosure standards and sanctions guidance.

    5. Common Failure Modes in C‑Suite Materials Briefings

    Observed across multiple companies, several patterns reduce the impact of these 20‑minute sessions:

    • Price obsession – Focusing the narrative around spot prices or short‑term forecasts, rather than structural supply, refining chokepoints, and policy leverage.
    • Overloaded slides – Fifteen data points and three charts per slide, which inhibits executive synthesis; most high‑performing decks stick to one visual and a few metrics per slide.
    • No link to enterprise exposure – Explaining global deficits in the abstract without tying them to specific plants, programs, or contracts.
    • Ignoring refining and midstream risk – Discussing mines and projects in isolation, while real vulnerabilities sit in smelting, refining, and component manufacturing.
    • Underplaying implementation friction – Presenting diversification, stockpiling, or substitution as quick fixes, without acknowledging lead times, ESG reviews, and internal change management.

    Awareness of these failure modes informs both deck design and rehearsal. Many teams run pilot sessions with a cross‑functional audience (procurement, engineering, risk, sustainability) before stepping into the boardroom, to test clarity and relevance.

    6. Summary: Using the 20‑Minute Window as a Risk Lever

    Strategic materials have moved from background commodities to foreground risk factors, especially under a 2026 horizon where copper deficits, policy‑driven rare earth markets, and continued central bank gold accumulation are widely discussed. The limited time available with a C‑suite places a premium on structure and clarity.

    A ten‑slide, 20‑minute architecture centred on ranked material criticality, jurisdictional exposure, policy timelines, and explicit tradeoffs has emerged as a practical format in many organisations. Within that structure, the briefing becomes less about forecasting prices and more about mapping where disruptions could stall projects, where reliance on a single jurisdiction or processor is acute, and which mitigation levers are realistically available.

    Handled this way, the strategic materials briefing operates as a consistent risk‑governance tool: revisited periodically as forecasts, policies, and project pipelines evolve, and used to align operational, procurement, and finance teams around a shared view of exposure and resilience.