Blog

  • How to brief your c‑suite on strategic materials in 20 minutes

    How to brief your c‑suite on strategic materials in 20 minutes

    How to Brief a C‑Suite on Strategic Materials in 20 Minutes: Framework and Failure Modes

    C‑suite attention on strategic materials has shifted from price cycles to security of supply. Copper deficits linked to AI and electrification, policy‑driven rare earth markets, and central bank gold buying have turned metals into explicit risk topics in board discussions. In many organisations, the only available window to raise these themes is a tightly constrained 20‑minute briefing slot.

    Teams that handle this effectively tend to approach the briefing as a structured risk exercise rather than a market tour: ranking materials by criticality, tying them directly to assets and projects, and using a compact slide deck that surfaces tradeoffs and decision points without drowning executives in data.

    • Tradeoffs / attention points: security of supply vs. premium for diversification; China‑centric refining vs. jurisdictional and ESG constraints; short‑term stockpiles vs. longer‑term substitution and redesign.
    • Risks and failure modes: over‑focusing on prices; underestimating refining chokepoints; ignoring policy timelines; presenting a “tour of metals” with no clear linkage to enterprise risk.
    • Indicators / signals to watch: refined copper deficit updates; export‑control announcements on rare earths; central bank gold purchases; commissioning progress at non‑Chinese projects such as MP Materials; changes in all‑in sustaining costs for silver and other co‑products.

    1. Define the Briefing’s Scope Around Decisions, Not Markets

    In practice, the most effective 20‑minute briefings are built backwards from the decisions executives are likely to face in the next 12‑18 months. In strategic materials, those decisions often cluster around three axes:

    • Buffers and stockpiles – for example, whether to hold additional inventories of copper or rare earth magnet materials to cover project pipelines.
    • Supply diversification – whether to qualify alternative smelters, refiners, or jurisdictions beyond China, even where this implies a premium or higher operating complexity.
    • Product and technology choices – whether to accept redesigns that shift from copper to aluminum, from high‑dysprosium magnets to alternative formulations, or from primary silver to recycled content.

    Clarifying in advance which of these decisions need executive attention influences slide order and depth. For example, a board focused on data center build‑outs reacts most strongly to copper and silver risks, while a defence‑exposed OEM tends to engage more with rare earths and PGMs (platinum group metals).

    Another framing choice that changes the briefing’s character is whether it is primarily diagnostic (mapping exposures and vulnerabilities) or propositional (laying out distinct risk‑mitigation paths with tradeoffs and timing). Diagnostic briefings often emphasise heatmaps and exposure analytics; propositional briefings allocate more time to scenarios and “if‑then” implications.

    2. Rank Materials by 2026 Strategic Criticality

    A 20‑minute slot does not accommodate detailed treatment of every metal. Teams therefore commonly create a ranked list of 4–6 “headline” materials based on a consistent set of criteria, and orient the deck around that list. A pattern often seen in 2024–2026 briefings is:

    • Copper – Forecast refined deficit around 2026; one widely cited estimate is a shortfall of roughly 150,000 metric tons, driven by AI data centers, grid upgrades, and electrification.
    • Rare earths – Approximately 90% of refining and magnet production concentrated in China; export controls and long‑term US Department of Defense offtakes (for example with MP Materials) create a policy‑driven, rather than purely demand‑driven, market.
    • Silver – Multiple years of reported physical deficit, with photovoltaic demand and electrification drawing down inventories; many mines produce silver as a by‑product of copper or lead‑zinc, limiting supply responsiveness.
    • Gold – Central banks have been reported to purchase on the order of 70 tonnes per month on average post‑2022, turning gold into a visible geopolitical reserve tool.
    • Lithium and aluminum – Headlines often describe these as oversupplied, yet refining and smelting remain heavily China‑centric (various analyses place lithium refining around 70% in China, and copper refining near 50%), creating potential chokepoints despite apparent upstream abundance.

    To keep this ranking credible for a C‑suite audience, risk teams typically adopt explicit criteria, such as:

    • Forecast physical balance (deficit, roughly balanced, surplus).
    • Refining and processing concentration by jurisdiction.
    • Sensitivity to export controls, sanctions, and defence policies.
    • Substitution difficulty and switching time in core products.
    • Relevance to the organisation’s largest revenue lines or capital projects.

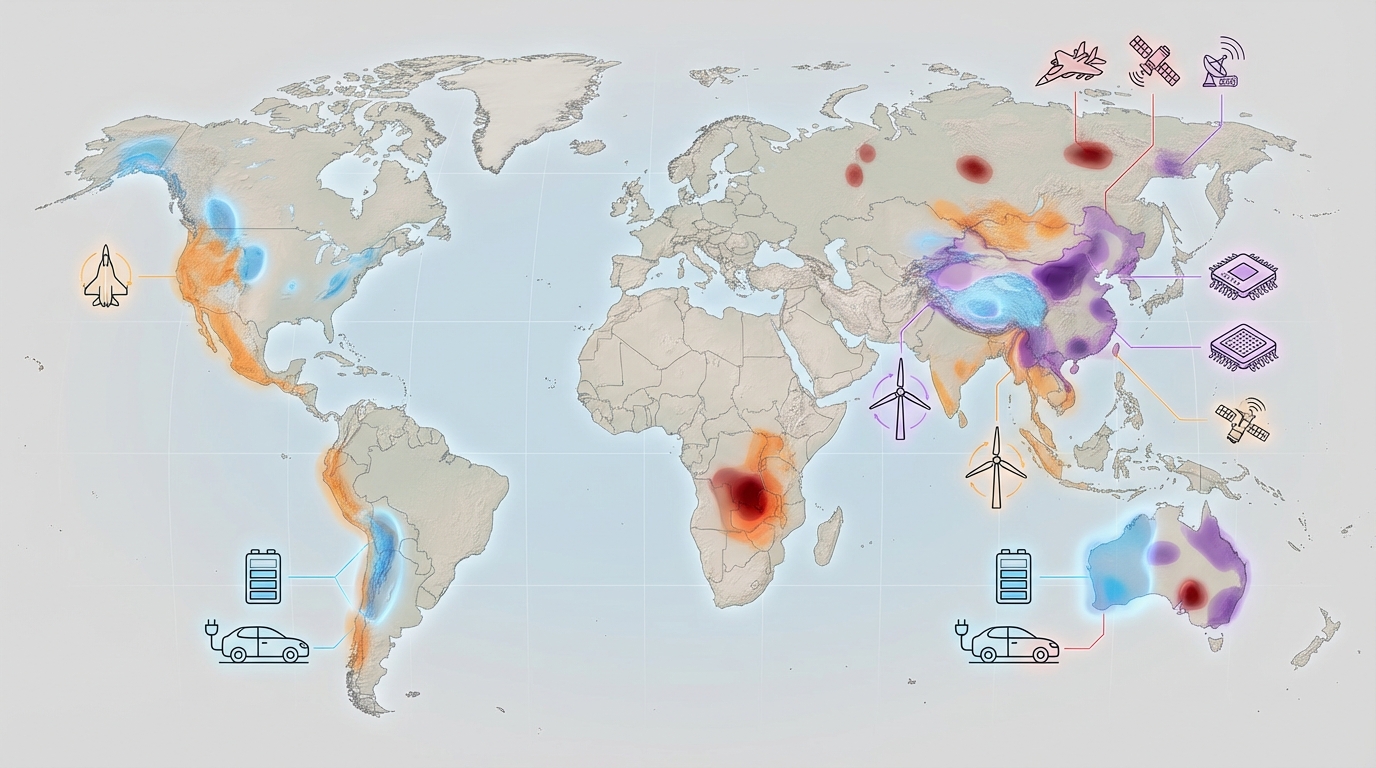
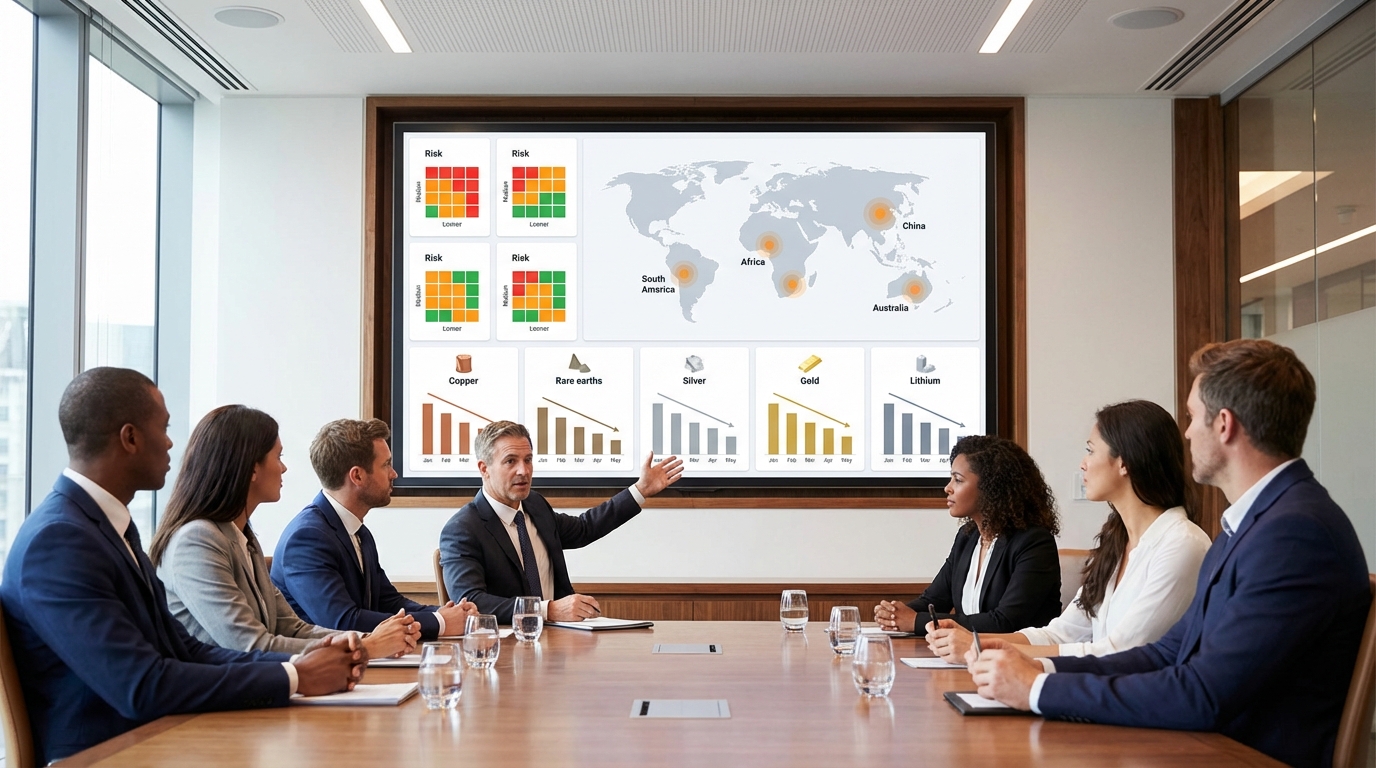
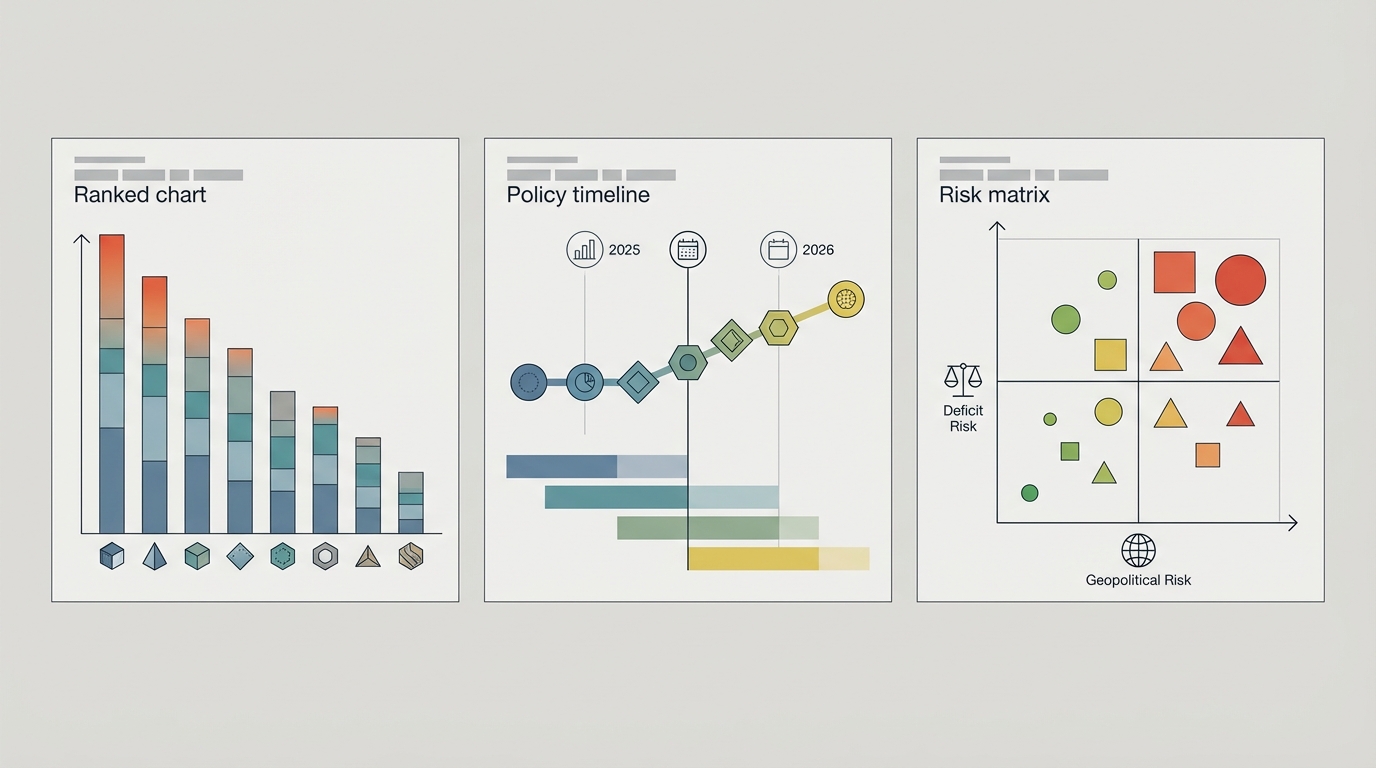
    The ranked list tends to appear early in the deck as a heatmap: rows as materials; columns as criteria; colour scale from green (manageable) to red (acutely constrained or highly politicised). This becomes the organising backbone for the rest of the briefing.

    3. Ten‑Slide, 20‑Minute Architecture: A Common Pattern

    Across mining, defence, and advanced manufacturing organisations, a recurring pattern emerges: a ten‑slide structure designed to fit roughly 15 minutes of presentation and 5 minutes of questions. Each slide carries a single message, supported by one primary visual and a handful of metrics.

    C‑suite briefing on strategic materials using a concise, data-driven slide deck.
    C‑suite briefing on strategic materials using a concise, data-driven slide deck.

    Slide 1 – Strategic Imperative

    The opening slide usually sets context in one sentence: for example, that “in 2026, metals function as instruments in the US‑China competition over AI and power infrastructure”. Data points often used here include:

    • China’s share of global refining – roughly 70% lithium, 50% copper, and close to 90% rare earths in various industry tallies.
    • Central bank gold accumulation as a signal of geopolitical hedging.
    • A headline copper deficit figure or supply shortfall band for 2026.

    This slide’s failure mode is turning into a generic macro overview with no linkage to the organisation’s assets and contracts. The more it references named facilities, programs, or product lines, the more it anchors subsequent risk discussion.

    Slide 2 – Ranked Material Criticality

    Here, the ranking outlined earlier is translated into a compact table. Copper, rare earths, silver, gold, lithium, and aluminum often appear on a single slide with three columns:

    • 2026 physical balance (deficit/surplus/uncertain).
    • Geopolitical leverage (share of processing in high‑risk jurisdictions; presence of export controls).
    • Enterprise exposure (high/medium/low, referencing revenue or critical projects).

    Some teams add example metrics in footnotes: a cited copper “price floor” around USD 11,400 per metric ton in certain investment bank scenarios, or silver all‑in sustaining costs of approximately USD 23.44 per ounce globally, with lower averages reported in Mexico. The briefing benefit is less about the exact figures and more about the directional signal: structural strain, not a transient spike.

    Slides 3–6 – Deep Dives on Priority Materials

    Typically, the next four slides each focus on one material or tight cluster.

    • Copper – Data center power demand, grid investment, and defence electrification are linked to refined copper requirements. International Copper Study Group forecasts, where used, are summarised visually. Many teams also highlight the observed substitution of aluminum in lower‑criticality wiring after past price spikes, and the lead times reported for new long‑term supply arrangements.
    • Rare earths – Slides often show a pie chart of China’s processing dominance and a simple timeline: Chinese export controls; US Department of Defense equity and offtake support for MP Materials (whose nameplate capacity is frequently cited around 40,000 metric tons of rare earth oxide per year); and anticipated non‑Chinese projects. The term “policy bull market” is sometimes used to describe how prices decouple from traditional supply‑demand fundamentals.
    • Silver – Common elements include consecutive years of market deficit, the proportion of demand from photovoltaics and electronics, and its status as a by‑product metal. All‑in sustaining cost curves help illustrate how marginal supply might respond, but the key message tends to be that silver availability is constrained by base metal project decisions.
    • Gold and PGMs – For gold, the focus is on its dual role as reserve asset and financial collateral; central bank buying and regulatory frameworks (such as Basel III) get airtime. For PGMs, especially platinum and palladium, teams usually stress exposure in catalysts, aerospace alloys, and emerging hydrogen technologies, alongside cost pressures on South African and Russian supply.

    Each of these slides gains impact when it explicitly connects the material to specific plants, product platforms, or customer contracts rather than staying at an abstract commodity level.

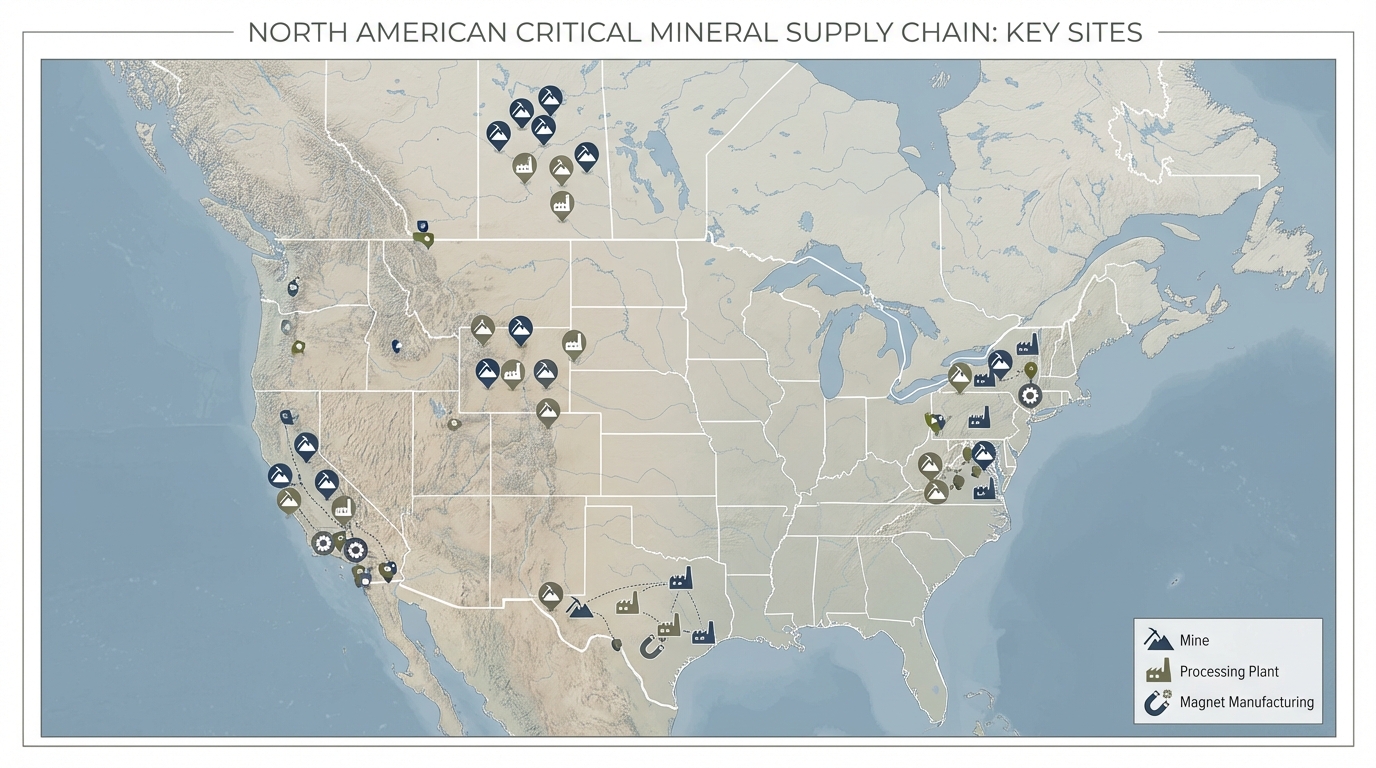
    Slide 7 – Key Projects and Jurisdictions

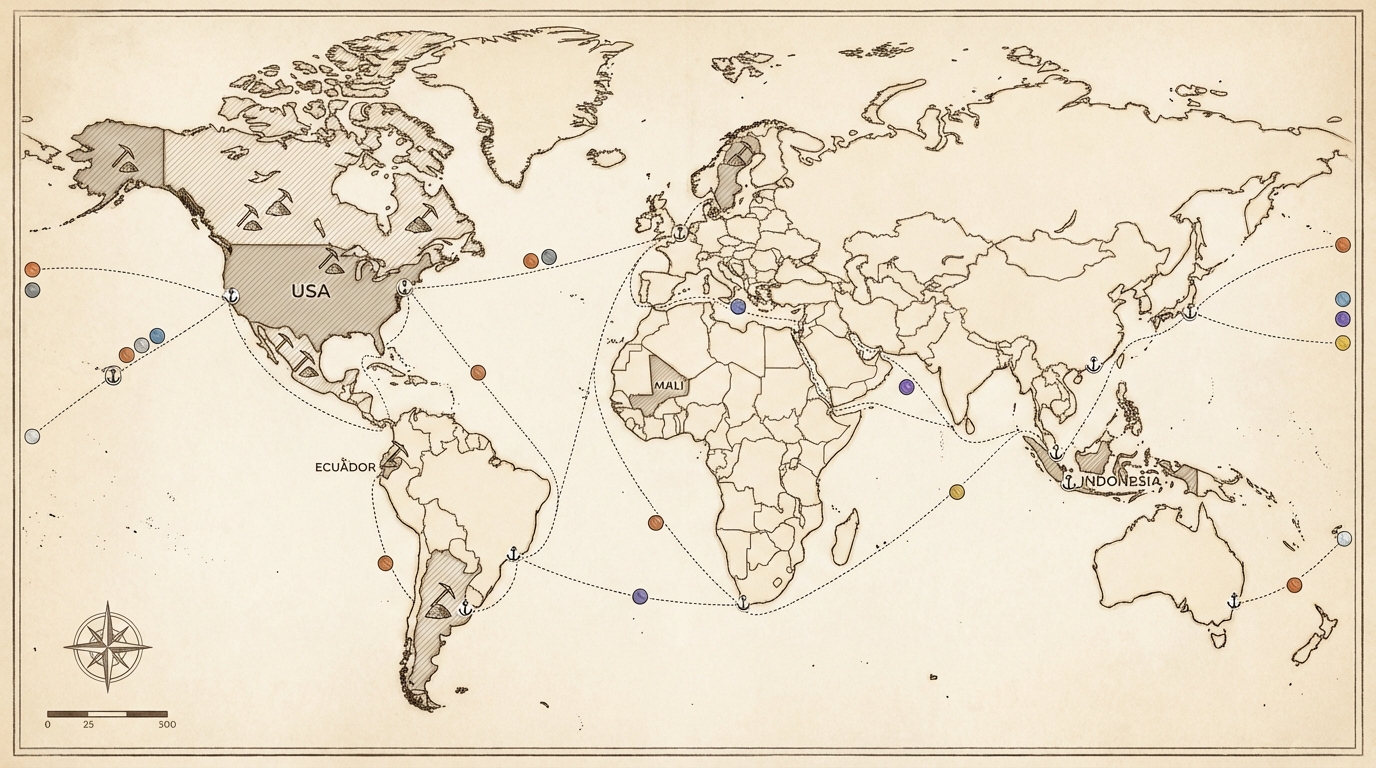
    Executives often react more strongly to named mines, smelters, and refineries than to anonymous tonnage. A typical slide ranks critical projects by both importance and friction. Examples frequently seen in 2026‑oriented decks include:

    Global strategic materials supply chains and risk by region.
    Global strategic materials supply chains and risk by region.
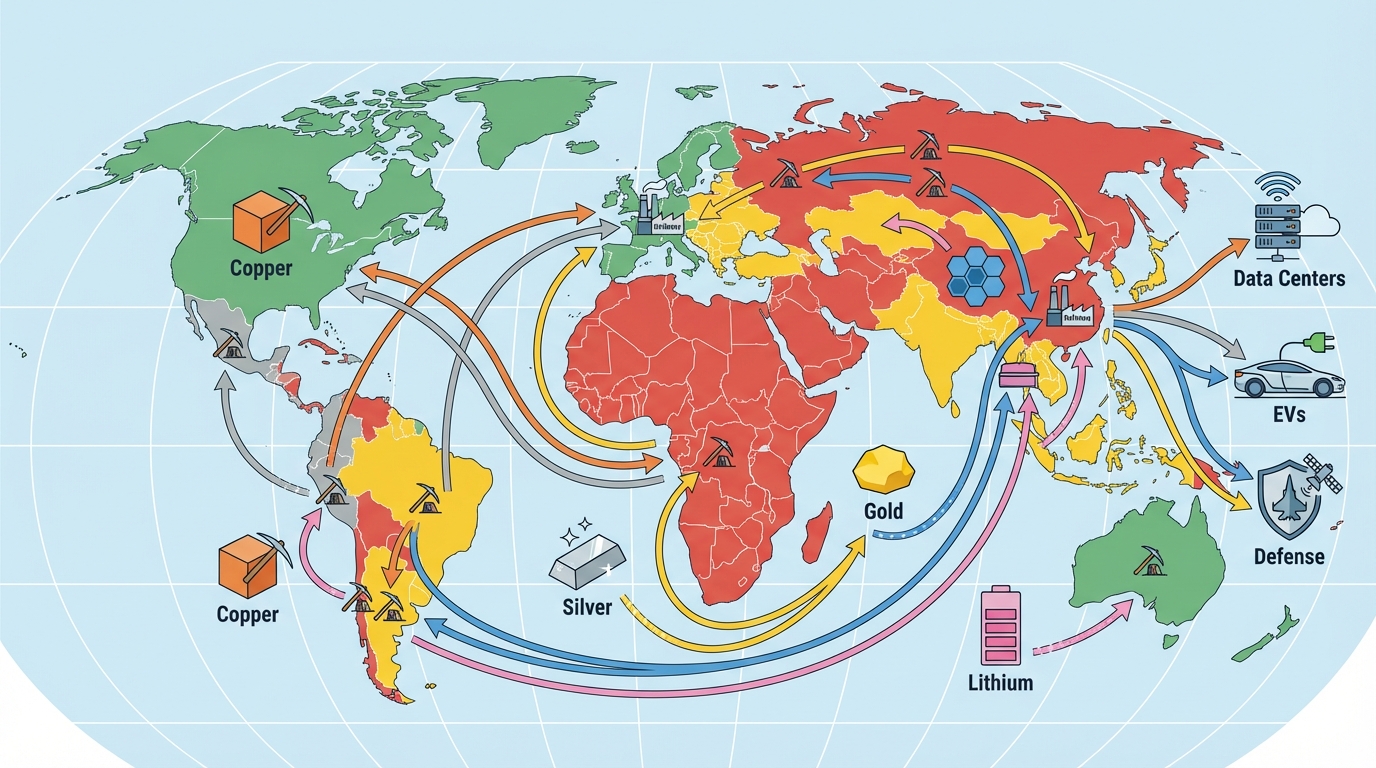
    • US rare earth processing and magnet plants such as MP Materials’ Mountain Pass complex, anchored by US government support.
    • Australian copper and gold projects, viewed as geopolitically stable but regulatory‑intensive.
    • Ghana, Peru, or Mexico as key jurisdictions for gold, copper, and silver, each with their own logistics and community‑relations risks.
    • Indonesian aluminum and nickel projects with heavy Chinese investment, often flagged for potential sanctions or policy volatility.
    • African lithium projects that have contributed to a reported lithium carbonate price near USD 9,100 per ton in some recent analyses, but whose concentrate frequently travels to Chinese refiners.

    This slide helps the C‑suite map the organisation’s exposure to individual political systems and regulatory environments, rather than to abstract “regions”.

    Slide 8 – Policy and Regulation Timeline

    Policy often moves faster than mine development. High‑impact briefings therefore track a tight timeline of:

    • Export controls and quotas on rare earths and other strategic inputs from China and other jurisdictions.
    • US and allied critical minerals strategies, such as a 2026 Critical Minerals Ministerial and downstream implementation actions.
    • Tariffs on copper, aluminum, and battery materials.
    • ESG‑driven permitting changes that could affect project timing in North America, Europe, and Australia.

    Executives often use this slide to understand when key “policy cliffs” intersect with project milestone schedules or procurement renewals.

    Slide 9 – Risk Matrix and Tradeoffs

    After the material‑by‑material deep dives, risk teams frequently consolidate everything into a matrix that crosses probability and impact with specific risk manifestations. For example:

    • Copper allocation shortfalls delaying data center or grid projects.
    • Rare earth magnet disruptions affecting defence or aerospace deliveries.
    • Silver tightness impacting photovoltaic or sensor production.
    • Policy shocks (sanctions, export licences) forcing rapid supplier changes.

    On the same slide, observed mitigation levers are often summarised: stockpiling, long‑term offtakes, supplier diversification into allied jurisdictions, design changes, and recycling or substitution initiatives. Rather than promoting a single path, this matrix clarifies the trade space: which combinations of levers are even feasible within foreseeable timelines.

    Slide 10 – Decision Points and Implementation Risks

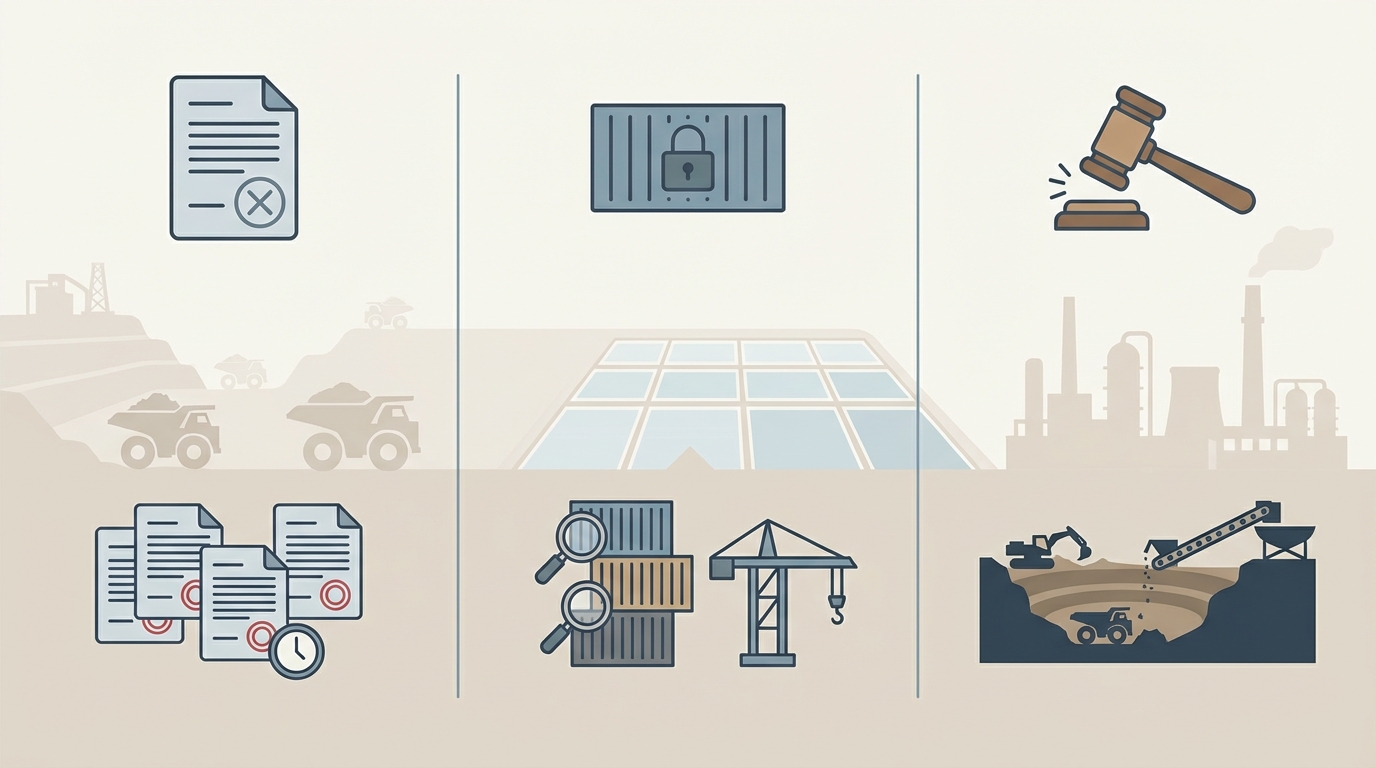
    The final slide generally concentrates on a small set of clearly framed decisions or “asks”: authorisation for stockpile ranges, green‑lighting diversification audits, supporting qualification of new jurisdictions, or approving design change studies. The most useful versions also surface implementation risks:

    • Lead times for new supplier qualification and contract negotiation.
    • Balance‑sheet and working‑capital implications of larger inventories.
    • Compliance checks, including sanctions screening and ESG standards.
    • Internal coordination challenges between procurement, engineering, and operations.

    A recurrent failure mode here is vagueness: a long narrative around metals markets with no explicit choices or thresholds. Successful briefings typically make the tradeoffs visible even when final decisions are left open.

    Structured framework for briefing the C‑suite on material criticality, policy timelines, and risk tradeoffs.
    Structured framework for briefing the C‑suite on material criticality, policy timelines, and risk tradeoffs.

    4. Evidence, Metrics, and Signals to Maintain Credibility

    C‑suite audiences tend to scrutinise the origin and robustness of strategic materials data. Risk teams that brief regularly on this topic often maintain a curated evidence pack, combining:

    • Official statistics (for example, USGS critical minerals data, International Energy Agency outlooks).
    • Industry association reports and cost curves for copper, lithium, and silver.
    • Forecasts from well‑known banks or consultancies, clearly labelled as scenarios rather than certainties.
    • Company disclosures on key projects (capacity figures like MP Materials’ ~40,000 metric tons of REO per year, commissioning dates for mines, refinery expansions).
    • Policy documents and press releases regarding export controls, tariffs, and strategic stockpile moves.

    Maintaining clear footnotes and differentiating between historical data and forward‑looking estimates is a practical defence against challenges from finance or legal teams. In several organisations, internal legal or compliance functions pre‑review these decks to ensure alignment with disclosure standards and sanctions guidance.

    5. Common Failure Modes in C‑Suite Materials Briefings

    Observed across multiple companies, several patterns reduce the impact of these 20‑minute sessions:

    • Price obsession – Focusing the narrative around spot prices or short‑term forecasts, rather than structural supply, refining chokepoints, and policy leverage.
    • Overloaded slides – Fifteen data points and three charts per slide, which inhibits executive synthesis; most high‑performing decks stick to one visual and a few metrics per slide.
    • No link to enterprise exposure – Explaining global deficits in the abstract without tying them to specific plants, programs, or contracts.
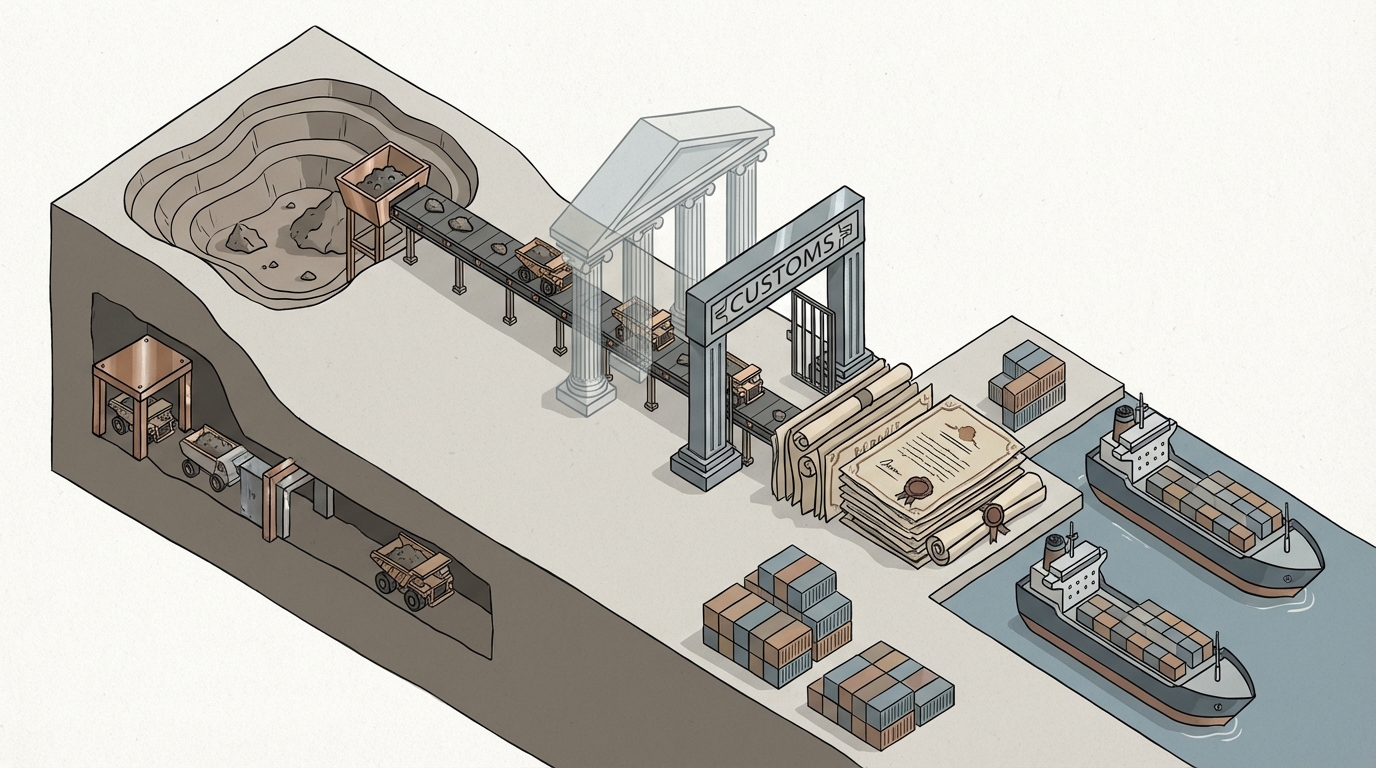
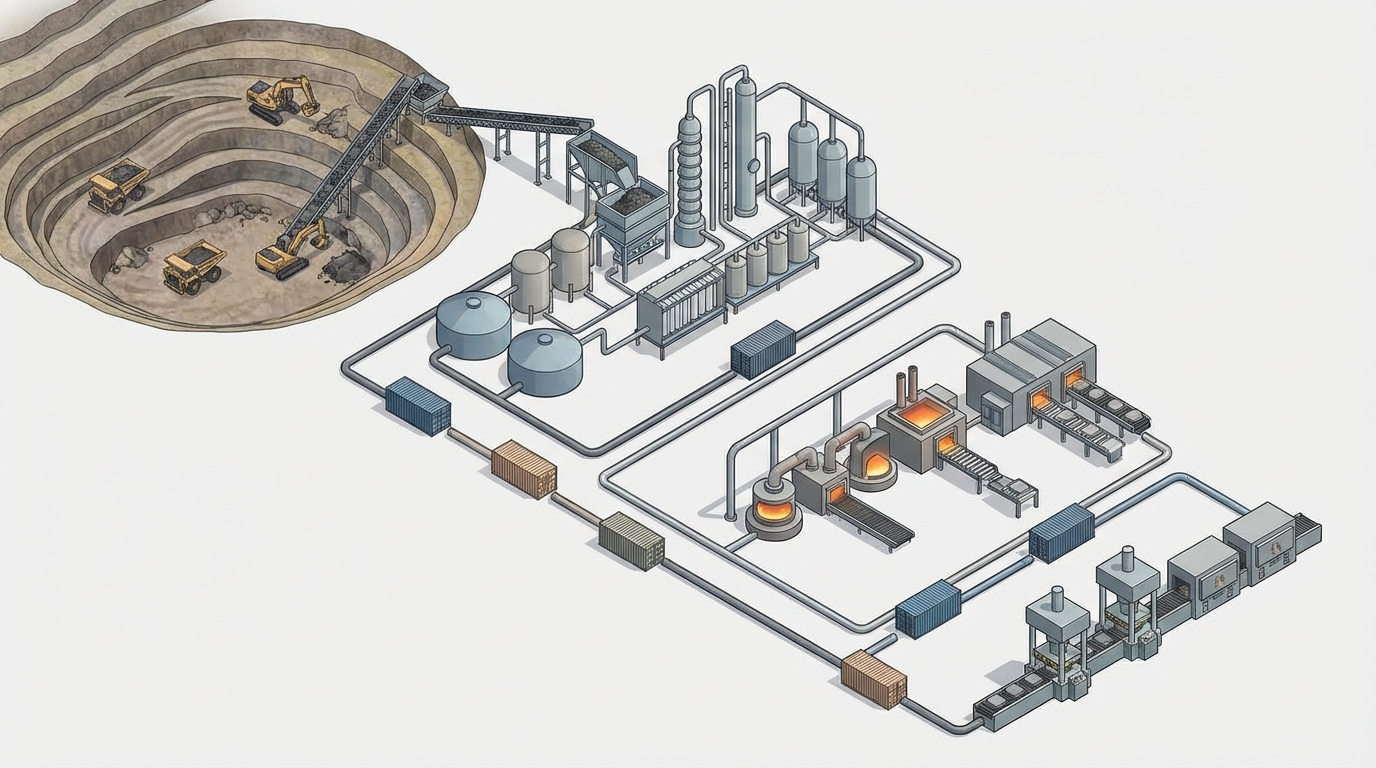
    • Ignoring refining and midstream risk – Discussing mines and projects in isolation, while real vulnerabilities sit in smelting, refining, and component manufacturing.
    • Underplaying implementation friction – Presenting diversification, stockpiling, or substitution as quick fixes, without acknowledging lead times, ESG reviews, and internal change management.

    Awareness of these failure modes informs both deck design and rehearsal. Many teams run pilot sessions with a cross‑functional audience (procurement, engineering, risk, sustainability) before stepping into the boardroom, to test clarity and relevance.

    6. Summary: Using the 20‑Minute Window as a Risk Lever

    Strategic materials have moved from background commodities to foreground risk factors, especially under a 2026 horizon where copper deficits, policy‑driven rare earth markets, and continued central bank gold accumulation are widely discussed. The limited time available with a C‑suite places a premium on structure and clarity.

    A ten‑slide, 20‑minute architecture centred on ranked material criticality, jurisdictional exposure, policy timelines, and explicit tradeoffs has emerged as a practical format in many organisations. Within that structure, the briefing becomes less about forecasting prices and more about mapping where disruptions could stall projects, where reliance on a single jurisdiction or processor is acute, and which mitigation levers are realistically available.

    Handled this way, the strategic materials briefing operates as a consistent risk‑governance tool: revisited periodically as forecasts, policies, and project pipelines evolve, and used to align operational, procurement, and finance teams around a shared view of exposure and resilience.

  • Weekly dispatch #7: licensing backlogs, customs seizures, and court rulings

    Weekly dispatch #7: licensing backlogs, customs seizures, and court rulings

    Executive summary

    • Licensing backlogs and regulatory reopenings are reshaping supply timelines: Mexico inherited 176 stalled projects, resolved 110, with 66 remaining; Ecuador reopens a seven-year registry with 3-8% royalties-both actions shift commissioning windows into mid‑2026 and beyond.
    • Customs enforcement is intensifying in West Africa, Argentina and transshipment hubs, lengthening lead times and increasing provenance requirements; Mali restructuring followed a 23% drop in industrial gold output in 2025.
    • Court rulings and litigation are altering project trajectories: a US judicial outcome affecting Twin Metals alters domestic nickel/copper prospects (500,000+ MT/year potential stated), while remediation and legal challenges delay Grasberg and Red Dog outputs into 2026-2027.
    • Immediate risks include 6-18 month sourcing delays, compressed refined availability for battery/defense metals, and heightened customs seizure exposure tied to provenance and permit clarity; signals to watch include permit clearances mid‑2026, customs seizure reports, and appellate timelines.

    Legal-administrative developments are materially tightening physical flows of strategic and precious metals ahead of mid‑2026. Licensing backlogs, an uptick in customs seizures and decisive court rulings are converging to create multi‑quarter sourcing delays for nickel, copper, cobalt, lithium, gold and silver, with governance and compliance becoming primary determinants of near‑term availability.

    Permitting backlogs: project timing and supply risk

    Licensing remains the primary chokepoint for new supply. Mexico’s transition left 176 stalled projects; authorities have resolved 110 via accelerated environmental and water approvals while 66 remain targeted for mid‑2026 clearance, unlocking an estimated US$11 billion pipeline for metallic minerals. Ecuador’s full registry reopening after seven years, together with 3–8% royalties for medium/large metallic operations and stricter tailings/emissions scrutiny, pushes first outputs toward Q3 2026. Canada’s feasibility‑stage critical minerals projects face financing and infrastructure gaps that extend delivery horizons into 2028 for some nickel and cobalt prospects.

    Operationally, market analysis shows brownfield and restart pathways gain priority over greenfield developments because they compress lead times; however, interim concentrate shortages are triggering rerouted logistics and elevated freight exposure as processors and smelters chase limited material.

    Global hotspots where licensing backlogs, customs seizures, and court rulings are reshaping metal supply chains.
    Global hotspots where licensing backlogs, customs seizures, and court rulings are reshaping metal supply chains.

    Customs seizures and trade enforcement: provenance as a supply constraint

    Enforcement actions are emerging as a de facto supply control. Mali’s institutional restructuring and prior fiscal recoveries correlate with heightened customs scrutiny and seizure activity on gold exports, a dynamic that trimmed industrial gold output in 2025 and extended lead times for West African flows into Europe. Argentina’s brine sector is operating under hyperinflationary cost pressure-reported AISC of $7,223/t LCE-and customs friction has increased transactional risk for lithium concentrates and associated precursors.

    In parallel, US agency moves to streamline reviews for deep‑sea nodule activities create mixed signals: faster administrative processing for exploration does not equate to safe import pathways, and gaps between domestic fast‑tracking and International Seabed Authority governance raise seizure or detention risk for unaligned cargoes.

    Visual metaphor of how permitting delays, customs enforcement, and court decisions create chokepoints in the metals supply chain.
    Visual metaphor of how permitting delays, customs enforcement, and court decisions create chokepoints in the metals supply chain.

    Court rulings: legal outcomes that reshape supply curves

    Judicial decisions are reshaping availability by either unlocking or delaying large projects. A US ruling altering prior restrictions on the Duluth Complex (Twin Metals) shifts the domestic nickel/copper narrative with cited development potential above 500,000 MT/year post‑ramp, yet environmental re‑approvals and appeals extend practical restart timelines into 2027. Indonesia’s Grasberg mine and Alaska’s Red Dog operations face court‑mandated remediation and indigenous claims that reduce near‑term copper, zinc and byproduct silver output, keeping secondary supply thin while fixed costs are absorbed over lower production.

    Market implications and operational tradeoffs

    The intersecting legal signals reframe sourcing tradeoffs for defense, battery and industrial users. Jurisdictions that clear backlogs (Mexico, Ecuador) present nearer‑term supply restoration but carry royalty and compliance layers. Regions with heightened seizure risk (parts of West Africa, complex transshipment hubs) are generating longer lead times and heavier documentation requirements. Deep‑sea nodules and restarts in the Americas are visible hedges in market narratives, though governance mismatches leave legal exposure.

    The three main legal-administrative forces reshaping 2026 metals availability.
    The three main legal-administrative forces reshaping 2026 metals availability.

    Signals to watch

    • Permit clearance progress and water/tailings approvals in Mexico and Ecuador through mid‑2026.
    • Customs seizure and provenance enforcement reports from Mali, Argentina and major European ports.
    • Court docket updates and appellate timelines for Twin Metals, Grasberg remediation and indigenous land claims affecting Red Dog.
    • NOAA and ISA alignment on deep‑sea governance and any port detention cases involving polymetallic cargoes.

    Materials Dispatch Signal

    Regulatory and judicial processes are now primary drivers of short‑term metal availability. The calendar through mid‑2026 will determine whether supply gaps widen into sustained structural tightness or whether administrative clearances alleviate pressure. Market participants are increasingly treating permit and customs clarity as equivalent to physical tonnage when assessing operational resilience and allocation of processing capacity.

  • Q2 2026 Early‑Warning Map: Critical Minerals Hotspots by Material, Country, and Sector

    Q2 2026 Early‑Warning Map: Critical Minerals Hotspots by Material, Country, and Sector

    Q2 2026 opens with simultaneous stress across heavy rare earths, lithium, copper, and cobalt, driven by Chinese export controls, African licensing delays, and slow mine permitting, creating immediate and medium‑term risks for aerospace, semiconductors, EVs, and grid projects [1][4][5][6][19][23][24]. This report maps the most critical hotspots by material, geography, and sector, and sets out concrete actions and monitoring signals for procurement and supply‑chain leaders.

    Q2 2026 Early‑Warning Map: Critical Minerals Hotspots by Material, Country, and Sector

    Executive Summary

    Entering Q2 2026, four materials define the near‑term risk landscape: heavy rare earth elements (HREEs), lithium, copper, and cobalt. Chinese export controls have cut U.S. yttrium imports by ~95% (17 t vs 333 t in the comparable pre‑control period) and driven prices to roughly 69 times year‑ago levels, with a further 60% surge since November 2025 alone [4][23]. Lithium carbonate spot prices in China have rebounded 57% in five months, from $8,259/t (23 June 2025) to $13,003/t (26 November 2025), as the market pivots from oversupply to looming deficits [6]. Copper is on track for structural shortfalls as early as 2025-2026, with the International Energy Agency (IEA) and S&P Global warning that supply from operating and in‑construction mines will be insufficient without unprecedented new investment [1]. Cobalt flows remain hostage to licensing delays in the Democratic Republic of the Congo (DRC), which supplies over 97% of China’s cobalt intermediate imports [24].

    China’s 91% share of global rare earth refining and processing capacity in 2024 amplifies the impact of export controls that now cover all heavy rare earths, related equipment, and services, and that have been extended to ban exports of rare earths and magnets to Japan as of February 2026 [5][8]. This creates immediate hotspots in aerospace propulsion, turbine coatings, and advanced semiconductors, where yttrium and scandium are both functionally non‑substitutable and largely sourced via Chinese supply chains [4][5][8][23]. Lithium and copper constraints define the medium‑term risk for EV, grid, and renewable build‑outs through 2030 [1][6].

    Three priority actions for Q2 2026:

    • By end of April: Map HREE (yttrium, scandium, dysprosium, terbium) exposure down to Tier‑2/Tier‑3 suppliers in aerospace, turbine, and semiconductor value chains, focusing on Chinese licensing dependencies and Japanese magnet suppliers [4][5][8][23].
    • By mid‑May: Stress‑test lithium and cobalt sourcing under 6-12 month disruption scenarios from high‑risk jurisdictions (China, DRC), incorporating IEA/Benchmark deficit projections and DRC licensing bottlenecks [1][6][24].
    • By end of Q2: Restructure at least a portion of long‑term offtake/spot mix in lithium and cobalt toward non‑Chinese production where viable (Australia, Americas, emerging U.S. projects), and initiate qualification of alternative rare earth processors [6][8].

    Risk / Impact / Timing snapshot (Q2 2026-2028):

    These converging constraints demand that procurement leaders move from passive monitoring to active portfolio rebalancing, with particular urgency in HREEs, where geopolitical controls have already crossed from theoretical risk into realized supply shock [4][5][23].

    The Problem

    The core problem entering Q2 2026 is that multiple critical mineral systems are tightening simultaneously, but on different timeframes, while supply chains remain highly concentrated in a small set of politically exposed geographies.

    Immediate HREE choke points are already binding. Following China’s April 2025 export controls on heavy rare earths-initially covering yttrium, dysprosium, terbium, and related alloys under a stringent MOFCOM licensing regime with extraterritorial reach [5]-U.S. yttrium imports from China fell from 333 t in the eight months prior to controls to just 17 t in the subsequent eight months, a ~95% collapse [4][23]. Since Reuters first highlighted acute yttrium shortages in November 2025, prices have jumped another 60% and now trade at around 69 times their level a year earlier [4][23]. Coating manufacturers have begun rationing, with at least one supply‑chain firm reportedly exhausting reserves and halting sales of yttrium‑oxide‑containing products [4][23].

    Yttrium is functionally non‑substitutable in key aerospace and power applications: it is essential for thermal barrier coatings in jet engines and turbines that prevent high‑temperature components from melting [4][23]. Without these coatings, engines cannot be operated safely, so yttrium availability is a hard capacity constraint rather than a cost issue. Scandium, with annual global production only in the tens of tonnes, plays a similar role in high‑performance alloys and advanced semiconductor processes, yet the United States currently has no domestic production and no operational non‑Chinese alternative [4][23]. Stockpiles are thought to cover months, not years [4][23].

    Lithium presents the next‑wave constraint. After a period of oversupply in 2023–2024, with inventories of roughly 175,000 t and 154,000 t respectively [6], the IEA now expects lithium supply shortfalls to emerge by 2028 under baseline scenarios, with earlier deficits possible if new mines underperform [1]. Benchmark Mineral Intelligence projects a 12.5% supply deficit by 2030 [1]. Lithium carbonate prices in China have already rebounded 57% between June and November 2025 [6], signaling that the surplus phase is ending just as EV and grid‑storage demand accelerates [6]. Lead times of two to five years to restart or develop new mines mean the system has limited ability to react quickly [6].

    Copper is on a slower but larger‑scale collision course. The IEA and S&P Global estimate that copper demand will outpace supply from currently operating or under‑construction mines as early as 2025, and certainly by the second half of 2026 [1]. Meeting projected demand through the energy transition would require commissioning three large mines every year for the next 29 years at a cost exceeding $500 billion [1]-an investment and permitting challenge that the current project pipeline is not on track to meet. Industry leaders such as Roque Benavides of Compañía de Minas Buenaventura warn that “in five or six years’ time, there is not going to be enough copper in the world for the demand of copper,” citing bureaucratic permitting delays as a core obstacle [19].

    Cobalt adds a further layer of fragility. Over 97% of China’s cobalt intermediate imports originate in the DRC [24]. Although exports formally resumed on 16 October 2025, delays in issuing export licenses meant that no raw materials actually left the country through early December 2025 [24]. Weak arrivals into China are expected through Q1 2026, with a compressed surge in April–May and gradual normalization thereafter [24]. At the same time, China’s EV sector—16.49 million sales in 2025, up 28.2% year‑on‑year—is shifting battery chemistries toward lower‑cobalt formulations, depressing some cobalt salt production even as the system remains vulnerable to upstream disruptions [24].

    These dynamics matter because they converge on the same end‑use systems: aerospace engines and turbines, advanced semiconductors, EVs, and electricity networks. The combination of HREE export controls, a tightening lithium market, looming copper deficits, and highly concentrated cobalt supply chains constitutes a systemic risk to industrial and energy transition plans through the late 2020s [1][4][5][6][19][23][24].

    Current State

    The current state of play as Q2 2026 begins can be understood as a sequence of overlapping policy shocks, market adjustments, and structural constraints across different materials.

    Heavy Rare Earths: From Policy Shock to Physical Shortage

    April 2025 – Initial Chinese export controls. China’s Ministry of Commerce (MOFCOM) introduced export licensing for key heavy rare earths—yttrium, dysprosium, terbium, and certain alloys—under a regime that allows authorities to scrutinize end‑users and to apply controls extraterritorially, even when Chinese content is limited [5].

    April–November 2025 – Collapse in U.S. yttrium imports. In the eight months following the April controls, U.S. imports of yttrium products from China fell to 17 t, compared with 333 t in the equivalent pre‑control period, a ~95% decline [4][23]. During this time, U.S. and allied aerospace and coating suppliers began to draw down inventories and prioritize deliveries to top‑tier jet‑engine manufacturers, turning away smaller and international customers [4][23].

    October 2025 – Control system enlarged. In October 2025, China expanded its export controls to cover all seventeen heavy rare earth elements, associated production equipment, and certain extraction and refining services, creating a comprehensive export‑control architecture without precedent in commodity markets [5]. This widened the scope of potential chokepoints and increased uncertainty about future license approvals.

    November 2025–Q1 2026 – Price spike and rationing. After Reuters highlighted acute yttrium shortages in November 2025, prices surged another 60% and stabilized at approximately 69 times their levels a year earlier [4][23]. Coating manufacturers began rationing supplies, and at least one company reportedly exhausted its yttrium oxide reserves and suspended sales of affected products [4][23]. To date, production of jet engines and aircraft has not been formally curtailed, but this represents a precarious equilibrium reliant on finite stockpiles and aggressive allocation [4][23].

    Scandium tightening. The same period saw growing concern over scandium. Global production remains only in the tens of tonnes per year, and the U.S. has neither domestic production nor operational non‑Chinese sources [4][23]. Major U.S. chipmakers report that scandium‑based components enter “essentially every 5G smartphone and base station,” according to SemiAnalysis CEO Dylan Patel [4][23]. Chinese licensing delays for scandium exports have lengthened, with U.S. chipmakers seeking U.S. government support [4][23]. Available stockpiles are believed to cover months of demand, exposing advanced semiconductor packaging and certain fuel‑cell and aerospace alloy applications to medium‑term disruption risk [4][23].

    February 2026 – Controls extend to Japan. In February 2026, China announced changes to its dual‑use export control regime that effectively banned exports of rare earths, permanent magnets containing HREEs, and various dual‑use technologies to Japan, citing Japanese political statements on Taiwan as the rationale [5]. Given Japan’s critical role as one of the few non‑Chinese producers of rare earth permanent magnets, analysts have flagged this as a significant blow to diversification strategies [8]. It also signals Beijing’s willingness to use HREE dominance for overt geopolitical coercion, not just as a defensive hedge [5][8].

    Global hotspots for critical minerals supply chain risk in 2026 by material and sectoral exposure.
    Global hotspots for critical minerals supply chain risk in 2026 by material and sectoral exposure.

    China’s share of global rare earth refining and processing capacity—around 91% in 2024, compared with 61% of mined supply—means that even new mines in non‑Chinese jurisdictions continue to depend on Chinese processing in the absence of alternative refineries [8]. Efforts to build such capacity in countries including Japan, the United States, and Australia are underway but will take years to materially reduce dependence [8].

    Lithium: From Glut to Tightness

    2023–2024 – Oversupply and inventory build‑up. The lithium market entered 2023 with a significant surplus, reflected in estimated stock builds of around 175,000 t in 2023 and 154,000 t in 2024 [6]. This oversupply saw lithium carbonate prices fall sharply from 2022 peaks [6]. Producers responded by cutting output at higher‑cost operations, including some Chinese mines associated with CATL, which paused or reduced operations in 2025 [6].

    Mid‑2025 – Price floor and rebound. By 23 June 2025, Chinese lithium carbonate spot prices had declined to $8,259/t, but by 26 November 2025 they had rebounded to $13,003/t, a 57% increase over five months [6]. At this point, estimated global inventories reached around 350,000 t [6]. The rebound reflects renewed EV demand, the limitations of further supply cuts, and market recognition of impending structural deficits.

    2026 onward – Transition toward deficit. The IEA projects that lithium supply shortfalls could appear as early as 2027–2028, depending on the performance of new capacity under construction [1]. Benchmark Mineral Intelligence estimates a 12.5% supply deficit by 2030 [1]. Ganfeng Lithium anticipates global lithium demand growing 30–40% by 2026 and has suggested prices could climb to 150,000–200,000 yuan/t (approximately $21,000–$28,000/t) if demand materializes as expected [6]. Fastmarkets forecasts a marginal surplus in 2025 flipping to a deficit of roughly 1,500 t LCE in 2026 [6].

    Lithium production is heavily concentrated: Australia (~60,000 t LCE), Chile (~35,000 t), China (~25,000 t), Argentina (~18,000 t), and the U.S. (~5,000 t) dominate supply [6]. With new mines requiring two to five years to reach production, the system has limited flexibility to respond to sustained demand from EVs, grid storage, and heavy transport, which Arcane Capital expects to drive global lithium demand to around 4.6 million t LCE by 2030 [6]. U.S. projects such as the Nevada Lithium‑Boron Project, expected to produce 26 kt LCE annually, will help but remain modest relative to projected global needs [6].

    Copper: Permitting Bottlenecks and Structural Deficit

    The IEA and S&P Global both warn that copper demand for electrification, grids, and EVs will outstrip supply from operating and in‑construction mines from the mid‑2020s onward [1]. S&P projects that copper demand could double by 2035, with supply shortfalls emerging as early as 2024 in some scenarios [1]. To close this gap, the world would need to commission three new copper mines each year for nearly three decades at a cumulative cost exceeding $500 billion [1].

    Regulatory and social constraints, rather than geology, constitute the main bottlenecks. Roque Benavides has publicly criticized slow permitting processes, noting that “bureaucracy is not the answer” if the world is serious about meeting copper demand [19]. Chile—historically the second‑largest copper producer—is experiencing stagnating output amid permitting challenges, water scarcity, and delayed execution of structural projects, exacerbating global tightness [19]. These constraints translate into higher project risk premiums, delayed capacity additions, and growing vulnerability for sectors dependent on high‑grade copper products, including HV cables, motors, and power infrastructure.

    Cobalt: Licensing Frictions and Chemistry Shifts

    The cobalt market in 2026 is characterized by both short‑term logistics risks and longer‑term demand uncertainty. The DRC supplies over 97% of China’s cobalt intermediate imports [24]. Although an export suspension was nominally lifted on 16 October 2025, the failure to issue export licenses promptly meant that no material actually left the country through at least early December 2025 [24]. Chinese imports of cobalt intermediates are expected to be weak from January to March 2026, with arrivals concentrated in April–May as licensing catches up [24].

    On the demand side, China’s EV market sold 16.49 million units in 2025, up 28.2% year‑on‑year [24]. However, the sector is shifting battery chemistries away from cobalt‑intensive ternary cathodes toward lower‑cobalt or cobalt‑free formulations [24]. This transition contributed to a 5.8% year‑on‑year decline in cobalt sulfate production in 2025 (to 111,611 t) and a 14.6% decline in cobalt chloride output (to 96,079 t) [24]. Producers have reduced or halted operations due to high costs, even as demand for cobalt oxide used in cathodes has been more stable [24].

    Chinese EV policy is also evolving. In 2026, national policy is shifting from broad‑based subsidies to more targeted “structural regulation,” meaning future EV adoption will rely more on intrinsic value and export competitiveness than on blanket incentives [24]. Analysts expect downstream cobalt product shortages in Q1 2026 and rising cobalt intermediate prices in Q2, followed by supply‑demand rebalancing and slower price growth in H2 2026 [24].

    Key Data & Trends

    This section highlights quantitative patterns that define Q2 2026 hotspots by material, country, and sector, and explains why they matter for procurement and strategy decisions.

    1. Yttrium Exports: A 95% Collapse in Physical Supply

    Yttrium exports from China to the United States illustrate the severity of current HREE controls:

    This chart shows Chinese yttrium exports to the U.S. collapsing from 333 t in the eight months before April 2025 controls to 17 t in the eight months after, a decline of about 95% [4][23]. For turbine and engine OEMs, this is not a marginal tightening but an abrupt supply shock. With yttrium central to non‑substitutable thermal barrier coatings, such a contraction converts into hard constraints on maintenance and production once inventories are exhausted [4][23]. The data underscores why HREEs must be treated as a top‑tier geopolitical risk, not simply as a cost line item.

    Schematic of the critical minerals supply chain from extraction to key end-use sectors.
    Schematic of the critical minerals supply chain from extraction to key end-use sectors.

    2. Rare Earth Processing Concentration: China’s 91% Refining Share

    Processing concentration amplifies the impact of Chinese policy decisions:

    China accounts for around 61% of mined rare earth supply but approximately 91% of global refining and processing capacity as of 2024 [8]. This pie chart highlights the processing bottleneck: even if new mines open in countries such as Australia, Vietnam, or Brazil, most ore still requires Chinese refining to become usable material [8]. For corporate strategy, this means that simply diversifying mining jurisdictions does not eliminate exposure to Chinese export controls; processing capacity outside China is the key constraint to monitor and, where possible, to help finance and secure.

    3. Lithium Carbonate Prices: From Floor to Uptrend

    Lithium carbonate spot prices in China signal the turn from surplus toward tightness:

    Between June and late November 2025, lithium carbonate spot prices in China rose from $8,259/t to $13,003/t, a 57% increase [6]. This rebound followed two years of oversupply and inventory accumulation [6]. For battery and EV manufacturers, this price pattern signals that the window to lock in long‑term offtake at cycle lows has closed. It supports the IEA and Benchmark projections that the market is transitioning into a structurally tighter phase, with deficits emerging from 2026–2028 onward if new capacity underperforms [1][6].

    4. Cobalt Intermediate Output: Production Cuts Amid Chemistry Shifts

    Chinese cobalt salt production data reveal how technology shifts interact with supply risk:

    In 2025, Chinese cobalt sulfate production totaled 111,611 t, down 5.8% year‑on‑year, while cobalt chloride output fell 14.6% to 96,079 t [24]. These declines reflect a shift toward lower‑cobalt battery chemistries and cost pressures on smelters [24]. Yet the system remains exposed to upstream shocks: the DRC still supplies over 97% of China’s cobalt intermediate imports, and export license delays are constraining arrivals in early 2026 [24]. For buyers, this combination of reduced structural intensity but high geographic concentration means cobalt risk has shifted from volume‑growth pressure to disruption‑driven volatility.

    5. EV Demand and Metal Exposure

    Electric vehicles drive demand across lithium, cobalt, copper, and certain rare earths. Global EVs on the road grew from around 10 million in 2022 to 16 million in 2024, with sales projected to exceed 25 million units by 2026 and surpass 50 million by 2030 [6]. China alone sold 16.49 million EVs in 2025, up 28.2% year‑on‑year [24]. Longer‑range vehicles require larger batteries, increasing lithium and, in many chemistries, nickel and cobalt consumption per vehicle [6][24].

    For procurement strategists, the key trend is that even with some substitution (e.g., lithium iron phosphate and sodium‑ion chemistries), aggregate mineral demand continues to rise rapidly [1][6][24]. Lithium and copper are particularly hard to substitute at scale in the medium term. This underpins the imperative to treat EV and grid deployment plans as embedded commodity positions and to integrate commodity risk management directly into product and capacity planning.

    Risks & Scenarios

    Materials Dispatch assesses three plausible trajectories for 2026–2028. These are qualitative scenarios designed for planning; they complement, rather than replace, the quantitative forecasts from IEA, S&P Global, and market analytics [1][6][24].

    Scenario 1 – Managed Tightness (Base Case)

    In this scenario, current patterns persist without major escalation. Chinese HREE export controls remain in place, licensing stays restrictive but not fully prohibitive beyond existing bans to Japan, and yttrium and scandium continue to trade at elevated prices with sporadic shortages [4][5][23]. Aerospace coating and semiconductor sectors avoid outright shutdowns by aggressive rationing, re‑routing through remaining channels, and limited efficiency gains, but operate with minimal buffers [4][23].

    Lithium markets move from balance to modest deficit around 2026, consistent with Fastmarkets and IEA projections [1][6]. Prices remain above the November 2025 level of $13,003/t and trend higher as inventories are drawn down and EV demand grows [6]. Copper supply tightens gradually, with increased premiums for high‑grade and just‑in‑time delivery, but large‑scale projects in Chile, Peru, and North America proceed slowly under existing permitting regimes [1][19].

    Cobalt experiences the expected 2026 pattern: tightness and higher prices in Q1–Q2 as DRC licensing backlogs constrain Chinese imports, followed by rebalancing in H2 as exports normalize and lower‑cobalt chemistries continue to gain share [24]. Under this base case, risk manifests primarily through elevated input costs, working‑capital strain from higher inventories, and limited optionality if a new shock emerges.

    Scenario 2 – Weaponized Chokepoints (Downside Escalation)

    The downside scenario assumes further geopolitical weaponization of critical minerals. China could extend HREE and magnet export bans beyond Japan to other allies, or tighten licensing selectively to target semiconductors, defense, or aerospace sectors in the U.S. and Europe by restricting approvals for specific end‑users, a capability already embedded in current licensing rules [5][23]. Any additional measure would compound existing shortages: with U.S. scandium entirely dependent on Chinese exports and global supply in the tens of tonnes, targeted denials could halt production of certain semiconductor tools and high‑performance alloys once months‑scale stockpiles are exhausted [4][23].

    Simultaneously, if DRC export license frictions persist or intensify, cobalt intermediate flows into China could remain constrained beyond the early‑2026 window currently anticipated [24]. Extended delays would force deeper production cuts in cobalt salts just as EV adoption continues, driving more pronounced price spikes and causing smaller cell producers to struggle to secure feedstock [24].

    On the lithium and copper fronts, escalation could take the form of slower‑than‑expected ramp‑up of new projects—due to permitting setbacks, social opposition, or financing constraints—which would tighten markets faster than baseline forecasts assume [1][6][19]. Combined with robust EV and grid demand, this would push prices to levels that challenge the economics of lower‑margin vehicle models and grid projects, potentially forcing OEMs to reprioritize product lineups and deployment schedules.

    For operators, this scenario translates into real risk of production interruptions in aerospace coatings, certain semiconductor production steps, and at the margin, battery manufacturing in less‑integrated producers. It would also elevate counterparty and sovereign‑risk considerations in offtake and project‑finance decisions.

    Scenario 3 – Partial Relief and Diversification (Upside)

    The upside scenario assumes a degree of policy stabilization and more rapid progress on diversification projects. Chinese authorities may choose to maintain HREE controls but streamline licensing for some commercial buyers to reduce collateral damage to global supply chains, while keeping targeted leverage over select strategic sectors [5]. U.S. and allied investments into non‑Chinese rare‑earth processing could begin to commission in the late 2020s, chipping away at the 91% refining dominance China currently holds [8].

    Contrasting demand growth and constrained supply for lithium, copper, and heavy rare earth elements through 2030.
    Contrasting demand growth and constrained supply for lithium, copper, and heavy rare earth elements through 2030.

    On lithium, faster‑than‑expected ramp‑up of Australian, South American, and U.S. projects—including assets like the Nevada Lithium‑Boron Project at 26 kt LCE per year—could narrow or delay the forecast deficits [1][6]. Additional recycling capacity and chemistries that reduce lithium intensity per kWh would ease pressure further [6]. Copper supply could benefit from targeted permitting reforms in key jurisdictions, reducing lead times and improving investor confidence, partly addressing the multi‑decade mine‑investment gap identified by the IEA and S&P Global [1][19].

    In cobalt, normalization of DRC export licensing and continued adoption of lower‑cobalt chemistries would likely sustain a more balanced market after 2026, containing price volatility and reducing immediate disruption risk even as total demand grows [24].

    Even in this optimistic case, however, the structural concentration of processing capacity and the long lead times for mining projects mean that critical mineral risk does not disappear; it becomes more manageable but still requires active procurement and portfolio strategies.

    Actionable Intelligence

    The following checklists translate the above analysis into concrete steps for procurement directors, supply‑chain strategists, and risk officers.

    Do Now (This Week)

    • Map HREE exposure by part, plant, and supplier. Owner: Chief Procurement Officer (CPO). Deadline: End of this week. Identify all uses of yttrium, scandium, dysprosium, and terbium in coatings, alloys, magnets, and semiconductor processes, including Tier‑2/Tier‑3 suppliers. Specifically flag dependencies on Chinese export licenses and Japanese magnet producers now affected by China’s February 2026 bans [4][5][8][23].
    • Validate critical‑mineral inventory coverage. Owner: Supply Chain VP. Deadline: Within 5 business days. For HREEs, cobalt, and lithium, quantify on‑hand inventory in weeks/months of consumption under current production rates. Compare coverage with known disruption horizons: months‑scale stockpiles for scandium and yttrium [4][23]; DRC cobalt import weakness through Q1 2026 [24]. Use this to define minimum safety‑stock thresholds.
    • Secure and review licensing/compliance documentation. Owner: Trade Compliance Head. Deadline: Within 1 week. For all flows of Chinese HREEs and DRC‑origin cobalt intermediates, ensure export/import licenses, end‑user declarations, and dual‑use compliance are current and complete [5][24]. Where possible, pre‑file or pre‑negotiate renewals to avoid administrative disruptions becoming physical supply cuts.

    Do in Q2 2026

    • Rebalance supplier portfolios away from single‑point dependencies. Owner: Category Managers (Battery Materials, Alloys, Magnets). Deadline: End of Q2. For lithium and cobalt, increase exposure to non‑Chinese production where commercially viable (e.g., Australia, Chile, Argentina, U.S. projects) via medium‑term offtake or volume‑flex contracts [6]. For rare earths, explore tolling or purchase agreements with emerging non‑Chinese processors, even at small volumes, to build optionality as they scale [8].
    • Accelerate material and process qualification for lower‑risk chemistries. Owner: CTO / Head of R&D. Deadline: Q2 sign‑off, 12–24 month implementation. In batteries, fast‑track qualification of lower‑cobalt cathode chemistries where performance and warranty profiles allow, leveraging the ongoing shift already observable in China [24]. In coatings and alloys, investigate formulations that reduce yttrium intensity per engine or component, while recognizing that total substitution is not currently feasible [4][23].
    • Embed commodity‑risk metrics into product and capex decisions. Owner: CFO / Strategy VP. Deadline: Q2 planning cycle. Incorporate IEA and market‑based deficit projections for lithium and copper [1][6] into long‑term EV, grid, and industrial electrification plans. Ensure that product profitability analyses explicitly model alternative price paths and availability risks for these commodities, not just average cost expectations.

    Do by 2026 and Beyond

    • Restructure supply chains around processing, not just mining, diversification. Owner: CPO / Corporate Development. Horizon: 2026–2030. Given China’s 91% share of rare earth processing [8], prioritize investments and long‑term partnerships in non‑Chinese refining and processing capacity for rare earths, lithium, and nickel. Equity stakes, long‑tenor offtakes, and technical support can all help de‑risk new plants and secure preferential access.
    • Support permitting and infrastructure reforms in key jurisdictions. Owner: Government Affairs / ESG. Horizon: Ongoing. Engage constructively with host governments and communities in copper‑, lithium‑, and cobalt‑rich regions to advocate for “fast‑track but responsible” permitting, echoing industry calls that current bureaucracy threatens to leave the world short of copper within five to six years [19]. Credible ESG performance is essential to win social license for the accelerated project timelines implied by IEA and S&P scenarios [1][19].
    • Build a dedicated critical‑minerals intelligence function. Owner: CRO / CPO. Horizon: Initial capability in 2026, full build‑out by 2028. Institutionalize monitoring of prices, spreads, export licenses, customs flows, and regulatory changes for HREEs, lithium, copper, cobalt, and related materials [1][4][5][6][24]. This should include subscriptions to specialist price reporting (e.g., for lithium carbonate [6]) and regular engagement with upstream operators. Treat this as core infrastructure, akin to FX or energy risk management.

    Signals to Watch

    To operationalize early warning, Materials Dispatch recommends tracking the following indicators on at least a weekly basis:

    • Yttrium export flows and license approvals. Monitor Chinese customs data and trade press for changes in yttrium exports to the U.S. and allies. Any sustained levels near the post‑control 17 t eight‑month figure, or further declines, signal continued or escalating constraint; a move back toward pre‑control volumes (333 t over eight months) would indicate partial relief [4][23].
    • Chinese lithium carbonate spot price vs. late‑2025 highs. Track whether prices remain above, or decisively break below, the November 2025 level of $13,003/t [6]. Persistent moves higher would corroborate the shift into deficit conditions; a sustained retreat could suggest demand softness or faster capacity additions.
    • DRC cobalt export licensing and Chinese arrivals. Watch for updates on DRC export license issuance and corresponding cobalt intermediate arrivals into China. Continued reports of “no raw materials leaving” beyond early 2026, or weaker‑than‑expected arrivals in April–May, would indicate downside risk to the current rebalancing narrative [24].
    • Chinese dual‑use export control updates. Any amendment to China’s dual‑use items catalogue or explicit extension of rare earth or magnet export bans to new countries or sectors (beyond the February 2026 measures targeting Japan) would materially alter risk for aerospace, defense, and semiconductor supply chains [5][8].
    • Public commentary from turbine‑coating and semiconductor OEMs. Statements about “rationing,” “allocation,” or “temporary order suspensions” related to yttrium‑ or scandium‑containing products—similar to those reported in late 2025 Reuters coverage [4][23]—are practical leading indicators that HREE constraints are moving from upstream tightening to downstream production impact.

    Sources

    [1] International Energy Agency (IEA); S&P Global; Benchmark Mineral Intelligence – Critical minerals and copper market outlooks and deficit projections, 2023–2035 (as compiled in the Perplexity research dossier).

    [4] Reuters – Reporting on Chinese heavy rare earth export controls, yttrium trade flows, price spikes, and impacts on coating manufacturers and aerospace supply chains, 2025–2026.

    [5] Ministry of Commerce of the People’s Republic of China (MOFCOM); PRC government – Export control regulations on heavy rare earths, including April and October 2025 measures and 2026 dual‑use control updates, as cited in the Perplexity research dossier.

    [6] Fastmarkets; Ganfeng Lithium; Arcane Capital; industry price and production reports – Lithium carbonate pricing, inventory levels, production by country, and demand forecasts for EVs and storage, 2023–2030.

    [8] Industry and policy analysis on global rare earth supply chains – Estimates of China’s share of mined rare earth output and refining capacity, and assessment of Japan’s role in permanent magnet production and diversification efforts.

    [19] Interview statements and conference remarks by Roque Benavides, Chairman of Compañía de Minas Buenaventura – Commentary on copper supply adequacy, project pipelines, and permitting/bureaucracy challenges in Latin America, February 2026.

    [23] SemiAnalysis and other semiconductor industry sources; Reuters – Analysis of scandium’s role in 5G semiconductor components, U.S. dependence on Chinese scandium exports, licensing delays, and stockpile limitations, 2025–2026.

    [24] Chinese cobalt market intelligence and statistical reports – Data on DRC’s share of China’s cobalt intermediate imports, export suspension and licensing delays, cobalt sulfate and chloride output and year‑on‑year changes, EV sales in China, and evolving EV subsidy and regulatory policy, 2025–2026.

  • Tech deep dive: recycling flows and recovery limits for key strategic materials

    Tech deep dive: recycling flows and recovery limits for key strategic materials

    **Recycling of strategic metals is scaling fast in capacity but remains structurally constrained by feedstock timing, thermodynamic limits, and economic cut‑offs. By 2030, even under aggressive build‑out of hydrometallurgical and black‑mass capacity, recycling will ease supply risk for a subset of metals (PGMs, copper, cobalt, nickel) while remaining marginal for others (lithium, rare earths, dispersed precious metals). Primary mining remains the dominant source of supply; recycling functions as a volatility buffer and resilience lever, not a full substitute.**

    Tech Deep Dive: Recycling Flows and Recovery Limits for Key Strategic Materials

    The critical materials narrative often treats recycling as a future escape hatch from mining dependence. In practice, physical flows, process chemistry, and the age profile of installed assets constrain what recycling can actually deliver by 2030 and into the 2040s.

    For strategic metals such as lithium, cobalt, nickel, copper, rare earth elements (REEs), tungsten, and platinum group metals (PGMs), the core operational question is not whether recycling technology exists, but how much recoverable material will be available, at what quality, and at what energy and compliance cost. This is where optimistic circularity narratives collide with facility‑level realities.

    Materials Dispatch’s view is straightforward: in the 2020s and early 2030s, recycling is primarily a risk‑buffering and by‑product optimization tool, not a structural replacement for primary supply. The limiting factor is less laboratory efficiency and more the geometry of product lifetimes, scrap logistics, and regulatory friction.

    1. Market Scale: Fast Growth, Limited Structural Displacement

    Monetary growth in recycling markets is significant, but it does not translate linearly into displaced primary mining. Several segments illustrate this divergence.

    Industry data indicates that the precious metals e‑waste recovery segment was valued around US$6 billion in 2024 and is projected to reach roughly US$7.4 billion by 2030, implying a modest single‑digit compound growth rate. This reflects rising volumes of end‑of‑life electronics and higher recovery efforts for gold, silver, palladium, and other high‑value metals embedded in devices, but it still represents a small share of total global precious metal supply.

    The broader metal recycling market, covering ferrous and non‑ferrous streams, is much larger. Estimates place its value at over US$70 billion in 2023, with projections above US$120 billion by 2030 at high single‑digit compound growth. This increase is driven by both additional tonnage and higher value per tonne, but it primarily reflects growth in bulk metals (steel and copper) rather than the most critical battery or rare metals.

    Black‑mass recycling, focused on spent lithium‑ion batteries, is a smaller but faster‑growing niche. Market assessments suggest black‑mass processing could exceed US$5 billion by 2030, from a much lower base today. This is the critical midstream link for recovering cobalt, nickel, manganese, and, increasingly, lithium from electric vehicle (EV) and stationary storage batteries.

    On the long tail of strategic metals, a “rare metal recycling” cluster-covering elements such as tantalum, indium, and some rare earths-is projected in the hundreds of millions of dollars by the early 2030s. That scale underlines the core issue: in value terms this segment grows, but relative to primary mining of these elements, it remains supplementary.

    In short, market growth signals rising activity and CAPEX, but not a fundamental inversion of the supply structure. Bulk scrap flows (steel, copper, aluminum) dominate recycling tonnage, while the most geopolitically sensitive metals remain tied to primary ore bodies.

    2. Material Flows: Feedstock Geometry and the 2030 Constraint

    Technical capability is only half the equation. The other half is whether material physically arrives at a recycling gate in a recoverable form. Here, two categories matter: prompt scrap and post‑consumer (end‑of‑life) scrap.

    • Prompt (pre‑consumer) scrap arises during manufacturing — offcuts from rolling mills, machining chips, electrode off‑spec product, catalyst refurbishing. It is typically clean, segregated, and high‑grade, making recovery straightforward both technically and economically.
    • Post‑consumer scrap comes from end‑of‑life vehicles, electronics, turbines, magnets, and infrastructure. It is heterogeneous, contaminated, and often physically entangled with plastics, ceramics, and other metals, significantly complicating extraction.

    For strategic materials, the bulk of current recycling volumes still originate from prompt scrap and industrial take‑back (for example, spent PGMs catalysts) rather than mass post‑consumer flows. That skew is central to understanding realistic ceilings on recycled content in the 2020s.

    For battery metals, the age profile is particularly constraining. EV batteries sold in the late 2010s and early 2020s have typical service lives on the order of a decade, with many units entering second‑life stationary applications before true end‑of‑life. As a result, the volume of spent EV packs available for recycling in 2030 remains modest relative to the size of the installed base and the upstream mining throughput supporting it.

    Global modelling of clean energy transitions indicates that recycling capacity for batteries and critical minerals is being built ahead of this feedstock wave. Capacity growth for battery recycling has been reported at around 50% year‑on‑year in 2023, while end‑of‑life volumes lag. In effect, plants are emerging faster than scrap, creating an utilisation gap in the near term.

    This mismatch is most acute in jurisdictions where policy has driven aggressive build‑out of recycling capacity (for example, parts of East Asia and Europe) but where local end‑of‑life material is not yet abundant. In these regions, cross‑border sourcing of feedstock, merchant tolling, and competition for industrial scrap become central operational issues.

    3. Recovery Performance by Metal Class

    Recovery limits are highly metal‑specific. They depend not only on chemistry but also on how concentrated and “collectable” each metal is in its end‑of‑life form.

    3.1 Platinum Group Metals (PGMs)

    PGMs are the strongest positive case in strategic metal recycling. Industry statistics indicate that recycling contributes comfortably above 20% of annual platinum, palladium, and rhodium supply. Key drivers include the high intrinsic value of these metals and their relatively concentrated use in catalytic converters, chemical catalysts, and jewelry.

    PGM recycling flows are dominated by:

    • Automotive catalysts: Exhaust after‑treatment bricks are relatively easy to collect, have high PGM loadings, and are supported by established logistics and assay infrastructure.
    • Industrial catalysts: Petrochemical and fertilizer plants operate under long‑term contracts that include catalyst take‑back and metal accounting.
    • Jewelry and industrial scrap: High purity and known composition allow efficient refining routes.

    Even here, that said, recycling does not eliminate the need for mining. The majority of PGMs still originate from primary sources, and incremental demand from fuel cells, hydrogen electrolysers, and specialty alloys maintains pressure on mine supply.

    3.2 Gold, Silver, and Other Precious Metals

    Gold and silver enjoy high recovery rates from jewelry and bullion, but their recovery from electronics and industrial applications is structurally constrained. Thin coatings, trace‑level use in connectors, and dispersion across billions of consumer devices create a collection and concentration problem more than a chemistry problem.

    Market estimates for precious metals e‑waste recovery reaching the mid‑single‑digit billions of dollars by 2030 highlight robust commercial activity, but these numbers remain modest compared to annual primary gold and silver production. The vast majority of metal embedded in low‑value electronics still ends up in residual waste or in metallurgical streams where only a fraction is ultimately captured.

    The key operational friction is economic: recovering milligrams of gold from mixed, flame‑retarded plastics and base metal boards is technically achievable through advanced hydrometallurgy and smelting, but the cost and environmental controls required push many potential recovery routes below economic cut‑off, especially in jurisdictions with stringent emissions standards.

    3.3 Copper, Nickel, and Cobalt

    Copper has long been a recycling workhorse. Scrap copper from wiring, motors, and industrial processes feeds a mature ecosystem of mechanical sorting, smelting, and electrorefining. For many economies, recycled copper provides a large share of refined copper supply, particularly from construction and industrial scrap.

    Schematic overview of global recycling flows for strategic metals from e-waste and batteries.
    Schematic overview of global recycling flows for strategic metals from e-waste and batteries.

    Nickel and cobalt recycling historically derived from stainless steel, superalloy scrap, and refinery intermediates. The emergence of battery black mass adds a new high‑grade source, particularly for cobalt. Hydrometallurgical circuits designed for sulphide concentrates have been adapted and, in some cases, purpose‑built for black‑mass leach and recovery.

    Long‑term modelling under ambitious climate policy scenarios suggests that recycling could reduce the need for new mine development by roughly 40% for copper and cobalt, and around 25% for nickel and lithium, by 2050. These figures hinge on full deployment of collection systems, mature recycling infrastructure, and substantial technological progress. By 2030, the actual displacement is materially lower, limited by the pace at which EV fleets, renewable assets, and new grid infrastructure reach end‑of‑life.

    3.4 Lithium and Graphite

    Lithium and graphite sit at the difficult end of the recycling spectrum. Current lithium‑ion battery recycling technologies typically achieve overall recovery rates in the 40-60% range, with high efficiency for cobalt and nickel but much more limited capture of lithium and graphite.

    Hydrometallurgical flowsheets often leach and recover transition metals as mixed sulphates or sulphides while treating lithium as a secondary product, for example via precipitation as lithium carbonate or lithium phosphate. Graphite is frequently burned for energy in pyrometallurgical routes or ends up in residues where recovery is technically possible but rarely economic at scale.

    Regulatory pressure is starting to change the calculus. The European Union’s Battery Regulation (Regulation (EU) 2023/1542) sets binding recovery efficiency targets, including 50% lithium recovery from waste batteries by 2027 and 80% by 2031, alongside high targets for cobalt, nickel, and copper. These targets force process developers to focus on lithium and graphite recovery, not just high‑value transition metals, but commercial deployment at scale is still at an early stage.

    3.5 Rare Earth Elements (REEs) and Other Criticals

    Rare earth recycling remains marginal in absolute terms, despite intense policy interest. The difficulty is not the chemistry — solvent extraction and ion exchange can separate rare earths to high purities — but the combination of low concentrations, magnet miniaturisation, and the complexity of recovering magnets and phosphors from devices without prohibitive manual labour or contamination.

    Emerging industrial flows include magnet swarf from machining of NdFeB magnets, end‑of‑life wind turbine generators, and EV traction motors. These streams offer higher grades than dispersed consumer applications and are the focus of pilot hydrometallurgical and molten‑salt processes. Even so, current rare earth recycling contributes only a negligible fraction of global supply, with primary production in China, the US, and Australia dominating.

    For tungsten, molybdenum, and tantalum, recycling from tool steels, carbide inserts, and capacitors is more established. However, these flows are tightly linked to industrial scrap rather than broad consumer end‑of‑life streams, again limiting scale relative to primary mining.

    4. Technology Deep Dive: From Shredders to Hydromet Cells

    Recycling technologies can be grouped into mechanical, pyrometallurgical, hydrometallurgical, and emerging direct‑recycling processes. Each has characteristic recovery limits, energy demands, and environmental footprints.

    Technology Route Typical Role Recovery Profile Key Constraints
    Mechanical (shredding, sorting) Pre‑treatment, liberation, scrap upgrading Wide range (single digits to >70%) depending on material purity Material mixing, fines losses, limited element‑specific separation
    Pyrometallurgical Smelting, high‑temperature refining Variable, often 20-60% for complex multi‑metal feeds High energy use, off‑gas treatment, limited lithium/volatile element capture
    Hydrometallurgical Leaching, solvent extraction, precipitation Frequently above 40% and rising; best‑in‑class battery flowsheets claim >95% of contained metals Reagent consumption, effluent management, slower kinetics, complex SX circuits
    Direct recycling / re‑manufacturing Cathode relithiation, magnet reprocessing Potentially high value retention with lower energy input Strict feed quality requirements, product qualification, still early‑stage

    4.1 Mechanical Pre‑Treatment and Sorting

    Virtually every recycling chain starts with some form of mechanical pre‑treatment: shredding, milling, screening, magnetic separation, eddy‑current sorting, and density or optical sorting. These steps liberate metals from casings and substrates, concentrate high‑value fractions, and reduce transport volumes.

    AI‑enabled optical sorters and robotic disassembly systems are increasingly deployed in e‑waste and battery dismantling lines. Their role is less about thermodynamic efficiency and more about reducing contamination, improving worker safety, and stabilising feed quality into downstream chemical processes.

    4.2 Pyrometallurgy: Scale with Selectivity Trade‑Offs

    Pyrometallurgical processes — furnaces, converters, and rotary kilns operating at hundreds to over a thousand degrees Celsius — offer robust throughput and flexibility. They can treat heterogeneous scrap, destroy organics, and produce metallic alloys or mattes that are amenable to further refining.

    In PGM and precious metals recycling from autocatalysts, integrated smelter‑refinery complexes combine high‑temperature furnaces with precious metal refining circuits, achieving high recovery rates for PGMs while co‑producing base metals. For black mass, some flowsheets rely on smelting to produce a cobalt‑nickel alloy, with lithium reporting to slag or off‑gas unless specifically captured.

    The key trade‑offs are energy intensity and selectivity. High‑temperature processes often struggle with light elements such as lithium and can volatilise halogens and organic contaminants, necessitating sophisticated off‑gas cleaning. Environmental regulations on dioxins, fluorides, and heavy metal emissions tighten the operating envelope and raise compliance costs.

    Process flow from black mass to recovered battery metals using hydrometallurgical methods.
    Process flow from black mass to recovered battery metals using hydrometallurgical methods.

    4.3 Hydrometallurgy: Selectivity with Wastewater Complexity

    Hydrometallurgical routes use aqueous chemistry to leach metals into solution, followed by separation via solvent extraction (SX), ion exchange, precipitation, and electrowinning. For many strategic metals, hydrometallurgy is emerging as the midstream backbone of high‑efficiency recycling.

    Battery black‑mass circuits typically include acid leaching (sulphuric, hydrochloric, or mixed systems), oxidation‑reduction control to separate manganese and iron, SX to split cobalt and nickel, and precipitation or crystallisation to produce battery‑grade sulphates or hydroxides. Some commercial technologies report over 95% recovery of cobalt, nickel, and manganese; lithium recovery remains more variable, depending on flowsheet design.

    In rare earth recycling from magnet or phosphor scrap, hydromet circuits leverage the same SX chemistry used in primary REE separation, but often operate with more challenging impurity profiles (iron, aluminium, phosphates). The number of SX stages, organic losses, and aqueous effluent loads drive both CAPEX and OPEX.

    Hydrometallurgy trades furnace energy for reagent manufacture and effluent treatment. Waste streams — acidified brines, sodium sulphate, fluorides, and organic residues from extractants — create non‑trivial tail management obligations under environmental permits.

    4.4 Direct Recycling and Functional Material Recovery

    Direct recycling aims to preserve the functional structure of materials rather than dissolving them to elemental form. Examples include relithiating spent cathode powders, recovering and re‑sizing graphite anodes, or reprocessing NdFeB magnet alloy into new magnets without complete chemical breakdown.

    This approach can be far less energy‑intensive and preserve more of the embedded manufacturing value. However, it demands tight control of feedstock quality and consistent chemistries. Mixed chemistries (NMC, LFP, NCA), degradation products, and cross‑contamination from collection make standardisation difficult in real‑world streams.

    Direct recycling is therefore best suited to vertically integrated systems with known product designs — for example, internal scrap from a cell manufacturer or closed‑loop agreements with specific OEMs — rather than heterogeneous municipal or cross‑OEM waste streams.

    5. Physical and Economic Recovery Limits

    The distance between theoretical recyclability and actual recovered tonnage is governed by three interacting limits: thermodynamic, design‑for‑recycling, and economic.

    5.1 Thermodynamic and Process Limits

    From a strictly physical perspective, complete recovery is rarely achievable. Dilution, mixing, side reactions, and phase equilibria lead to inevitable losses in slags, filter cakes, and off‑gases. Each additional increment of recovery typically demands disproportionate increases in energy, equipment complexity, or reagent consumption.

    For example, chasing the last percentage points of lithium from a complex leach liquor may require multiple precipitation and impurity control steps, producing additional residues and raising effluent loads. Similarly, recovering trace gold or palladium from low‑grade slimes in a copper refinery is possible, but often uneconomic beyond a certain cut‑off grade.

    5.2 Product Design and Dissipative Uses

    Many strategic metals are used in inherently dissipative or low‑mass applications: thin‑film coatings, solder pastes, phosphors, catalysts with nano‑scale dispersion, and additives in alloys. Once dispersed at that scale and intermixed with organics or ceramics, recovery becomes either technically infeasible or grossly uneconomic.

    Even where designs theoretically support recycling — such as magnets embedded in motors or generators — mechanical access can be a bottleneck. Extracting small magnets from sealed motors at scale without heavy manual labour remains challenging, despite robotics advances.

    5.3 Economic Cut‑Offs and Down‑Cycling

    Recycling economics hinge on the value per tonne of recoverable metal, less the cost of collection, logistics, processing, compliance, and financing. When elements are present at ppm levels in mixed waste, even high market prices may not offset the full cost stack.

    This drives widespread down‑cycling. For example, mixed low‑grade copper and precious metal scrap may be routed to bulk smelters where copper is recovered efficiently but much of the precious metal content is dispersed into slags or dusts that are only partially retreated. Similarly, lithium in pyrometallurgical battery recycling often reports to slag that is not systematically reprocessed.

    The result is a structural gap between theoretical circularity and what multi‑metal flowsheets deliver in practice. As a working heuristic for strategic planning, recycling behaves more as a high‑value capture mechanism for a limited set of elements than as a universal recovery engine.

    6. Regional Capacity, Policy, and Compliance Friction

    Recycling capacity build‑out is regionally skewed, and policy frameworks heavily influence which routes are feasible.

    China currently holds a dominant position in battery pretreatment and material recovery, with projections pointing to more than 70% market share in these segments toward 2030. State‑backed enterprises are consolidating end‑of‑life EV batteries, with clear policy signals to retain critical metal value domestically. This concentration provides scale and learning‑curve advantages but also increases geopolitical dependence for downstream users of recycled materials.

    Conceptual visualization of how recycling’s contribution to metal supply grows over time relative to primary mining.
    Conceptual visualization of how recycling’s contribution to metal supply grows over time relative to primary mining.

    In Europe and the United States, announced recycling capacity for batteries and some critical metals is substantial, but modelling suggests that by 2040 it would only cover around 30% of the expected domestic end‑of‑life feedstock. This implies ongoing reliance on exports of waste or intermediate products, or on continued landfilling and energy recovery for a portion of complex waste, unless additional capacity or alternative routes emerge.

    India and several Southeast Asian economies sit at the other end of the spectrum, with announced capacity projected to cover only a small share of anticipated feedstock by 2040. Informal recycling of e‑waste remains widespread, with associated safety and environmental risks, while formal hydromet and pyromet infrastructure is less developed.

    Cross‑border shipment of hazardous waste for recycling is increasingly constrained by the Basel Convention and its amendments, as well as unilateral controls on “waste” exports. Classification disputes — whether a material is a recyclable product or a hazardous waste — introduce legal uncertainty, delay shipments, and raise storage and working‑capital requirements for recyclers.

    At the same time, instruments such as the EU Battery Regulation, extended producer responsibility (EPR) schemes for electronics, and national critical mineral strategies are tightening obligations around collection and minimum recycled content. These regulations simultaneously create predictable feedstock flows and higher compliance complexity for operators across the chain.

    7. Operational Risk and Failure Modes in Strategic Metal Recycling

    Recycling facilities handling strategic metals face a distinct set of operational, environmental, and safety risks that shape feasible technology choices.

    7.1 Safety and Process Stability

    Battery and e‑waste handling introduces elevated fire and explosion risks. Lithium‑ion cells can undergo thermal runaway during shredding or storage, particularly if damaged or partially charged. Facilities rely on inerting (nitrogen, CO2), temperature monitoring, and stringent pre‑sorting to stabilise operations, adding to both CAPEX and OPEX.

    Chemical hazards are equally material. Fluoride‑bearing electrolytes, if not properly neutralised and scrubbed, generate HF and other toxic compounds. Cyanide or aqua regia systems used in some precious metal recovery operations require tight containment and emergency response capabilities.

    7.2 Environmental Compliance and Waste Management

    Hydrometallurgical plants generate large volumes of process water and solid residues. Even when reagents are recycled internally, bleed streams containing dissolved metals, sulphates, fluorides, and organic extractants demand treatment to meet discharge standards. Solid residues, including filter cakes, neutralisation sludges, and slags, may qualify as hazardous waste, requiring secure disposal or further processing.

    In the PGM and precious metal segment, dust control and fugitive emissions of arsenic, lead, and other toxic species are central permitting issues. Inadequate baghouse design or maintenance can rapidly erode regulatory goodwill and constrain throughput.

    7.3 Feed Quality and Offtake Risk

    Many recycling flowsheets are highly sensitive to feed composition. Shifts in battery chemistries (for example, growing penetration of LFP at the expense of high‑nickel NMC) change the value distribution in black mass and can undermine the business case of circuits optimised for cobalt and nickel recovery.

    On the offtake side, downstream refineries and cathode/magnet makers increasingly demand tight impurity specifications. Delivering battery‑grade or magnet‑grade products from heterogeneous scrap requires consistent process control, rigorous sampling, and robust metal accounting. Failure to meet specifications can downgrade material to lower‑value outlets, eroding the economic rationale of high‑capex recycling assets.

    8. 2030-2040 Scenarios: Where Recycling Changes the Supply Balance

    Scenario analysis across metal classes reveals a clear pattern: recycling meaningfully alters supply‑demand balances in some segments, while remaining structurally peripheral in others, at least through 2030.

    • PGMs and precious metals: Recycling already accounts for a significant share of PGM supply and a substantial share of gold from jewelry and bullion. Further incremental gains are likely, but the system is already close to its practical collection and processing ceiling.
    • Copper, nickel, and cobalt: As EV fleets, grids, and industrial assets mature, post‑consumer scrap volumes become large enough for recycling to offset a material fraction of new mine requirements, especially under strong policy support. However, until the 2030s, primary mining remains the dominant supply pillar.
    • Lithium and graphite: Even under optimistic technology trajectories and strict regulatory targets, recycling contributes a relatively small fraction of supply by 2030, with more impactful displacement only emerging in the 2035–2045 window as first‑wave EV packs retire in bulk.
    • Rare earths and niche criticals: Recycling offers targeted relief for specific applications (magnets, phosphors, catalysts) but remains far from reshaping global supply, given the dominance of primary production and the fragmentation of end‑of‑life flows.

    One structural insight stands out: in critical metals, recycling behaves more as a volatility dampener than a volume replacement. When integrated into metal balance modelling, high‑efficiency recycling reduces the amplitude of supply shocks and price spikes but does not eliminate dependence on new projects in politically or geologically constrained regions.

    From an industrial resilience perspective, strategically located recycling capacity — near demand centres, powered by relatively low‑carbon grids, and embedded in transparent regulatory regimes — functions as critical infrastructure. It provides a backstop in disruption scenarios, shortens logistics chains, and offers options for rapid response to material bottlenecks, even if it cannot fully close the loop.

    9. Conclusion: Realistic Circularity and the Role of Recycling in Strategic Metals

    The emerging reality is more nuanced than the slogan of an imminent circular economy for critical materials. Physics, design choices, and economic thresholds impose firm ceilings on recoverable fractions, especially by 2030. Recycling already plays an indispensable role in PGMs, copper, and certain industrial scraps, and it is rapidly gaining importance in battery midstreams, but it does not erase the requirement for new primary supply in strategic metals.

    The critical operational insight for the next decade is that capacity growth in recycling will continue to run ahead of post‑consumer feedstock in many regions, while regulatory intensity, product redesign, and offtake specifications raise the bar for process performance. Facilities that integrate robust mechanical pre‑treatment, flexible hydrometallurgical flowsheets, and disciplined environmental management are better positioned to convert nominal capacity into effective recovered tonnage.

    For Materials Dispatch, recycling flows are treated as a dynamic but bounded component of the broader supply architecture. Continuous monitoring of policy shifts, technology performance, and lifetime distributions of critical‑metal‑bearing assets remains essential, as these weak signals will determine how far recycling can stretch its role in the strategic metals system beyond 2030.

    Note on Materials Dispatch methodology Materials Dispatch integrates regulatory text monitoring (including instruments such as the EU Battery Regulation and MOFCOM directives), market and production data from agencies like the IEA and USGS, and end‑use technical specifications from OEMs and standards bodies. This triangulation supports a grounded view of how recycling technologies, material flows, and recovery limits interact across the full critical materials value chain.

  • Top 10 critical materials myths procurement teams still believe

    Top 10 critical materials myths procurement teams still believe

    Top 10 Critical Materials Myths Procurement Teams Still Believe in 2025

    Materials Dispatch keeps seeing the same pattern: technically competent procurement teams, sophisticated ERP tools, and still a set of stubborn myths that quietly undermine critical materials strategy. The gaps aren’t in intent-they’re in assumptions about recycling, “safe” jurisdictions, domestic projects, and how far ESG or stockpiles really move the needle.

    This briefing dissects the top 10 myths still embedded in critical minerals sourcing for batteries, electronics, defense systems, and industrial catalysts. Each section pairs current data (IEA, USGS, industry reports) with what actually happens inside tenders and offtake talks: where projects slip, how export controls land in contracts, and what premiums buyers are really paying for resilience.

    The rankings are based on strategic impact: how badly the myth can damage security of supply, how often it shows up in RFQs and board decks, and how hard it is to unwind from existing contracts. Some myths sound comforting-“recycling will cover it,” “Australia is safe,” “just add Indonesia”-but comfort hasn’t kept plants or gigafactories running when controls, quotas, or community disputes hit.

    For each myth, this briefing clarifies the asset or risk, the industrial context, the real bottleneck, and a verdict: how critical the exposure is, what resilience really looks like, and the signals Materials Dispatch monitors when advising procurement teams. The aim isn’t alarmism; it’s to replace inherited narratives with numbers, timelines, and specific tradeoffs.

    1. “Recycling Will Cover Most Critical Materials Needs by 2030”

    “Recycling Will Cover Most Critical Materials Needs by 2030” – trailer / artwork
    “Recycling Will Cover Most Critical Materials Needs by 2030” – trailer / artwork

    The asset/risk: Lithium, cobalt, nickel, and rare earths underpin EVs, grid storage, and permanent magnets. Many sourcing plans now assume that by 2030, recycling will offset most primary mining requirements, easing price and geopolitical risk.

    Strategic context: The IEA’s 2024 critical minerals work estimates that recycling could supply roughly 12-20% of lithium, cobalt, and nickel demand by 2030, even under optimistic collection and processing scenarios. At the same time, projected demand growth for these metals is several hundred percent, driven by EV penetration, grid-scale batteries, and magnet-heavy applications in wind and defense. That math alone shows the gap: recycling scales, but not at the same slope as demand.

    The bottleneck: There simply aren’t enough end-of-life batteries and magnets entering the waste stream in this decade. Most EV packs in service today won’t be scrapped before the early-to-mid 2030s. Collection systems remain patchy, especially outside the EU. Technically, hydrometallurgical processes can recover high percentages of contained metals, but commercial plants take years to permit, finance, and ramp. And a meaningful share of current recycling capacity is in China, reintroducing the very geographic risk many teams think they’re escaping.

    The verdict: Recycling is a strategic complement, not a primary supply pillar, through at least 2030. Materials Dispatch treats recycled feedstock as a bonus tranche equal to a modest share of annual demand, not a replacement for new mine offtake. Procurement teams that build sourcing plans assuming 50%+ recycled content in the near term create hidden short positions in primary supply. Signals to watch: real commissioning (not just announcements) of recycling plants in the US, EU, Japan, and Korea; OEM take-back mandates; and cross-border waste rules that can throttle scrap flows. High criticality; resilience comes from blended portfolios that lock in primary units while ramping recycling, not from recycling alone.

    2. “China’s Export Controls Are Temporary Speedbumps, Easy to Route Around”

    “China’s Export Controls Are Temporary Speedbumps, Easy to Route Around” – trailer / artwork
    “China’s Export Controls Are Temporary Speedbumps, Easy to Route Around” – trailer / artwork

    The asset/risk: Antimony, rare earths, graphite, gallium, and germanium sit at the core of munitions, flame retardants, magnets, batteries, semiconductors, and fiber optics. China dominates mining, refining, or both for most of these materials.

    Strategic context: Recent controls aren’t isolated events. China has already implemented and maintained licensing regimes on gallium and germanium exports, and, according to industry reporting, announced antimony export quotas on the order of tens of thousands of tonnes per year. For antimony alone, that quota level equates to a major fraction of typical global seaborne trade. For gallium, China controls roughly 94% of global primary output; for germanium, around 60%. These are structural concentrations, not transient anomalies.

    The bottleneck: “Routing around” controls via third countries sounds attractive on PowerPoint and falls apart in compliance reviews. The EU Critical Raw Materials Act, US anti-circumvention rules, and tightening origin-tracing in major OEMs’ supplier codes make it risky to rely on transshipment through Vietnam, Malaysia, or others as a long-term solution. Moreover, alternative producers—Lynas at Mt Weld in Australia for rare earths, or emerging graphite projects in Africa—are significant but still far smaller than Chinese capacity and often sell out via multi-year offtakes to anchor customers.

    The verdict: Export controls and quotas need to be treated as semi-permanent features of the landscape and priced explicitly into sourcing strategies. Materials Dispatch sees prudent teams modeling at least a 30-50% probability of additional tightening events over a five-year horizon. Paying a 10-25% premium for non-China units from suppliers like Lynas or MP Materials often pencils out as a cheaper insurance policy than absorbing multi-quarter shutdown risk. Signals to watch: new licensing announcements from China’s Ministry of Commerce, WTO disputes or retaliatory measures, and shifts in domestic Chinese demand that could prompt further quota adjustments. Criticality is high; real resilience means dedicated non-China volumes plus robust origin documentation, not paper rerouting.

    3. “Domestic Mines in the US or EU Solve Import Dependence”

    “Domestic Mines in the US or EU Solve Import Dependence” – trailer / artwork
    “Domestic Mines in the US or EU Solve Import Dependence” – trailer / artwork

    The asset/risk: Lithium, rare earths, nickel, and other listed critical minerals increasingly feature in national security and industrial policy. Project names like Thacker Pass (lithium, US), Mountain Pass (rare earths, US), or various Iberian and Nordic lithium and nickel projects in Europe often appear in internal slides as if they fully neutralize import risk.

    Strategic context: Domestic production unquestionably improves resilience, but the scale and timelines are frequently misunderstood. Recent USGS data still show the United States as 100% import-reliant for over a dozen critical minerals and heavily import-dependent for several more. Mountain Pass, operated by MP Materials in California, has significantly ramped rare earth oxide output, yet downstream separation and magnet manufacturing capacity in North America remains limited. Lithium projects like Lithium Americas’ Thacker Pass in Nevada and Piedmont Lithium’s Carolina project in the US Southeast are at varying development stages, but most are only expected to reach commercial output late this decade, subject to permitting and financing.

    The bottleneck: The constraints are not only geology. Environmental reviews, community opposition, litigation, water rights, and infrastructure all extend the path to first production. In the US, the effective timeline from discovery to commercial operation often exceeds 7–10 years. Europe faces similar challenges, compounded by dense populations and stringent regulatory norms. Even when mines are built, midstream refining capacity may still reside abroad, meaning concentrates or intermediate products travel back into global value chains before returning as components.

    The verdict: Domestic projects reduce risk exposure but don’t erase it. Materials Dispatch treats them as partial hedges that, at best, cover a slice of national or regional demand. Procurement teams that assume a single domestic project can backstop full requirements risk discovering, too late, that commissioning slippage or technical issues leave them still exposed to foreign refined output. Signals to monitor: permitting reform in the US and EU, concrete investment in refining and magnet/metals plants (not just mining headlines), and long-term offtake deals that may lock up early production for a narrow set of buyers. Criticality: medium-to-high; resilience depends on pairing domestic volumes with diversified foreign offtake and realistic ramp assumptions.

    4. “Palladium and Other Precious Metals Are Safe Because the EV Shift Will Create Surpluses”

    The asset/risk: Platinum group metals (PGMs)—platinum, palladium, rhodium—are central to autocatalysts, some chemical processes, and emerging fuel cell and hydrogen applications. A widely repeated narrative suggests that as internal combustion engine (ICE) vehicle production falls, palladium in particular will swing into a durable surplus and become a low-risk commodity.

    Strategic context: The transition is more complex. Yes, ICE demand erodes palladium use over time, and some autocatalyst manufacturers are already substituting platinum for palladium where technically viable. But supply is concentrated in jurisdictions with substantial geopolitical and operational risk: Russia is a dominant palladium producer, while South Africa provides significant volumes of both platinum and palladium from deep-level, power-intensive operations. Sanctions, logistics issues, and chronic power instability have all affected output and costs.

    The bottleneck: Mines and smelters can’t be reconfigured overnight to follow demand shifts. Producers respond gradually, and closures often lag price signals, creating interim deficits or surpluses. Recycling provides an important buffer, but end-of-life catalyst returns vary with scrap prices, regulations, and macro conditions. During recent market stress, some automotive and chemical manufacturers that assumed an “inevitable surplus” found themselves locked into high-priced spot purchases when Russian or South African supply hit disruptions.

    The verdict: PGMs remain strategic, not generic. Materials Dispatch views palladium exposure as still high-risk for any application that can’t easily redesign away from it within a two- to three-year window. Procurement teams gain resilience by dual-qualifying platinum-lean formulations, negotiating flexibility in specifications, and combining primary mine offtakes (for example, from South African open-pit operations such as Mogalakwena) with structured recycling agreements. Signals to watch: sanctions or shipping constraints affecting Russia, South African grid reliability and labor negotiations, and OEM substitution trends that can flip market balances faster than mine plans can react. Criticality is medium but volatile; assuming a benign surplus is the risky position.

    5. “ESG Compliance Is Just a Cost Adder, Not a Supply-Side Advantage”

    “ESG Compliance Is Just a Cost Adder, Not a Supply-Side Advantage” – trailer / artwork
    “ESG Compliance Is Just a Cost Adder, Not a Supply-Side Advantage” – trailer / artwork

    The asset/risk: Cobalt, nickel, lithium, and copper from regions such as the Democratic Republic of Congo (DRC) and parts of Latin America carry elevated ESG scrutiny—child labor, artisanal mining, pollution, water stress, and community conflict. A persistent myth in procurement is that ESG raises unit costs without improving security of supply.

    Strategic context: In reality, ESG performance increasingly determines which projects obtain capital, long-term offtakes, and regulatory acceptance. Large-scale, modern operations such as Ivanhoe’s Kamoa-Kakula complex in the DRC or Glencore’s industrial cobalt and copper assets have attracted sizeable financing precisely because they can demonstrate stronger governance and environmental controls than informal or semi-formal operations. Projects in OECD jurisdictions that adopt credible standards—IRMA, ICMM, or third-party tailings audits—often secure lower financing costs, faster insurance approvals, and fewer stoppages from protests or enforcement actions.

    The bottleneck: The challenge is timing and verification. ESG alignment requires detailed data collection, independent audits, and sometimes redesign of tailings, water management, or labor practices. That carries up-front cost and schedule risk. But projects that neglect this work face a different risk stack: litigation, license suspensions, reputational constraints that push major OEMs away, and difficulty raising capital for expansions, which in turn constrains available volumes.

    The verdict: ESG is increasingly a supply enabler, not just a cost. Materials Dispatch has observed that long-term, ESG-anchored offtake deals tend to correlate with more stable deliveries and less price volatility exposure, because financing and community relations are more robust. Paying a modest premium for material from well-governed operations in the DRC, Australia, or Canada often yields lower risk-adjusted costs than chasing the absolute cheapest tonne from opaque sources. Signals to watch: new due diligence regulations (EU Battery Regulation, forced labor bans), insurer stances on tailings and high-risk jurisdictions, and the integration of ESG thresholds into bank lending criteria. Criticality is high for battery metals; resilience improves markedly when ESG is embedded in supplier selection rather than bolted on afterward.

    6. “Stockpiles Make Gallium and Germanium Export Controls a Non-Issue”

    “Stockpiles Make Gallium and Germanium Export Controls a Non-Issue” – trailer / artwork
    “Stockpiles Make Gallium and Germanium Export Controls a Non-Issue” – trailer / artwork

    The asset/risk: Gallium and germanium are niche but indispensable in compound semiconductors, infrared optics, high-efficiency solar, and defense systems (radar, secure communications). Export licensing introduced by China from mid-2023 onward has already demonstrated how quickly supply for downstream users can tighten.

    Strategic context: China accounts for around 94% of global primary gallium output and about 60% of refined germanium production, according to widely cited market analyses. These metals are typically produced as byproducts of aluminum, zinc, and coal operations, so production decisions are tied to broader base metals markets. Several consuming countries have responded by building or expanding strategic stockpiles, and some buyers now treat one to two years of gallium or germanium inventory as an acceptable buffer.

    The bottleneck: Stockpiles buy time, not independence. Non-Chinese production and refining capacity are still limited, and greenfield projects will take years to deliver meaningful volumes. Because gallium and germanium often represent small revenue shares for upstream producers, there’s little incentive to ramp unless clear, long-term offtakes are in place. Meanwhile, export licensing in China can be tightened or relaxed with relatively short notice, and licenses can be delayed without formal denials, pushing uncertainty into every renewal cycle.

    The verdict: Treat gallium and germanium as strategic chokepoints that require layered mitigation beyond stockpiling. Materials Dispatch’s view is that a 12–24 month inventory cushion is valuable but should be combined with early participation in non-China project offtakes, qualification of alternative device designs where feasible, and clear force majeure and allocation clauses in supplier contracts. Signals to monitor: commissioning progress at new refining facilities in North America, Europe, and East Asia; changes in Chinese licensing guidance; and defense-related demand that could tighten markets further. Criticality is very high for defense, telecom, and high-end solar; resilience requires long-term planning that goes well beyond “we have a warehouse full of ingots.”

    7. “Silver Is Plentiful Because It’s Mostly a Byproduct”

    “Silver Is Plentiful Because It’s Mostly a Byproduct” – trailer / artwork
    “Silver Is Plentiful Because It’s Mostly a Byproduct” – trailer / artwork

    The asset/risk: Silver is a critical component in photovoltaics, electronics, and some advanced battery chemistries. Because roughly 70% of mine supply globally comes as a byproduct of lead, zinc, copper, or gold operations, there’s a comfortable assumption in some teams that silver “rides along” with base metals and can’t really be constrained.

    Strategic context: Recent analyses by the Silver Institute and others show recurring structural deficits in the silver market, with demand for solar and electronics outpacing new mine supply and recycling. When silver is a byproduct, production responds primarily to the economics of the host metal. A copper or lead mine won’t increase throughput just because silver prices rise modestly; it will respond to copper or lead fundamentals, permitting conditions, and ESG constraints.

    The bottleneck: Many of the large polymetallic operations that supply significant silver—mines in Mexico, Peru, and other Latin American jurisdictions, as well as operations in Eastern Europe—face elevated risk from community disputes, taxation changes, and water or environmental pressures. When a major operation shuts down or strikes, the market can lose tens of millions of ounces of silver as a side-effect of decisions aimed at the base metal. Primary silver mines can help fill gaps, but they are fewer, often higher-cost, and require long lead times to develop.

    The verdict: For high-purity silver needs in solar, electronics, or specialized chemical uses, supply is more fragile than “byproduct” suggests. Materials Dispatch recommends treating silver as a critical input where procurement should diversify across both byproduct-heavy producers and a subset of primary silver miners, even if that raises the average unit cost. Signals to watch: strikes, tax changes, and water restrictions at large Latin American and Eastern European base metal mines; silver loadings per solar cell as technologies evolve; and investment in thrifting or substitution in key applications. Criticality sits in the middle tier but is trending up for solar-heavy portfolios; resilience improves with offtakes that recognize silver as a primary concern, not a mere add-on.

    8. “Australian Projects Are Automatically Stable, Low-Risk Alternatives”

    “Australian Projects Are Automatically Stable, Low-Risk Alternatives” – trailer / artwork
    “Australian Projects Are Automatically Stable, Low-Risk Alternatives” – trailer / artwork

    The asset/risk: Australia is a leading producer of lithium, nickel, and some rare earths, hosting operations such as Pilbara Minerals’ Pilgangoora lithium project and Albemarle’s stake in the Greenbushes lithium mine. In many boardrooms, “Australian origin” has become shorthand for stable, low-risk, Western-aligned supply.

    Strategic context: Australian governance, rule of law, and mining expertise are strong, and for good reason these projects command premiums and long-term commitments from OEMs. However, the operating environment is far from frictionless. Native Title and Indigenous heritage protections can reshape project scopes or timelines. Environmental approvals, water availability, and infrastructure constraints (power, ports, skilled labor) all play into capacity expansions. Recent public reporting has highlighted community concerns and regulatory scrutiny around some major lithium operations and proposed expansions.

    The bottleneck: The narrative that “Australia will just build more” underestimates how quickly social license and regulatory expectations are evolving. Expansion phases at world-scale operations have encountered objections, appeals, or renegotiations of benefits for local communities. Simultaneously, Australian projects are highly integrated into global supply chains—some ores and concentrates move to China or other Asian countries for downstream processing, creating a second layer of geopolitical exposure even when the mine itself sits in a relatively low-risk jurisdiction.

    The verdict: Australian origin materially improves political and governance risk compared with many jurisdictions, but it doesn’t eliminate community, regulatory, or midstream concentration risks. Materials Dispatch views Australian volumes as core building blocks in diversified portfolios, not as single-point solutions. Procurement teams should pay attention to Indigenous engagement frameworks, environmental approvals for expansion stages, and the destination of concentrate or intermediate products (onshore refining versus export). Signals to monitor: changes in heritage legislation, court challenges to major project expansions, and investment flows into onshore battery chemicals and refining. Criticality: high for lithium and nickel users; resilience requires pairing Australian offtake with non-China refining pathways and realistic assumptions about expansion timelines.

    9. “PGM Recycling Will Fully Close the Loop for Catalysts and Fuel Cells”

    “PGM Recycling Will Fully Close the Loop for Catalysts and Fuel Cells” – trailer / artwork
    “PGM Recycling Will Fully Close the Loop for Catalysts and Fuel Cells” – trailer / artwork

    The asset/risk: Platinum, palladium, and rhodium are heavily recycled from spent autocatalysts and some industrial catalysts. This has led to a belief that PGM markets are effectively circular and that recycling will shield end users from primary mine disruptions in South Africa, Russia, or Zimbabwe.

    Strategic context: Recycling already supplies a meaningful share of total PGM demand—on the order of a quarter to a third of platinum and palladium use, depending on the year. That contribution is significant and will remain so. However, even mature recycling systems exhibit lag: it can take a decade or more for metals in new vehicles entering the fleet to return as scrap. As EVs displace ICEs, fewer new autocatalyst loads are installed, which eventually reduces future scrap flows, even while some industrial and fuel cell applications for PGMs grow.

    The bottleneck: Scrap availability and collection are highly sensitive to macroeconomics and regulation. In downturns, fewer vehicles are scrapped; in some regions, informal or opaque recycling channels divert material away from formal refiners with traceable supply. Additionally, recycling infrastructure is itself concentrated, with key facilities in Europe, North America, Japan, and South Africa. If primary mine supply from South Africa or Russia is disrupted, recyclers cannot instantly ramp throughput or yields to offset multi-million-ounce gaps.

    The verdict: PGM recycling is a critical stabilizer but not a full hedge against primary production risk. Materials Dispatch sees the greatest resilience where procurement combines long-term primary offtakes from diversified operators (for example, South African and North American mines) with contracted access to recycling streams and flexible catalyst formulations that can tilt between platinum and palladium. Signals to monitor: scrappage rates, regulatory changes affecting end-of-life vehicle handling, investment in new recycling capacity, and policy shifts that might accelerate hydrogen or fuel cell adoption. Criticality is moderate-to-high for sectors still dependent on PGMs; assuming recycling alone can carry the system invites exposure when simultaneous mine and scrap shocks occur.

    10. “Geopolitical Diversification Just Means Adding One New Jurisdiction”

    “Geopolitical Diversification Just Means Adding One New Jurisdiction” – trailer / artwork
    “Geopolitical Diversification Just Means Adding One New Jurisdiction” – trailer / artwork

    The asset/risk: Nickel, cobalt, lithium, and rare earths are often diversified by adding a single major new jurisdiction—commonly Indonesia for nickel, or one Latin American country for lithium—on the assumption that this shift alone meaningfully de-risks supply away from China or another dominant player.

    Strategic context: Indonesia’s rapid rise in nickel production, for instance, has reshaped global battery nickel supply. But much of the high-pressure acid leach (HPAL) and processing capacity there is financed, constructed, or operated with substantial Chinese participation. Ore export bans and policy changes have steered value-add operations onshore, yet the midstream and offtake patterns still tie Indonesian output closely to Chinese stainless steel and battery chains. Similar dynamics appear in other jurisdictions where new mines depend heavily on a single foreign partner for processing or marketing.

    The bottleneck: Geographic diversification without midstream or ownership diversification can be shallow. A procurement plan that simply swaps one DRC cobalt unit for one Indonesian nickel unit remains exposed if both ultimately funnel through the same small set of refineries or traders. Single new jurisdictions also tend to carry concentrated political and regulatory risk—changes in export taxes, royalty regimes, local ownership rules, or environmental enforcement can quickly reprice projects. Logistics can add another layer: long supply lines, limited ports, and weather-related disruptions all matter at scale.

    The verdict: Effective diversification is multi-dimensional. Materials Dispatch treats robust strategies as those that spread exposure across several jurisdictions (for example, Indonesia, Brazil, and Canada for nickel), multiple midstream routes (different refiners and chemistries), and varied ownership structures (state-owned, private, and integrated OEM-linked projects). Emerging assets such as Vale’s nickel operations in Brazil or Canada Nickel’s Crawford project illustrate how non-traditional jurisdictions can fit into such portfolios alongside more established producers. Signals to watch: shifts in export policies, new processing plants outside China, and long-term offtake patterns that reveal where real control sits. Criticality is high for battery metals; resilience only emerges when diversification is measured in correlated risk factors, not just pins on a map.

    Conclusion: Turning Myths into Measurable Risk Tradeoffs

    Across these ten myths, a consistent theme emerges: narratives that feel reassuring—“the loop will close,” “domestic supply is coming,” “Australia is safe,” “we’ve diversified by adding one country”—tend to understate actual bottlenecks in permitting, processing, governance, and geopolitics. Critical materials markets don’t reward wishful thinking; they reward disciplined recognition of where control and optionality really sit.

    Materials Dispatch’s work with industrial and defense supply chains suggests that paying 10–25% more for diversified, non-China, ESG-verified supply often compares favorably to the expected cost of 30–50% disruption risks over a contract’s life. IEA data on recycling, concentration figures for gallium and germanium, and the persistence of export controls and quotas all point in the same direction: near-term security depends more on well-structured primary offtake and multi-jurisdiction portfolios than on optimistic assumptions about technology or policy fixes.

    For procurement teams, the practical shift is to embed these realities directly into RFQs and long-term contracts: specify origin and processing constraints, require traceability, price in diversification premiums explicitly, and monitor policy and project milestones as closely as prices. When myths are replaced by quantified risk tradeoffs, sourcing stops being a quarterly firefight and becomes a strategic lever for competitiveness and security of supply.

  • Weekly dispatch #8: new tech, new mines, and new leverage points

    Weekly dispatch #8: new tech, new mines, and new leverage points

    Key Points

    • Acceleration: Mountain Pass, SRC, and commercial tailings pilots have shifted several mid‑2020s supply gaps toward nearer‑term mitigation; combined initiatives aim to supply 10-15% of global NdPr by 2028 (as reported in project disclosures).
    • Concentration of risk: Midstream heavy‑rare‑earth (HREE) separation and magnet conversion remain the critical chokepoints-MP Materials’ mid‑2025 HREE separation commissioning materially alters that profile but does not eliminate dysprosium exposure until later ramps.
    • Policy leverage: CHIPS/DoD grants and EXIM loans are redirecting offtake and permitting priorities toward US/Canada content, creating compliance checkpoints (domestic value‑add and audit trails) for downstream users and public‑sector purchasers.
    • Operational tradeoffs: Tailings and novel extractive technologies cut capex and ramp time versus greenfield mines but introduce feed variability that requires buffer stocks or blend strategies.

    The past 60 days have produced a tangible re‑weighting of North American critical‑materials supply chains. A mix of operationalized facilities (MP Materials, Saskatchewan Research Council), large federal financing packages (CHIPS Act, EXIM, ministerial grants), and rapid‑scale pilots for tailings and low‑carbon metallurgical tech have converted a portion of medium‑term risk into near‑term, but concentrated, execution challenges.

    What materially changed

    MP Materials’ integrated pathway from Mountain Pass concentrates through planned Texas magnet campuses shifts North American capability from ore to magnet, with announced magnet production deals (e.g., automotive and defense offtakes) and a mid‑2025 timetable for heavy‑rare‑earth separation. USA Rare Earth’s Round Top project and Stillwater integration secured CHIPS and loan support to enable mine‑to‑magnet ambitions but remains multi‑year to full output (2028 target). Concurrently, tailings‑to‑REE pilots (Phoenix) and provincial processing (SRC in Saskatchewan) add lower‑carbon, faster ramps for selected volumes.

     Geographic layout of emerging North American rare earth and critical mineral hubs.
    Geographic layout of emerging North American rare earth and critical mineral hubs.

    Supply‑chain implications and risks

    Positive supply rebalancing is concentrated in a small set of facilities. Midstream separation capacity for dysprosium and terbium remains the tightest node: MP’s HREE commissioning mitigates a portion of that gap but not the full projected deficit through 2027. Reliance on a handful of rail and road corridors (California‑Texas to Midwest EV hubs) concentrates logistics risk-single‑line vulnerabilities and ERCOT grid reliability surface as credible interruption channels. Tailings and novel extraction lower capital and calendar risk versus greenfield mines but introduce grade variability that translates into operational buffers for cathode or magnet alloying.

    From mine to magnet: a simplified visualization of the rare earth supply chain.
    From mine to magnet: a simplified visualization of the rare earth supply chain.

    Policy and compliance dynamics

    Federal funding-CHIPS Act awards, EXIM debt support, and Critical Minerals Ministerial grants—ties capital disbursements to domestic content and reporting. These instruments elevate auditability (domestic value‑add thresholds, ESG disclosures) as a commercial gate for offtake and government procurement. Geopolitical signaling from China’s quota review cycle and EU critical‑materials regulatory moves increases the premium on traceable, audited supply streams.

    How critical minerals move from extraction and processing into advanced technologies.
    How critical minerals move from extraction and processing into advanced technologies.

    Signals to watch (public/regulator‑safe)

    • Commissioning dates and first commercial output from MP Materials’ HREE separation (mid‑2025 target) and Fort Worth/10X magnet capacity (2026-2027 timelines).
    • Disbursement schedules and compliance conditions linked to CHIPS/DoD and EXIM funding for USA Rare Earth and related projects (July 2026 funding windows referenced in ministerial guidance).
    • Scaling metrics from tailings pilots—Phoenix facility reported pilot success and projected >3,000 MT/year by 2026 in briefings; commercial throughput figures and grade consistency tests are critical.
    • China’s quota/review outcomes for HREEs in Q1-Q2 2026 and any EU stockpiling/CBAM enforcement that alters export economics.
    • Local permitting and grid constraints: TCEQ solvent‑emission rulings, ERCOT capacity notices, and single‑rail chokepoint incidents affecting CA→TX logistics.

    Materials Dispatch Signal

    The North American critical‑materials landscape is shifting from structural scarcity toward concentrated operational risk. Projects with near‑term commissioning and midstream separation capacity (MP Materials, SRC) materially reduce reliance on external magnet intermediaries, but supply security now depends on multi‑node resilience: redundancy in HREE separation, diversified logistics corridors, and verified domestic value‑add. Public‑funding timelines and China quota movements will determine whether this phase becomes sustained diversification or a temporary narrowing of risk exposure.

  • Top 15 policy and regulatory risks for strategic materials in 2026

    Top 15 policy and regulatory risks for strategic materials in 2026

    Top 15 Policy and Regulatory Risks for Strategic Materials in 2026

    Materials Dispatch prepared this briefing for supply chain strategists, policy desks, and compliance teams that have discovered the hard way that geology is no longer the primary constraint in strategic metals. In 2026, export controls, security-driven procurement, and regulatory friction now matter as much as ore grades and capex. The 15 risks below are ranked by their likely impact on rare earths, battery metals, and precious metals supply chains over the next 12-24 months, with emphasis on operational bottlenecks rather than headline noise.

    Three forces shape almost every item on this list: national security framing of materials policy (especially in the United States and China), increasingly interventionist host governments in resource jurisdictions, and the growing compliance stack around ESG, emissions, and human rights. Where possible, this analysis links each risk to concrete levers: licensing timelines, offtake structures, tariff exposure, and due‑diligence obligations. The objective isn’t to predict single outcomes, but to map the boundaries of plausible scenarios that supply chain and policy teams should already be modelling.

    1. China’s Export Controls on Rare Earths and Dual-Use Technology Metals

    China’s Export Controls on Rare Earths and Dual-Use Technology Metals – trailer / artwork
    China’s Export Controls on Rare Earths and Dual-Use Technology Metals – trailer / artwork

    The most systemically important policy risk in 2026 remains China’s evolving export control regime on rare earth elements and dual‑use technology metals. Recent moves to tighten rare earth shipments to Japan, and to concentrate antimony export rights into a small group of state‑approved companies, confirm that Beijing is comfortable using administrative controls as a strategic lever rather than a narrow trade remedy. Similar dynamics already play out in gallium and germanium, where earlier controls forced semiconductor and defense supply chains into accelerated diversification.

    For downstream manufacturers in magnets, catalysts, semiconductors, and defense hardware, the main bottleneck isn’t geological scarcity, but licensing opacity. Export volumes can be throttled without any formal “ban” simply through slower approvals, tighter documentation checks, or shifting technical classifications. In by‑product markets like antimony, where primary production outside China is thin, even modest administrative constraints translate into price spikes and allocation battles that traditional hedging can’t fully offset.

    Verdict: Critical risk. Resilience improves only where buyers hold multi‑jurisdictional offtake (e.g., combining Chinese supply with emerging flows from Australia, the Americas, and ASEAN) and maintain buffer inventories. Signals to watch in 2026 include: additions to China’s export control catalogues; new security‑related licensing requirements for magnet and chip supply chains; and any pilot “white list” arrangements that favor select allied buyers while tightening access for others. A single policy announcement can effectively reprice the entire rare earth complex in days.

    2. U.S. Section 232 Actions on Processed Critical Mineral Products

    U.S. Section 232 Actions on Processed Critical Mineral Products – trailer / artwork
    U.S. Section 232 Actions on Processed Critical Mineral Products – trailer / artwork

    Section 232 of the U.S. Trade Expansion Act has moved from theoretical threat to active framework for restructuring critical minerals trade. A recent Commerce Department finding that the United States is “too reliant on foreign sources of processed critical mineral derivative products (PCMDPs)” and faces “unsustainable price volatility” gives the administration legal cover to deploy tariffs, quotas, or licensing on a wide set of refined metals, magnets, and alloy inputs on national security grounds.

    The vulnerability is broad: PCMDPs feed directly into defense platforms, aerospace structures, telecommunications hardware, and advanced transportation. Even where U.S. import dependence is partial rather than absolute, officials have flagged disruption risk as sufficient to justify intervention. Because Section 232 measures can be adjusted “depending on the status or outcome” of negotiations with allies and rivals, companies must operate under shifting tariff lines, evolving country exemptions, and periodic review of covered HS codes.

    Verdict: Critical risk, but asymmetrical. U.S. defense primes and OEMs with direct channels into Washington can often secure exclusions or transition relief; smaller manufacturers and foreign processors face the brunt of cost and paperwork. Resilience hinges on: (1) granular origin tracing for processed inputs, (2) maintaining alternate suppliers in jurisdictions likely to be exempted, and (3) scenario models covering tariff bands from 10-35%. Key signals in 2026 include any expansion of covered product lists to permanent magnet assemblies, battery precursors, or specialty alloys, and the alignment-or lack of it-between U.S. and allied trade measures.

    3. U.S. “Project Vault” and State-Backed Offtake Market Distortions

    U.S. “Project Vault” and State-Backed Offtake Market Distortions – trailer / artwork
    U.S. “Project Vault” and State-Backed Offtake Market Distortions – trailer / artwork

    Project Vault, Washington’s flagship strategic materials initiative, is expected to mobilize roughly USD 12 billion into mining, processing, and stockpiling to reduce reliance on China. The core instruments-long‑term offtake contracts, price floors, and targeted equity stakes—are designed to de‑risk projects in allied jurisdictions and secure material flows for defense, energy transition, and semiconductor supply chains.

    In practice, this creates a dual‑track market. Project Vault contracts often lock in volumes at negotiated prices and prioritize delivery to U.S. government needs or designated prime contractors. Remaining tonnage is left for commercial buyers at spot prices that can be significantly higher and more volatile. Producers, especially juniors, face intense pressure to sign government‑linked offtakes to unlock financing, even when those terms cap their upside in bull markets. Non‑U.S. buyers suddenly discover that “their” supplier is effectively pre‑sold years in advance.

    Verdict: Critical for buyers outside the preferred defense and semiconductor ecosystems, and a mixed blessing for producers. Resilience comes from early engagement: mapping which projects are likely to be “Vault‑eligible,” understanding how much capacity will be pre‑committed, and structuring side offtakes that survive policy or administration changes. Signals to monitor in 2026 include: the size and tenor of initial Vault contracts in rare earths and battery metals, any extension into recycling streams, and whether allied governments respond with parallel stockpiles that further fragment global availability.

    4. EU Critical Raw Materials Act: Ambitious Targets, Slow Permits

    EU Critical Raw Materials Act: Ambitious Targets, Slow Permits – trailer / artwork
    EU Critical Raw Materials Act: Ambitious Targets, Slow Permits – trailer / artwork

    The EU Critical Raw Materials Act (CRMA) is Brussels’ answer to dependence on Chinese processing and Russian feedstock. More than 160 projects have applied for strategic status under its framework, spanning lithium, rare earths, antimony, gallium, and other listed materials. Yet, when Materials Dispatch benchmarks projects on the ground, the policy bottleneck is clear: permitting inertia and procedural complexity consistently outrun political urgency.

    In recent industry surveys, 46% of respondents identified “red tape and administrative inaction” as the EU’s primary barrier to critical mineral security, far ahead of mere resource availability. Environmental impact assessments, overlapping national and EU‑level reviews, and litigation risks routinely stretch mine and refinery permitting to 5-10 years. Even brownfield expansions can find themselves trapped between new biodiversity rules, water directives, and shifting community expectations. Financing then stalls, because lenders typically require concrete permitting milestones before releasing capital, creating a circular delay.

    Verdict: High risk in terms of timing, even if not outright supply denial. CRMA targets for domestic mining, processing, and recycling are unlikely to be met on schedule without profound permitting reform. Resilience for industrial users involves assuming that European origin material will remain scarcer and more expensive than the policy narrative suggests, and continuing to cultivate non‑EU supply while tracking “fast‑track” permitting pilots. Signals in 2026: whether flagship CRMA projects obtain permits within 24–36 months, the real functioning of one‑stop shops, and the degree of tolerance for legal challenges by environmental NGOs and local communities.

    5. OECD Permitting, Litigation, and “Not in My Backyard” Constraints

    OECD Permitting, Litigation, and “Not in My Backyard” Constraints – trailer / artwork
    OECD Permitting, Litigation, and “Not in My Backyard” Constraints – trailer / artwork

    Beyond the EU’s formal CRMA context, permitting headwinds across OECD economies represent a structural risk for onshoring strategies. In the United States and Canada, strategic minerals projects routinely spend a decade navigating environmental reviews, court challenges, and local opposition. In several lithium and nickel projects reviewed by our team, litigation over water use, Indigenous consent, and land‑use zoning has proven more determinative than commodity prices.

    Efforts to streamline environmental review frameworks, such as U.S. NEPA reform discussions and Canadian “one project, one review” messaging, remain politically contested. At the same time, higher ESG expectations from financiers and OEMs mean that even when permitting law is technically satisfied, projects can still be de‑facto blocked by reputational concerns. For industrial users counting on “friendly‑shore” sourcing to offset Chinese dependencies, the combination of lengthy approval cycles and project‑by‑project politics often renders 2030 milestones optimistic.

    Verdict: High timing and volume risk for any strategy predicated on rapid scale‑up of mining in advanced economies. Resilience requires treating OECD projects as long‑dated options rather than firm near‑term supply, while investing in early engagement with communities and Indigenous rights‑holders to reduce litigation risk. Signals to watch in 2026 include: whether major lithium clay or rare earth projects in the U.S. Southwest and Canada’s North move from concept to construction; changes in judicial attitudes toward “strategic importance” arguments; and the spread of local referenda on new mines and processing facilities.

    6. Australia’s Strategic Minerals Reserve and Domestic Prioritization

    Australia’s emerging strategic minerals reserve—budgeted at roughly USD 1 billion and focused on antimony, gallium, and rare earths—marks a quiet but important turning point. Canberra is shifting from a pure export‑oriented posture toward a model where the state can intervene directly in allocation, timing, and destination of strategic materials, particularly where domestic defense or allied needs are implicated.

    Operationally, the reserve will likely function through targeted offtake, stockpiles, and financing support for strategic projects. That means a growing fraction of Australia’s high‑quality output could be pre‑committed under government‑backed contracts, often with destination or processing conditions attached. Non‑aligned or purely commercial buyers may find that access to Australian material becomes conditional on long‑term commitments, technology transfer, or participation in allied value‑addition initiatives.

    Verdict: High risk for buyers that have treated Australia as a neutral, always‑open supplier of strategic metals. The reserve also functions as a partial hedge against Chinese export controls, so defense and clean‑tech ecosystems aligned with Canberra and Washington may see improved security. Resilience for others depends on locking in multi‑year offtakes before reserve mechanisms fully activate, and tracking any moves to expand the scheme beyond the initial focus metals. Signals in 2026: the first tranche of reserve‑linked contracts, explicit “allied priority” language in policy documents, and any legal ceilings on volumes that can be diverted into state stockpiles.

    7. Resource Nationalism: Tax, Royalty, and License Shock in a High-Gold World

    Resource Nationalism: Tax, Royalty, and License Shock in a High-Gold World – trailer / artwork
    Resource Nationalism: Tax, Royalty, and License Shock in a High-Gold World – trailer / artwork

    Gold’s record prices in early 2026 have sharply altered bargaining dynamics between host governments and miners. With bullion at all‑time highs, treasury ministries are pushing aggressively for higher royalties, windfall taxes, mandatory local beneficiation, and in some cases retroactive fiscal revisions. While the rhetoric targets “excess profits,” the practical effect is to increase above‑ground risk premiums for gold and often for co‑produced metals such as silver and copper.

    Retroactive taxation is particularly corrosive. Governments revisit historical agreements, alleging underpayment or “unfair” terms negotiated under previous administrations, and then seek back‑taxes or revised royalty formulas applied to past production. In jurisdictions with weaker rule of law, license reviews are used tactically to extract concessions, with threats of suspension or nationalization if terms are not renegotiated. Arbitration cases are already rising, consuming management bandwidth and delaying investments in sustaining capital or expansion.

    Verdict: High risk across gold‑heavy portfolios, especially in parts of West Africa, Latin America, and Central Asia. For downstream users, the risk manifests in intermittent supply disruptions rather than outright scarcity, but it amplifies price volatility and financing costs. Resilience involves closely tracking fiscal policy debates, incorporating scenario buffers into mine‑site operating costs, and distinguishing between jurisdictions that respect stabilization clauses and those that treat contracts as reopenable whenever prices surge. Key 2026 indicators: new windfall profit schemes linked to gold benchmarks, large‑scale license “audits,” and regional copy‑paste of aggressive fiscal models.

    8. Expansion of State-Owned Miners and Forced Equity Participation

    Expansion of State-Owned Miners and Forced Equity Participation – trailer / artwork
    Expansion of State-Owned Miners and Forced Equity Participation – trailer / artwork

    Several resource‑rich states are moving beyond fiscal tools to deeper operational control via state‑owned enterprises (SOEs) and mandated equity stakes in private projects. In gold and critical minerals alike, new or revamped national mining companies are being positioned as compulsory partners, with minimum carried interests and rights to appoint key management or board members. This shift aims to secure a larger share of value and strategic control, but it introduces significant governance and sanctions risk into supply chains.

    Where SOEs have direct or indirect military links, exposure becomes a reputational and compliance issue for downstream buyers subject to ESG screens, sanctions regimes, or export‑control “foreign military end‑user” rules. Deals that were originally structured as private joint ventures can, after a change in law, suddenly include a state shareholder whose activities go far beyond mining. Decision‑making slows, capex approvals become politicized, and strategies may diverge between profit maximization and domestic political objectives.

    Verdict: High governance and compliance risk, particularly for strategic metals feeding defense and high‑tech sectors. Resilience depends on robust counterparty due diligence, explicit governance protections in shareholder agreements, and contingency planning for sanctions escalation. Signals to watch in 2026: new legislation mandating minimum state stakes or “golden shares,” the creation or recapitalization of national mining champions, and increased scrutiny by investors and NGOs of military‑linked supply chains.

    9. Human Rights and ESG Due Diligence Regimes Tightening Supply

    Human Rights and ESG Due Diligence Regimes Tightening Supply – trailer / artwork
    Human Rights and ESG Due Diligence Regimes Tightening Supply – trailer / artwork

    The regulatory wave around human rights and ESG due diligence is no longer theoretical. EU‑level initiatives such as the Corporate Sustainability Due Diligence Directive, the German Supply Chain Due Diligence Act, and national “duty of vigilance” laws, combined with U.S. forced‑labor import bans, are transforming how cobalt, artisanal gold, and 3TG (tin, tantalum, tungsten) can be sourced. Compliance frameworks draw heavily on OECD guidance but now carry hard legal teeth, including fines, civil liability, and seizure of shipments.

    This creates a paradox. Formalizing artisanal and small‑scale mining (ASM) could in theory improve livelihoods and traceability, but as practitioners repeatedly note, governments often “bark louder than they bite” when it comes to resourcing and enforcing ASM reforms. Meanwhile, downstream buyers tighten their red lines, effectively blacklisting high‑risk origins where credible assurance schemes are absent. The result is a shrinking pool of “compliant” material, heavier reliance on a few industrialized producers, and elevated risk of supply concentration—particularly acute for cobalt and ASM‑sourced gold.

    Verdict: High regulatory and reputational risk for any firm touching materials from high‑risk jurisdictions. Resilience hinges on investing in on‑the‑ground traceability, third‑party auditing, and diversified sourcing that can withstand enforcement shocks such as sudden detentions at port. Signals to monitor in 2026: first major enforcement cases under new EU and national due‑diligence laws, evolving guidance on “high‑risk areas,” and whether multistakeholder initiatives for ASM cobalt and gold secure sustained funding or stall under political pressure.

    10. Carbon Border Adjustments and Emissions-Based Trade Barriers

    Carbon Border Adjustments and Emissions-Based Trade Barriers – trailer / artwork
    Carbon Border Adjustments and Emissions-Based Trade Barriers – trailer / artwork

    Climate policy is quietly becoming a trade instrument for metals. The EU’s Carbon Border Adjustment Mechanism (CBAM) initially targets steel, aluminum, and a handful of carbon‑intensive sectors, but it sets the template for how emissions performance could shape access to major markets. Other economies are studying CBAM‑style measures or embedding lifecycle emissions criteria into green procurement and tax incentives, with potential knock‑on effects for nickel, lithium chemicals, and copper concentrates.

    For producers in coal‑heavy grids or with older smelting technologies, the risk is twofold: direct carbon‑linked charges on exports, and indirect exclusion from low‑carbon product categories and contracts. Buyers increasingly demand verified emissions data at batch or asset level, not just generic industry averages, forcing investment in measurement, reporting, and verification systems. Where governments are slow to implement credible carbon policies, their producers may find themselves disadvantaged against peers operating under stricter but more internationally recognized regimes.

    Verdict: Medium‑to‑high risk today, but structurally rising through the decade. For 2026, the primary impact is on aluminum and steel‑rich supply chains, yet strategic materials will not remain outside the perimeter for long. Resilience involves building emissions transparency now and considering low‑carbon energy and process investments as part of license‑to‑operate, not just ESG branding. Signals to watch: any expansion of CBAM or similar mechanisms to additional HS codes, the inclusion of embedded‑emissions criteria in battery and EV subsidies, and the emergence of differentiated prices for “green” versus conventional metal units.

    11. Sanctions, Conflict Zones, and the Fragmentation of Metal Flows

    Sanctions, Conflict Zones, and the Fragmentation of Metal Flows – trailer / artwork
    Sanctions, Conflict Zones, and the Fragmentation of Metal Flows – trailer / artwork

    Sanctions and conflict‑linked restrictions are increasingly central to metals trade. Measures against Russia have already complicated palladium, nickel, aluminum, and uranium flows, while conflict dynamics in regions such as eastern DRC, Myanmar, and parts of the Sahel affect tin, rare earths, and gold. Formal blacklists are only part of the story; many banks and insurers have adopted internal “de‑risking” policies that make it difficult to move any material with ambiguous ownership or routing through high‑risk jurisdictions.

    The immediate operational challenges include payment blockages, vessel and insurance refusals, and sudden reclassification of counterparties as sanctioned or high‑risk based on evolving intelligence. Over time, sanctions encourage the creation of parallel trade networks and opaque intermediaries that complicate traceability and elevate compliance risk for otherwise legitimate buyers. For some PGMs and specialty metals, the loss of Russian capacity from fully transparent Western supply chains has no easy short‑term substitute.

    Verdict: High and volatile risk, especially for trading houses and processors that sit close to the flows. Resilience requires a robust sanctions‑screening architecture, flexible logistics routing, and early warning systems that track political escalation around key producers. Signals to monitor in 2026 include: new sanctions packages targeting metals revenue in conflict‑affected states, any secondary sanctions aimed at third‑country intermediaries, and shifts in LME or other exchange policies around acceptability of metal from contentious origins.

    12. Export Bans, Quotas, and Local Processing Mandates in Resource States

    Export Bans, Quotas, and Local Processing Mandates in Resource States – trailer / artwork
    Export Bans, Quotas, and Local Processing Mandates in Resource States – trailer / artwork

    Export restrictions from resource‑rich states have become a normalized policy tool rather than an exception. Indonesia’s nickel ore ban and subsequent extension of domestic processing mandates to bauxite and other commodities is the template: governments use bans, quotas, and differentiated royalties to force investment into local smelting, refining, and downstream manufacturing. Similar instincts are increasingly visible in African copper and cobalt producers, and in selected Latin American jurisdictions exploring concentrate taxes or export licensing.

    For global supply chains, the issue is not just reduced ore exports, but the creation of captive value chains where foreign investors are expected to build processing capacity on terms that prioritize domestic industrial policy. Investors face pressure to accept higher capex, complex joint ventures, and evolving rules on domestic content and technology transfer. Buyers that historically sourced intermediates (like mixed hydroxide precipitate or refined nickel) from third countries must now consider exposure to in‑country processing political risk.

    Verdict: High structural risk and effectively a base‑case assumption for new resource jurisdictions considering “beneficiation” strategies. Resilience depends on mapping where export‑restriction contagion is most likely, modeling project economics under forced in‑country processing, and building relationships with policymakers early in the policy design phase. Signals in 2026: new or expanded export bans on unprocessed ores, tiered royalty schemes that strongly favor in‑country processing, and regional blocs discussing coordinated critical mineral industrial strategies.

    13. Artisanal Mining, Illicit Trade, and Enforcement-Driven Supply Shocks

    Artisanal Mining, Illicit Trade, and Enforcement-Driven Supply Shocks – trailer / artwork
    Artisanal Mining, Illicit Trade, and Enforcement-Driven Supply Shocks – trailer / artwork

    Artisanal and small‑scale mining (ASM) remains a critical but unstable source of gold, cobalt, and 3TG, especially in central and west Africa and parts of Latin America. Governments repeatedly promise to “formalize” ASM, but, as practitioners observe, many administrations “bark louder than they bite” in terms of actual resourcing and governance. The gap between rhetoric and enforcement invites illicit trade networks, money laundering, and smuggling, which in turn attract international scrutiny and sporadic crackdowns.

    For legitimate supply chains, the risk is not simply reputational contamination, but sudden enforcement waves—border closures, license cancellations, export suspensions—that disrupt flows overnight. When a government, under pressure from international partners or NGOs, decides to “clean up” ASM exports, the legal and illegal often get lumped together. Large refineries and traders may over‑correct by cutting off entire regions, further marginalizing artisanal communities while tightening global supply.

    Verdict: Medium‑to‑high risk, disproportionately affecting gold and cobalt chains with known ASM exposure. Resilience is strongest where buyers are actively involved in credible on‑the‑ground sourcing programs, can trace material to specific sites, and maintain diversified blends that limit dependence on any single high‑risk corridor. Signals to watch: new donor‑funded ASM formalization programs, partnerships between governments and refiners, and headline‑grabbing enforcement actions that may signal a broader policy shift.

    14. Traceability, Digital Passports, and Data-Heavy Compliance Demands

    Traceability, Digital Passports, and Data-Heavy Compliance Demands – trailer / artwork
    Traceability, Digital Passports, and Data-Heavy Compliance Demands – trailer / artwork

    Traceability is moving from voluntary ESG narrative to regulatory requirement. Battery passport schemes in Europe, digital product passport concepts, and responsible‑sourcing rules from exchanges and OEMs are converging on a future where each unit of strategic material carries a data trail: origin, processing route, emissions profile, and ESG credentials. The result is a substantial compliance and IT build‑out requirement across miners, traders, and processors.

    Firms that lack reliable chain‑of‑custody systems risk having otherwise saleable material treated as “non‑compliant” or relegated to lower‑value markets. Integration between mine‑site data, logistics providers, and customer systems becomes essential, and data inaccuracies can translate directly into shipment delays or contract disputes. For multi‑sourced products like cathode materials or alloy blends, the complexity compounds, as each component may carry its own regulatory attributes.

    Verdict: Medium‑to‑high risk in 2026 but a foundational requirement for long‑term market access. Resilience depends on investing early in interoperable traceability solutions, aligning data standards with key customers, and stress‑testing how operations respond when a lot is flagged as non‑compliant. Signals to monitor include: final technical specifications for EU battery and digital product passports, new responsible‑sourcing requirements from exchanges such as the LME, and convergence—or divergence—of standards across major jurisdictions.

    15. Recycling, “Waste” Classification, and Cross-Border Movement of Secondary Materials

    Recycling, “Waste” Classification, and Cross-Border Movement of Secondary Materials – trailer / artwork
    Recycling, “Waste” Classification, and Cross-Border Movement of Secondary Materials – trailer / artwork

    Recycling is often promoted as the risk‑free answer to critical mineral scarcity, but regulatory treatment of secondary materials tells a more complex story. Black mass from spent batteries, e‑scrap containing precious and technology metals, and metallurgical residues carrying cobalt, nickel, or rare earths frequently fall into ambiguous categories between “product” and “waste.” Basel Convention controls and tightened EU waste shipment rules add further friction to cross‑border movement.

    Where a shipment is classified as hazardous waste rather than recyclable product, exporters face lengthy notification procedures, consent requirements from transit and destination countries, and potential refusals that can strand material. Divergent interpretations between jurisdictions mean a material treated as a resource in one country can be regarded as problematic waste in another. For companies banking on recycled feedstock to meet ESG targets or diversify away from high‑risk mines, these regulatory frictions can derail project economics.

    Verdict: Medium‑to‑high risk that directly affects timelines and economics of circular‑economy strategies. Resilience rests on early engagement with regulators to secure clear classifications, investment in pre‑processing to reduce hazardous characteristics, and diversification of recycling locations to avoid single‑jurisdiction bottlenecks. Signals to watch in 2026: revisions to Basel listings relevant to battery and electronics materials, EU implementation of new waste shipment regulations, and moves by major economies to carve out streamlined pathways for strategic‑material recycling streams.

    Strategic Implications and 2026 Playbook

    Across these 15 risks, three cross‑cutting themes emerge. First, state intervention—from export controls to stockpiles and mandatory equity stakes—is now central to strategic materials markets. Second, regulatory and ESG compliance costs are no longer peripheral overheads; they’re shaping which assets get financed and which materials are contractible. Third, timelines for bringing new supply online in “safe” jurisdictions are structurally longer than political and corporate decarbonization targets.

    Materials Dispatch sees a practical 2026 playbook built around three pillars: diversify supply across jurisdictions and ownership structures rather than chasing single “perfect” origins; treat compliance, traceability, and decarbonization as core infrastructure for accessing premium markets and government contracts; and explicitly model government‑contract and policy scenarios—from Section 232 tariffs to Project Vault allocations—into offtake, capex, and inventory decisions. The firms that internalize policy risk as rigorously as they model ore bodies will be best positioned as strategic materials shift fully into the realm of security‑driven industrial policy.

  • Top 10 strategic materials projects likely to slip past their announced timelines

    Top 10 strategic materials projects likely to slip past their announced timelines

    Top 10 Strategic Materials Projects Likely to Slip Past Their Announced Timelines

    Forward supply plans in defense, EV batteries, grid upgrades and AI data centers all assume a wave of new strategic materials projects arriving between 2026 and 2029. In practice, many of the flagship assets underpinning those plans are colliding with resource nationalism, community resistance, and fragile infrastructure. Materials Dispatch tracks a recurring pattern: once political risk enters the critical path, commissioning dates move in multi-year increments, not quarters.

    This briefing ranks 10 high-impact projects most likely to slip beyond their announced timelines, using political risk as the primary lens. That includes direct state intervention, export controls, social license breakdowns, constitutional reform, and the “weaponization of industrial supply chains” between major blocs. Operational complexity, capex inflation, and logistics are considered, but only where they intersect with the political layer and extend real-world lead times toward the 15+ years now common in complex jurisdictions.

    Every entry follows the same structure: the asset and its status, the strategic context in global supply chains, the core bottlenecks undermining timeline guidance, and a verdict on who can realistically rely on the project and who should treat it as optional upside. The list spans copper, lithium, iron ore, rare earths, phosphates and gold-copper by-products-exactly the mix that defense, EV and grid planners are counting on to navigate a copper shortfall expected around 2026 and a rare earth landscape still ~90% dependent on China-centric processing.

    The rankings will be controversial. Several assets are heralded as “solution” projects in official critical minerals strategies and corporate roadshows. On the ground, community permits, rail corridors, or state equity negotiations tell a different story. For supply chain and compliance teams, the question is not whether these mines and plants will ever operate-most will-but whether they’ll be online in time to meet 2027-2030 offtake assumptions. On that timing, the risk profile is starkly asymmetric.

    1. Grasberg Block Cave Underground Expansion (Indonesia, Papua Province)

    Grasberg Block Cave Underground Expansion (Indonesia, Papua Province) – trailer / artwork
    Grasberg Block Cave Underground Expansion (Indonesia, Papua Province) – trailer / artwork

    The asset/risk. The underground block cave expansion of Grasberg is designed to sustain roughly 1.3 Mt per year of copper equivalent plus over a million ounces of gold, replacing the exhausted open pit. Public guidance points to a phased ramp-up completing around 2027. That now looks optimistic. A significant 2025 geotechnical incident and extended remediation have already pushed critical milestones, and the political environment is becoming more intrusive, not less.

    Strategic context. Grasberg is one of the world’s key copper hubs at a time when the global system edges toward its largest supply gap in more than two decades. High-grade Indonesian concentrate feeds smelters that ultimately supply wiring for data centers, defense electronics, power grids and vehicle harnesses. If copper does move toward the $15,000/t scenarios being modeled for late in the decade, the path will almost certainly run through what happens in Papua.

    The bottleneck. Indonesia’s resource nationalism—manifest in majority state ownership, tightening export rules and local processing mandates—means technical setbacks quickly become political bargaining chips. Each permit renewal or export approval is an opportunity for Jakarta to extract additional concessions, extend domestic smelting requirements, or revisit fiscal terms. The 2025 mud rush and safety investigations created a natural pause for regulators to reassess, effectively blending operational risk with policy leverage and dragging timelines to the right.

    The verdict. For downstream users, Grasberg remains system-critical, but as a timing anchor it’s fragile. Defense and data-center supply chains that assume a smooth 2026-2027 ramp are underestimating the probability of further slippage into 2028 and beyond, especially if Indonesia couples export permits to broader industrial policy. This project is best treated as a core volume source with high continuity risk: fine for diversified portfolios, hazardous for single-asset-dependent copper or gold strategies.

    2. Jadar Lithium-Borate Project (Serbia, Western Serbia)

    Jadar Lithium-Borate Project (Serbia, Western Serbia) – trailer / artwork
    Jadar Lithium-Borate Project (Serbia, Western Serbia) – trailer / artwork

    The asset/risk. Jadar, a large hard-rock lithium-borate deposit in western Serbia, is nominally positioned to deliver around 58,000 t/y of LCE once in production. Official narratives periodically resurface around a potential restart, with talk of a final investment decision later this decade and operations post-2028. On the ground, the project remains shelved, its environmental permits revoked after mass protests and sustained political backlash.

    Strategic context. For European battery and defense planners, Jadar was pitched as the cornerstone of a regional lithium supply chain—reducing exposure to South American brines, Australian spodumene, and Chinese conversion capacity. EU industrial strategies still reference domestic or near-European lithium as a key pillar in de-risking EV and stationary storage supply chains. Yet the EU’s ambitions sit uneasily with Serbian domestic politics and a population that has turned large-scale mining into a proxy fight over governance and environmental trust.

    The bottleneck. The core obstacle is social license translated into hard law. Protests in 2021-2022 triggered a political commitment to halt the project, followed by permit cancellations that would require a near-complete reset of the environmental and planning process. Any attempt to revive Jadar intersects with election cycles, EU alignment debates, and a regional narrative of foreign companies extracting value while locals absorb the externalities. That dynamic mirrors resistance seen in Nordic REE projects and makes linear permitting timelines unrealistic.

    The verdict. Jadar’s geology is not in dispute; the timeline absolutely is. For OEMs and cathode producers, Jadar shouldn’t be embedded into near-term supply plans; it’s more akin to a 2030s option with binary political risk. Entities with higher risk tolerance and long-duration horizons may view it as a potential strategic pivot if EU–Serbia relations deepen meaningfully. For those needing secure lithium units before 2030, Jadar is better treated as non-core upside rather than a planning anchor.

    3. Sokli Phosphate–Iron–REE Project (Finland, Savukoski)

    Sokli Phosphate–Iron–REE Project (Finland, Savukoski) – trailer / artwork
    Sokli Phosphate–Iron–REE Project (Finland, Savukoski) – trailer / artwork

    The asset/risk. Sokli, in Finland’s far north, is an ambitious integrated project combining phosphate, iron and rare earth elements. Current concepts envision around 2 Mt/y of phosphate and iron concentrates plus a still-evolving rare earth stream, with feasibility work stretching late into the decade and a staged production profile potentially into the early 2030s. Government stakeholders present Sokli as a model for secure, “clean” European critical raw materials.

    Strategic context. In phosphate, Sokli feeds straight into the food-security narrative. In rare earths, it targets the permanent magnets that underpin offshore wind, EV motors and many defense systems. Finland, with strong institutions and existing mining capability, is frequently named as a lower-risk alternative to higher-opportunity but unstable jurisdictions. However, being inside the EU also embeds Sokli in the union’s slow, heavily contested permitting culture.

    The bottleneck. The critical path isn’t geology or even capital; it’s permitting across sensitive northern ecosystems and Sámi traditional lands. EU processes offer “strategic project” fast-track branding, but in practice, court challenges and local veto points can extend decisions for years. Sokli must navigate overlapping environmental directives, climate commitments, and indigenous rights frameworks. Any misstep in stakeholder engagement risks litigation that could extend an already long 2027–2032 window toward the late 2030s.

    The verdict. Sokli is structurally attractive for European supply chains seeking low-jurisdiction-risk volumes, yet its headline schedules are best viewed as optimistic scenarios. Fertilizer producers and magnet value chains can reference Sokli for long-term diversification, but near- to mid-decade supply security shouldn’t hinge on it. The project suits corporates comfortable with EU regulatory cadence and premium costs; those requiring rapid tonnage increases may find the 15+ years lead time from discovery to full-scale production a significant constraint.

    4. Kamoa-Kakula Copper Complex Expansion (DRC, Lualaba/Katanga)

    Kamoa-Kakula Copper Complex Expansion (DRC, Lualaba/Katanga) – trailer / artwork
    Kamoa-Kakula Copper Complex Expansion (DRC, Lualaba/Katanga) – trailer / artwork

    The asset/risk. The Kamoa-Kakula complex, co-developed by Ivanhoe and Zijin in the Democratic Republic of Congo, is ramping toward a multi-phase expansion that could exceed 600,000 t/y of copper. Publicly, additional concentrators and smelter capacity are framed on a mid-to-late decade timeline, stacked on top of already impressive early-phase performance. But as the project’s scale grows, so does its exposure to the DRC’s shifting political and regulatory landscape.

    Strategic context. Kamoa-Kakula sits in a region that already supplies much of the world’s cobalt and a rising share of its high-grade copper concentrates. For battery cathodes, power infrastructure and defense systems, the complex is a core node in any realistic supply scenario. Western policy circles frequently cite it, somewhat wishfully, as a counterbalance to Chilean grade decline and Indonesian policy risk.

    The bottleneck. The DRC’s governance and infrastructure remain fragile. Road and power constraints already push logistical costs higher and raise the probability of intermittent curtailments. At the same time, political leverage increases as the mine’s global importance grows. Debates over royalties, state equity participation and export policies echo earlier cycles in neighboring copper–cobalt districts. Seismic and geotechnical events add another layer: when remediation intersects with a contentious tax audit or contract review, ramp-up schedules can slide by years rather than months.

    The verdict. Kamoa-Kakula should remain a cornerstone supplier of copper into the 2030s, but its expansion milestones are politically exposed. Smelter and power integration plans, in particular, look vulnerable to delay. Utilities, OEMs and defense contractors relying on incremental Kamoa-Kakula volumes from 2026 onward would be prudent to stress-test scenarios where the full 600,000+ t/y profile materializes closer to 2029–2030. The complex fits diversified portfolios comfortable with frontier risk; it’s less suitable as the sole backstop for critical copper exposure.

    5. El Teniente New Mine Level Expansion (Chile, O’Higgins Region)

    El Teniente New Mine Level Expansion (Chile, O’Higgins Region) – trailer / artwork
    El Teniente New Mine Level Expansion (Chile, O’Higgins Region) – trailer / artwork

    The asset/risk. El Teniente, operated by Codelco, is the world’s largest underground copper mine. The New Mine Level (NML) project is designed to sustain and eventually lift production as existing levels mature, with earlier timelines pointing to substantial contributions around 2026. That schedule has already been revised multiple times due to geotechnical challenges and cost inflation. Recent seismic impacts and remediation needs further pressure the critical path.

    Strategic context. Chile remains central to global copper supply, but its giant mines are aging, grades are falling, and water and power constraints are tightening. NML is less about massive new tonnage and more about preventing a sharp decline at a globally important asset. For downstream users, it represents a key factor in whether the copper market leans into chronic deficit or manages a softer landing as energy transition demand accelerates.

    The bottleneck. The political environment around mining in Chile has been fluid. Constitutional rewrites, debates over water rights, and demands for greater indigenous and community participation have all introduced uncertainty into project planning. As a state-owned company, Codelco also carries policy obligations that don’t always align with efficiency—local content rules, employment commitments and fiscal needs can stretch budgets and timelines. When combined with complex underground engineering, every technical setback creates an opening for regulatory re-scoping, pushing commissioning targets toward the decade’s end.

    The verdict. NML is essential for stabilizing Chilean copper output, but its timeline has drifted into the zone where “on time” is increasingly defined politically rather than technically. Industrial consumers treating NML as a firm 2026–2027 addition are likely to be disappointed. The project best suits long-term planners who assume a staggered ramp through the late 2020s and factor in periods of flat or declining El Teniente output. For those requiring near-term security, alternative sources or secondary copper recovery pathways need greater emphasis.

    6. Taiwan Rare Earth Pilot Production Line (Taiwan, Industrial Cluster)

    Taiwan Rare Earth Pilot Production Line (Taiwan, Industrial Cluster) – trailer / artwork
    Taiwan Rare Earth Pilot Production Line (Taiwan, Industrial Cluster) – trailer / artwork

    The asset/risk. Taiwan’s proposed rare earth separation and magnet-material pilot line aims to cover a significant share of domestic demand and serve as a strategic node for allied supply chains. Initial political announcements framed a roughly three-year build and commissioning window, positioning the facility for meaningful output before the end of the decade. In practice, project specifics remain opaque, and geopolitical risk overshadows technical execution.

    Strategic context. Rare earths are deeply embedded in the same systems Taiwan already leads—semiconductors, advanced manufacturing and defense electronics. For the United States and like-minded partners, a functional REE processing and magnet ecosystem in Taiwan would partially offset the ~90% dependence on China-dominated separation and magnet-making capacity. However, that strategic value automatically makes the project a pressure point in cross-Strait relations.

    The bottleneck. Two intertwined risks dominate. First, supply: the pilot line needs dependable feedstock from outside China, yet most near-term projects are themselves politically or environmentally constrained. Second, security: escalating military posturing and economic coercion—export controls on gallium, germanium and REE alloys—inject uncertainty into every stage from financing to equipment delivery. Foreign partners are wary of committing sensitive IP and capital into an asset whose continuity could be jeopardized by a blockade or sanctions regime.

    The verdict. The Taiwan REE pilot is a strategically elegant concept with a structurally fragile timeline. It’s attractive for defense OEMs and semiconductor players seeking a symbolic and practical diversification move, but its commissioning and ramp-up should be treated as contingent, not guaranteed. Entities comfortable with geopolitical tail risk may integrate it as one node in a multi-hub REE strategy. Those seeking rock-solid magnet or REE oxide volumes by 2029 would do well to base planning on projects in more secure geographies, using Taiwan’s initiative as supplemental rather than foundational.

    7. Yichun Lepidolite Lithium Operations (China, Jiangxi Province)

    Yichun Lepidolite Lithium Operations (China, Jiangxi Province) – trailer / artwork
    Yichun Lepidolite Lithium Operations (China, Jiangxi Province) – trailer / artwork

    The asset/risk. The Yichun region has become synonymous with lepidolite-hosted lithium production in China, with multiple integrated mines and chemical plants supplying tens of thousands of tonnes of LCE-equivalent per year. In recent years, capacity has been throttled by environmental clampdowns, license reviews and quota adjustments. Official communications often frame disruptions as temporary, with restarts scheduled within a few quarters. The pattern suggests a more structural politicization of the asset.

    Strategic context. China dominates both upstream lithium refining and downstream cathode production. Yichun’s lepidolite output has been an important swing capacity, especially during periods of tight spodumene supply or logistics disruptions from Australia and South America. For global EV programs and energy storage systems, the region’s output has helped smooth spot price volatility—even as it reinforced dependence on Chinese-controlled flows.

    The bottleneck. Environmental and land-use enforcement in China increasingly intersects with trade policy and strategic positioning. License expiries, quota reviews and surprise inspections can act as tools for demand management or as signaling mechanisms in broader trade disputes. Local governments balance fiscal reliance on lithium with Beijing’s push to rationalize capacity and enforce ESG standards. This makes Yichun’s operational profile highly episodic: plants can restart only to face renewed constraints once prices or diplomatic conditions change.

    The verdict. For Western or allied supply chains, expecting stable, growing volumes from Yichun over a fixed 2026–2029 horizon is no longer realistic. The asset should be viewed as a policy-variable swing producer whose future output is deliberately flexible. Cell manufacturers embedded in Chinese ecosystems can work around short interruptions; those attempting to decouple or comply with domestic-content rules in North America and Europe should treat Yichun-derived units as increasingly misaligned with their compliance and resilience goals.

    8. Simandou Iron Ore Project (Guinea, Simandou Range)

    Simandou Iron Ore Project (Guinea, Simandou Range) – trailer / artwork
    Simandou Iron Ore Project (Guinea, Simandou Range) – trailer / artwork

    The asset/risk. Simandou is one of the world’s largest undeveloped high-grade iron ore deposits, divided among consortia including major Western and Chinese players. Plans call for up to 60 Mt/y of premium ore once rail and port infrastructure are completed. Public milestones have already shifted multiple times, with first ore dates sliding under the weight of political negotiations and multi-billion-dollar capex requirements.

    Strategic context. For steelmakers, Simandou’s high-grade ore promises lower emissions per tonne of steel and diversification away from traditional suppliers. Indirectly, it matters for critical materials through its role in supplying the steel needed for wind turbines, transmission towers, naval vessels and armored systems. It’s also a test case for how emerging producers leverage “resource nationalism” in an era when both China and Western states are competing for secure raw material flows.

    The bottleneck. Guinea’s political situation remains volatile, with coups, transitional governments and periodic renegotiation of mining conventions. The state’s equity expectations, local participation requirements and infrastructure-sharing mandates have all shifted over time. Simandou isn’t just a mine; it’s an integrated mine–rail–port mega-system requiring regional coordination and long-term rule stability. Every government reshuffle or external pressure campaign reopens core questions about ownership, tariffs and access, delaying engineering decisions and contractor mobilization.

    The verdict. Simandou will almost certainly ship ore eventually; the scale is too important to remain dormant indefinitely. But treating the project’s 2020s timelines as firm is a recurring mistake. Steel and infrastructure planners should see Simandou as a 2030s volume story with intermittent, politically mediated early shipments. For critical materials strategists, it’s more relevant as a bellwether of African resource governance trends than as a near-term solution to steel or emissions challenges.

    9. Norra Kärr Rare Earth Project (Sweden, Småland)

    Norra Kärr Rare Earth Project (Sweden, Småland) – trailer / artwork
    Norra Kärr Rare Earth Project (Sweden, Småland) – trailer / artwork

    The asset/risk. Norra Kärr is a predominantly heavy rare earth deposit in southern Sweden, often highlighted in European strategy documents as a potential cornerstone for local magnet and alloy supply. Conceptual plans envisage several thousand tonnes per year of REE oxides once in operation. Despite its strategic profile, the project has been mired in permitting disputes, legal challenges and public opposition for more than a decade.

    Strategic context. Heavy rare earths—dysprosium, terbium and others—are critical for high-temperature permanent magnets in military platforms, offshore wind and advanced motors. Europe’s near-total reliance on imports refined in or through China is an obvious vulnerability. Norra Kärr’s location in an EU member state with strong rule of law and industrial capability initially looked like an ideal alignment of geology and jurisdiction.

    The bottleneck. The project sits at the intersection of environmental sensitivity, water protection, and local quality-of-life concerns. Swedish courts have repeatedly scrutinized permits and land-use plans, narrowing the legal room for large-scale open-pit or intensive processing operations in the area. At the same time, EU-level pressure to deliver domestic critical minerals has not translated into a mechanism that overrides local opposition. As a result, Norra Kärr advances on paper in strategy documents while remaining effectively stalled on the ground.

    The verdict. For defense ministries and magnet producers, Norra Kärr has symbolic value in debates over European autonomy, but limited utility as a dependable 2020s supply source. It’s more appropriately treated as a case study in how ambitious critical mineral policies collide with local environmental norms. Planning assumptions that place significant heavy REE volumes from Sweden before 2030 are out of step with the project’s legal and social reality. Alternative pathways—such as recycling, allied supply from more permissive jurisdictions, or smaller-scale Scandinavian projects with lower impact footprints—currently offer a clearer line of sight.

    10. Ahafo North Gold–Copper Mine (Ghana, Ahafo Region)

    Ahafo North Gold–Copper Mine (Ghana, Ahafo Region) – trailer / artwork
    Ahafo North Gold–Copper Mine (Ghana, Ahafo Region) – trailer / artwork

    The asset/risk. Ahafo North, operated by Newmont in Ghana, is designed primarily as a gold project with a meaningful copper by-product stream—on the order of several hundred thousand ounces of gold and tens of thousands of tonnes of copper annually at steady state. Commissioning has begun, with commercial production flagged around the mid-2020s and a planned ramp-up period over the following years. However, project economics and timelines sit within a shifting Ghanaian fiscal and social landscape.

    Strategic context. Gold’s role in defense and industrial systems is often indirect, via electronics and as a financial hedge, while copper by-product streams contribute to broader supply. For major miners, Ahafo North is positioned as part of a portfolio rebalance, offsetting declines elsewhere and supporting capital allocation across continents. Ghana has traditionally been seen as one of West Africa’s more stable mining jurisdictions, which has encouraged expectations of relatively smooth ramp-up.

    The bottleneck. Ghana’s mounting fiscal pressures and debt negotiations have driven a series of tax and royalty changes, along with greater scrutiny of local content and community benefit-sharing. Land access and resettlement near Ahafo North have already sparked tension, with local stakeholders acutely aware of the state’s need for revenue and the operator’s dependence on a stable social license. Any cost overrun or schedule slip becomes a focal point for renegotiating fiscal terms or community agreements, extending the effective ramp period and dampening the copper contribution precisely when the global market needs it most.

    The verdict. Ahafo North is unlikely to fail outright; the geology, sunk capital and operator capability all argue for eventual full production. The risk lies in a stretched, higher-cost ramp that struggles to deliver the originally marketed profile by the late 2020s. For electronics and defense supply chains, the copper tonnage is too small to be system-defining but large enough to matter for specific smelter and refiner balances. This asset best fits models that treat its copper output as helpful but non-essential, with gold-focused strategies bearing the brunt of any delay or fiscal escalation.

    Cross-Cutting Signals for Supply Chain and Compliance Teams

    Across these 10 projects, a consistent pattern emerges: political and social dynamics, rather than pure geology or engineering, now define the pace at which strategic materials enter the market. Resource nationalism in Indonesia, Guinea and the DRC, constitutional and permitting shifts in Chile and the EU, and the weaponization of industrial supply chains between major powers all converge on a single outcome—longer, more uncertain delivery timelines.

    For copper, the combination of delayed expansions at Grasberg, Kamoa-Kakula and El Teniente increases the odds that the mid-decade shortfall is deeper and longer than many baseline forecasts assume. That feeds directly into cost structures for AI data centers, grid reinforcement and defense electronics. For lithium and rare earths, the fragility of Jadar, Yichun, Norra Kärr, Sokli and Taiwan’s pilot line underscores how difficult it is to convert strategy papers into physical tonnes when local opposition, trade policy and ESG scrutiny are all intensifying simultaneously.

    From a compliance and procurement standpoint, these slipped or slipping projects have three practical implications. First, critical-materials diversification that relies on a small number of large, high-profile “solution” projects is misaligned with the observed risk profile; portfolios that blend modest volumes from multiple jurisdictions with recycling and substitution options show greater resilience. Second, jurisdictions with established legal frameworks, shorter permitting pathways and infrastructure—Canada, parts of Australia, certain US states—may deliver less spectacular ore bodies but more reliable project timing, an increasingly valuable asset in itself. Third, stockpile and buffer strategies, particularly for defense-critical materials like heavy REEs and high-conductivity copper forms, need to be calibrated to multi-year disruptions rather than quarter-to-quarter volatility.

    Materials Dispatch’s working assumption is that 15+ years lead times from discovery to stable commercial operation will remain common for complex projects in politicized jurisdictions. As a result, the projects profiled here are best understood as part of the 2030s landscape, not near-term fixes. Organizations that internalize this timing gap—adjusting contracting, qualification pipelines and risk metrics accordingly—will be better positioned when the next wave of delays rolls through the strategic materials sector.

  • Minerals Financing Pivot: How State-Backed Capital Is Rewriting Critical Minerals Markets

    Minerals Financing Pivot: How State-Backed Capital Is Rewriting Critical Minerals Markets

    Critical minerals financing is shifting from market-led project lending to state-anchored, de‑risked capital with price floors, strategic stockpiles, and long-tenor export credit. This “minerals financing pivot” will reshape pricing, offtake strategies and geopolitical risk for rare earths, battery metals and tungsten through 2030.

    Minerals Financing Pivot: State-Backed Capital, Price Floors and the New Critical Minerals Playbook

    Résumé Exécutif

    Critical minerals finance is undergoing a structural pivot: from dispersed, market-led project lending to a tightly orchestrated regime of state-backed capital, price floors, and strategic offtakes. In the span of roughly a year, the United States, European Union and multilateral lenders have rolled out a suite of tools-10‑figure credit lines (EXIM’s $10 billion Project Vault), blended-finance consortia (the $1.8 billion Orion Critical Mineral Consortium) and hard price guarantees (the U.S. Department of Defense’s $110/kg NdPr floor for MP Materials)-that effectively move critical minerals from a commodity space into an instrument of industrial policy.

    For procurement directors, traders and supply chain strategists, the immediate consequences are threefold: first, price discovery for several strategic materials is being partially socialised through state-backed floors and strategic stockpiles; second, access to long-tenor, concessional finance is increasingly conditioned on ESG, local value-add and geopolitical alignment; and third, the demand signal itself is being reshaped by AI-driven power buildouts and evolving battery chemistries. The key watch-points now are the implementation of the new FORGE framework on coordinated price references, the sustainability of U.S. price-floor arrangements in the face of cheaper Chinese supply, and how fast EU and multilateral facilities can move projects from feasibility to bankable status.

    Couverture & Attention

    The minerals financing pivot is not yet framed as such in mainstream media, but it is increasingly visible across three clusters of coverage: official government and development finance announcements, specialised policy and energy-transition analysis, and a set of adjacent technology stories that reveal how capital is being reallocated to strategic infrastructure.

    On the official side, U.S. government channels and development finance institutions have become primary narrators. The U.S. State Department’s communiqué on the February 2026 critical minerals ministerial in Washington, D.C. introduces FORGE (Forum on Resource Geostrategic Engagement) as the successor to the Mineral Security Partnership, signalling a shift toward coordinated “reference prices” and preferential trade for critical minerals. The U.S. Export-Import Bank (EXIM) and U.S. International Development Finance Corporation (DFC) have issued a stream of press releases detailing large-ticket deals such as Project Vault and financing for Serra Verde’s rare earth expansion in Brazil. The European Investment Bank (EIB) similarly uses its Global Gateway communications to highlight early-stage technical assistance for graphite and lithium projects in Africa.

    Specialised think-tank and industry analysis-such as work by the Center for Strategic and International Studies (CSIS), S&P Global and sector-focused consultancies—adds a more critical lens. CSIS underlines the depth of U.S. import dependence across dozens of critical minerals and tracks China’s overwhelming role in processing (around 61% of mined rare earth supply and 91% of processing capacity, and roughly 70% average refining share for 19 of 20 key strategic minerals), framing the new U.S. executive order on processed critical minerals as an attempt to close a structural vulnerability. Market analytics from platforms like S&P Global and Project Blue emphasise persistent premiums for non-Chinese rare earth material and the bottlenecks in bringing alternative supply online.

    Adjacent technology and energy outlets offer a complementary vantage point. A Numerama report describes how the boom in artificial intelligence is pushing U.S. tech majors to build their own off‑grid gas power plants to secure data centre electricity, raising questions about energy security and climate trade-offs. A MIT Technology Review roundtable positions 2026 as an inflection year for sodium‑ion batteries, citing lower cost and safer chemistries and touching on the implications for lithium supply chains. TechCrunch coverage of the White House push for AI firms to shoulder any electricity rate hikes documents how Microsoft, OpenAI, Anthropic and Google are committing to on‑site generation and battery investments. While these pieces do not discuss mineral finance per se, they expose the same dynamic: governments and regulators are nudging private capital to internalise the cost of strategic inputs (power, storage, critical materials) rather than relying solely on public balance sheets.

    Coverage in general business and consumer media remains thin and episodic. When it appears, it often focuses on headline numbers (“$10 billion for Project Vault”, “up to $1.6 billion for USA Rare Earth”) or on political theatre around tariffs and trade, without unpacking the longer-term shift in how critical minerals are being priced, financed and governed.

    Sentiment & Divergence (presse spécialisée vs. données officielles)

    Official communications by the U.S. administration, DFC, EXIM and EIB are uniformly upbeat, framing the new financing architecture as “unprecedented leadership” and a necessary response to China’s dominance. DFC’s CEO describes securing critical minerals as “a paramount matter of U.S. strategic interest and economic prosperity” and casts the Orion Critical Mineral Consortium as a vehicle to “establish a robust pipeline of secure critical mineral investments.” The EIB’s leadership, for its part, stresses mutual benefits for Africa and Europe, situating early-stage project support within the EU’s Global Gateway strategy.

    By contrast, specialised analysis and some trade press adopt a more cautious tone. Commentators drawing on the MP Materials-DoD deal note that the 10‑year price floor of $110/kg for NdPr oxide currently more than doubles prevailing Chinese market prices (below $60/kg, according to MP Materials and contemporaneous market data). This raises the prospect of long-term subsidy dependence and questions about how politically durable such arrangements will be if Chinese prices remain structurally lower. Policy analysis from organisations like CSIS and Columbia University underscores that government-set floors in thinly traded markets are largely untested and could distort investment signals if not carefully calibrated.

    There is also a divergence in how risk is framed. Official U.S. and EU messaging tends to present these financing tools as straightforward resilience-building measures. Analysts and some NGOs, however, highlight distributional and geopolitical risks: the potential for new forms of resource dependence (just with different lead states), the risk that price coordination under FORGE could be perceived as cartel-like behaviour by excluded producers, and the possibility that generous Western financing accelerates resource extraction in governance‑challenged jurisdictions without commensurate gains in local value-add.

    Global supply chains and financing flows for critical minerals.
    Global supply chains and financing flows for critical minerals.

    Sentiment around China is another key fault line. U.S. and European official sources cite China’s export restrictions and technology controls as justification for reshoring and friend‑shoring. External research notes that Chinese export controls introduced in April 2025 on seven heavy rare earths—later expanded in November 2025 to five more elements—have coincided with sharp price spikes: dysprosium up 168%, terbium 195% and yttrium 598% compared with April 2025 levels, according to synthesis by CSIS, China-Briefing and S&P Global. Yet some analysts warn that assuming continued Chinese escalation could lead to overbuild, stranded Western assets and a backlash from producers in the Global South who seek balanced engagement with both blocs.

    Signaux Thématiques / Glissements Narratifs

    Several deep narrative shifts are visible across the current wave of announcements and analysis. Together, they define what Materials Dispatch refers to as the “minerals financing pivot.”

    1. De la sécurité d’approvisionnement à la formation administrée des prix

    Early critical minerals policy focused on securing tonnes in the ground and long-term offtakes. The new wave of instruments explicitly targets price formation itself. The FORGE ministerial in February 2026 signalled an ambition to “establish reference prices for critical minerals at each stage of production, pricing that reflects real-world, fair-market value,” according to the U.S. Vice President’s framing reported by policy briefings. The MP Materials-DoD agreement goes further, contractually locking in a 10‑year NdPr oxide floor at $110/kg and an offtake commitment covering 100% of output from a future NdFeB magnet facility in Texas. These arrangements effectively underwrite cash flows and alter global benchmark expectations, especially for non‑Chinese supply.

    2. Du financement de projets isolés aux portefeuilles et réserves stratégiques

    Instead of backing individual mines on a case-by-case basis, governments and development financiers are building portfolios and stockpiles. EXIM’s Project Vault authorises a $10 billion direct loan to finance a strategic reserve of minerals such as cobalt and lithium, complemented by an estimated $2 billion in private capital from traders and industrial users (including Mercuria, Hartree, Traxys and suppliers to Clarios), according to EXIM’s February 2026 release. DFC’s $600 million investment into the $1.8 billion Orion Critical Mineral Consortium is deliberately structured to seed a pipeline of near‑term projects across eligible jurisdictions rather than a single flagship asset. This portfolio approach diversifies technical and political risk and creates leverage for standardising ESG and offtake terms across multiple projects.

    3. De la mine à la chaîne de valeur complète “mine‑to‑magnet”

    The Trump administration’s January 2026 executive order on processed critical minerals emphasises that “mining a mineral domestically does not safeguard the national security of the United States if the United States remains dependent on a foreign country for the processing of that mineral.” Reflecting this logic, recent deals increasingly span from extraction to refining and component manufacturing. USA Rare Earth’s announced letter of intent with the U.S. government would unlock about $1.6 billion in CHIPS Program-related funding (including $277 million in federal support and a $1.3 billion senior secured loan), plus a separate $1.5 billion private investment in public equity (PIPE), aimed at building a vertically integrated heavy rare earth value chain. MP Materials’ planned $1.25 billion magnet facility in Texas (supplemented by $200 million in state incentives) is designed to close the loop from mined concentrate in the U.S. to finished NdFeB magnets for EVs and defense systems.

    4. Du financement pur au “capital conditionnel” lié à l’ESG et à la souveraineté

    EU and multilateral initiatives are making access to capital contingent on both sustainability performance and strategic alignment. The EU’s Critical Raw Materials Act sets 2030 benchmarks of sourcing at least 10% of annual consumption from domestic extraction, 40% from EU-based processing and 25% from recycling, while limiting dependence on any single third country to 65% of imports. The EIB’s technical assistance grants of €2 million each to EcoGraf (graphite in Tanzania) and Andrada Mining (lithium in Namibia) are explicitly framed as tools to make projects “investment-ready” under Global Gateway, embedding expectations around water use, land disturbance and biodiversity (aligned with GRI 14: Mining Sector, effective January 2026). In parallel, mandatory climate and sustainability reporting under ISSB standards and the EU’s CSRD is raising the cost of financing opaque or high-impact projects, indirectly steering capital toward assets that can demonstrate robust ESG performance and transparent governance.

    The intersection of physical mining operations and large-scale financing.
    The intersection of physical mining operations and large-scale financing.

    5. De la croissance “EV‑centric” à une demande tirée par l’IA et les nouvelles chimies batteries

    Coverage around the mineral-finance nexus is increasingly shaped by two cross‑cutting demand shifts. First, AI and data centre expansion are becoming major incremental drivers of electricity, and by extension of copper, aluminium and grid‑scale storage demand. Numerama and TechCrunch document how U.S. tech giants are building dedicated power plants and committing to absorb distribution tariff hikes, often backed by new battery assets—dynamic that ties directly into Project Vault’s focus on cobalt and lithium and DFC’s support for storage-relevant minerals. Second, the MIT Technology Review roundtable on sodium‑ion batteries highlights how alternative chemistries could ease the tightest constraints on lithium and cobalt, but at the cost of introducing new sensitivities around sodium, manganese and other inputs. Market data compiled by Trading Economics show lithium carbonate at around CNY 161,750 per tonne in February 2026 (roughly 113.5% higher year‑on‑year) amid high daily volatility of about 6.4%, reinforcing the case for diversified chemistries and multi‑metal portfolios in creditors’ strategies.

    Contexte Externe (complémentaire)

    This section synthesises key external developments shaping the minerals financing pivot, based on official releases and third‑party research explicitly cited below.

    Architecture U.S. : EXIM, DFC, DoD et l’exécutif

    Executive Order & FORGE. On 15 January 2026, the U.S. administration signed the executive order “Adjusting Imports of Processed Critical Minerals and Their Derivative Products into the United States,” directing the Commerce Secretary and USTR to pursue bilateral agreements and consider price floors on processed critical minerals (White House, 2026). In February 2026, a critical minerals ministerial in Washington brought together representatives from 54 countries plus the EU and launched the Forum on Resource Geostrategic Engagement (FORGE) as successor to the Mineral Security Partnership (U.S. State Department, 2026). FORGE discussions explicitly covered coordinated floor-pricing concepts and a preferential trade zone for allied mineral supply.

    Project Vault (EXIM). In early February 2026, EXIM approved a $10 billion direct loan facility under “Project Vault” to finance a strategic stockpile of critical minerals, including cobalt and lithium, to be stored and managed in partnership with private sector firms such as Clarios, GE Vernova, Western Digital and Boeing. The total capitalisation is expected to reach around $12 billion when approximately $2 billion in private co‑financing from commodity traders and industrials is included (EXIM, 2026). The structure leverages EXIM’s long-tenor export credit capabilities to secure multi‑year supply for U.S. industrials while providing offtake visibility to mines and processors in partner countries.

    DFC and Orion CMC. The U.S. International Development Finance Corporation has emerged as a central actor. In January 2026, it closed a $600 million commitment into the Orion Critical Mineral Consortium, a $1.8 billion fund backed by Orion and Abu Dhabi’s ADQ, with a target of up to $5 billion to finance near‑term critical mineral projects in DFC-eligible jurisdictions (DFC, 2026). DFC states that it has now deployed more than $4.5 billion across six critical minerals deals over the past year, including support for Serra Verde’s rare earths expansion in Brazil (a $565 million package with an option for a minority U.S. government equity stake) and a tungsten project in Kazakhstan where EXIM has issued a $900 million letter of intent and DFC a $700 million LOI for Northern Katpar and Upper Kairakty deposits (Cove Kaz/DFC, 2026).

    Defense Production & MP Materials. Within the U.S. defense establishment, Title III of the Defense Production Act (DPA) has been mobilised to fund a spectrum of strategic minerals, from gallium and scandium to tungsten. An infographic published by the U.S. Department of Defense notes $550.4 million in FY 2025 awards for “Strategic & Critical Materials” alongside $364 million for “Kinetic Capabilities.” The July 2025 MP Materials-DoD deal is emblematic: it combines a $150 million loan and $400 million in preferred equity, a decade-long NdPr price floor at $110/kg, and a 100% offtake commitment for magnets from the planned U.S. facility (MP Materials, 2025).

    Commercial & geopolitical partnerships. U.S.-backed deals increasingly pair commercial actors in resource-rich countries with U.S. capital and offtake. In December 2025, Gécamines (DRC) and Mercuria announced a copper/cobalt joint venture with DFC support, including sale of roughly 100,000 tonnes of copper to U.S. customers in 2026 and a further 50,000 tonnes planned for Saudi and Emirati buyers (Mercuria/DFC, 2025). For tungsten, Cove Kaz and Kazakhstan’s Tau‑Ken Samruk have executed definitive agreements for deposits holding an estimated 1.4 million tonnes of WO3, with planned output of 12,000 tonnes per year—around 15% of projected global supply (Cove Kaz, 2026).

    Stratégie européenne : CRM Act, EIB Global Gateway

    On the European side, the Critical Raw Materials Act (CRMA) formalises 2030 benchmarks of 10% of annual EU consumption from domestic extraction, 40% from EU-based processing and 25% from recycling, while capping dependence on any single third country to 65% of imports (European Commission, 2023). The regulation also hard‑wires ESG considerations—including water usage, land disturbance and biodiversity—into materiality assessments for mining and processing, aligning with the GRI 14 mining sector standard effective January 2026.

    From extraction to advanced manufacturing in critical mineral value chains.
    From extraction to advanced manufacturing in critical mineral value chains.

    To operationalise these targets, EIB Global is deploying Global Gateway as a vehicle for strategic minerals. In February 2026, it signed cooperation agreements with EcoGraf (graphite, Tanzania) and Andrada Mining (lithium, Namibia), each receiving €2 million in technical assistance to move projects from feasibility to bankability (EIB, 2026). The EU’s Commissioner for International Partnerships framed these as part of a broader push to build “secure and sustainable supply chains by investing early in projects that create value locally,” underscoring the conditional nature of support on both sustainability and local beneficiation.

    Multilatéraux, Afrique et la nouvelle course aux capitaux

    The World Bank signalled a five‑fold increase in minerals and metals financing over the next five years, announced at the 2026 Mining Indaba, with an explicit focus on domestic value addition and beneficiation in African producer states. Analyses by Power Shift Africa note that this is positioned as a tool to help close Africa’s estimated $170 billion annual infrastructure and energy gap, but warn that conditionalities and governance standards will determine whether such capital translates into resilient local economies or reinforces extractive dependencies.

    Contexte chinois : contrôles d’exportation et technologie

    China’s evolving export controls and technology restrictions are the primary backdrop for Western financing moves. Research aggregated by CSIS, the International Energy Agency and others underscores that China controls the majority of global rare earth mining and an even higher share of processing capacity. Export controls rolled out from April 2025 onwards have tightened access to heavy rare earths and associated technology, contributing to sharp price spikes for selected elements. In parallel, China’s December 2023 restrictions on the export of rare earth extraction and separation technologies have limited Western firms’ ability to rapidly replicate Chinese processing capabilities, even where capital is available.

    Marchés : lithium, cobalt et structure des prix

    Lithium markets remain volatile. Trading Economics data suggest lithium carbonate prices around CNY 161,750 per tonne in February 2026, more than doubling year‑on‑year, with intraday swings averaging 6.41%. While a supply glut from projects sanctioned before 2025 has temporarily eased tightness, multiple analyses anticipate an inflection from the second half of 2026 as demand continues to grow around 12% annually through 2030, aided by factors such as Chinese VAT rebate changes and restrictions on concentrate exports from Zimbabwe.

    Cobalt spot prices on the London Metal Exchange stand at roughly $56,267 per tonne as of late February 2026 (LME, 2026), but large long-term offtake deals—such as those linked to Project Vault and DRC‑anchored JVs—are increasingly priced off bilateral formulas rather than transparent benchmarks. For rare earths, S&P Global and Project Blue report persistent premiums for non‑Chinese supply where performance, qualification and continuity are critical, particularly in NdPr‑based magnets and heavy rare earths, a trend likely to be reinforced by Western price floors and stockpiling.

    Risques / Implications / Watchlist

    Pour les directeurs achats & desks matières premières

    1. Dual price structures and opaque reference levels. With instruments like the MP Materials NdPr floor and prospective FORGE reference prices, buyers should prepare for a bifurcated pricing environment: one set of prices for state-backed, ESG‑compliant, “trusted” supply and another for broader market material, especially from China. This will complicate benchmarking and hedging. Procurement teams will need to adjust contract frameworks to accommodate floor‑and‑collar structures, conditional rebates and strategic stockpile draw‑down clauses.

    2. Competition for subsidised offtake. Government-backed deals often come with priority offtake rights for domestic or allied industries, as seen in MP Materials’ 10‑year magnet offtake to the U.S. defense ecosystem and Gécamines/Mercuria’s committed shipments to U.S. customers. Non‑favoured buyers risk being squeezed to residual volumes or shorter‑term contracts, especially in tungsten, rare earths and cobalt. Early, long‑dated commitments and participation in strategic stockpile tender processes will become differentiators.

    3. Volatility around policy shifts and legal challenges. The February 2026 U.S. Supreme Court decision striking down certain IEEPA‑based tariffs illustrates the fragility of some trade instruments. While the administration pivots to other authorities (such as Section 122 with capped and time‑limited tariffs and potential Section 301 investigations), procurement strategies built on assumed tariff differentials may need rapid revision. Contracts should incorporate policy‑change clauses and flexible sourcing options.

    Pour les stratèges supply chain & opérations industrielles

    1. Re‑routing of value chains. The financing map points to new corridors: Kazakhstan for tungsten, Brazil for rare earths, Tanzania and Namibia for graphite and lithium, and DRC for copper/cobalt under U.S.- and EU‑backed structures. Supply chain teams should map exposure not just to countries but to financing regimes—state-backed versus market-only—and stress‑test logistics, permitting and political‑risk assumptions under each.

    2. Integration of energy and minerals planning. The convergence of AI‑driven power demand, grid storage buildout and critical minerals finance suggests that plant‑level planning for energy and materials can no longer be separated. The trend of tech companies building captive power generation and storage, as reported by Numerama and TechCrunch, foreshadows similar moves by downstream industrial users to co‑invest in upstream mineral projects or strategic reserves. Cross‑functional teams will need to align power procurement, metals sourcing and capital allocation decisions.

    3. Technology path dependency. Commitments to specific battery chemistries or magnet technologies must now factor not only performance and cost but also eligibility for subsidised finance and offtake guarantees. For example, heavy reliance on lithium‑ion chemistries may benefit from Project Vault and related facilities, but emerging sodium‑ion options could offer supply security advantages where access to lithium is constrained. Diversifying technology bets and qualifying multiple suppliers across chemistries will help mitigate lock‑in risk.

    Pour les responsables conformité, ESG & reporting

    1. ESG as a gatekeeper for capital. With ISSB standards, CSRD, GRI 14 and growing enforcement against greenwashing, access to EIB, DFC, World Bank or EXIM financing increasingly depends on robust, auditable ESG performance. Compliance officers should anticipate lender‑driven demands for enhanced traceability, nature‑related risk assessment (aligned with TNFD, which already counts more than 730 adopters representing $22 trillion in assets) and third‑party assurance on climate and biodiversity claims.

    2. New disclosure exposures. Participation in strategic stockpile schemes or price‑floor arrangements may trigger additional disclosure obligations, including around state‑aid, related‑party transactions and long‑term government guarantees. Reporting teams must coordinate closely with legal and treasury functions to ensure accurate portrayal of contingent liabilities and support mechanisms in financial statements and sustainability reports.

    3. Community and governance risks in producer states. As capital accelerates into projects in the DRC, Tanzania, Namibia, Kazakhstan and others, scrutiny of community consent, labour conditions and environmental impact will intensify. Barclays estimates that nature-related risks could reduce mining earnings by up to 25% over five years; failure to manage these risks may also jeopardise eligibility for concessional finance. Strong local stakeholder engagement and alignment with emerging best practice (e.g., ICMM standards, IFC Performance Standards) will be essential.

    Pour les analystes géopolitiques & décideurs publics

    1. Emergence of a “minerals Bretton Woods”? FORGE’s ambition to coordinate reference prices and preferential trade conditions, combined with U.S., EU and multilateral financing, points toward a quasi‑institutional order for critical minerals. Analysts should watch for whether this coalesces into binding rules or remains a loose coalition, and how excluded actors—particularly China and some emerging producers—respond, including via counter‑financing or alternative trade blocs.

    2. Deep‑sea and frontier mining as policy swing factors. Research from the Stimson Center suggests that moves toward coordinated price floors and guaranteed offtakes may increase the attractiveness of deep‑sea mining and other frontier sources of cobalt, nickel and rare earths. The current U.S. administration’s openness to lowering entry barriers for seabed mineral development introduces an additional vector of geopolitical and environmental contention. Policy choices in this space will materially affect long‑term supply, ESG debates and the credibility of Western sustainability claims.

    3. Durability of allied financing commitments. Bilateral reciprocal tariff deals and investment pledges—such as reported commitments from South Korea and the EU to channel hundreds of billions into U.S.-aligned industrial projects—may be vulnerable in the absence of stable U.S. tariff authority and amid domestic political shifts. A change in administration in any major partner, or judicial constraints on executive trade tools, could weaken the underpinnings of current financing frameworks. Scenario analysis should consider partial unwinding of these commitments and its impact on project bankability.

    Notes Méthodologiques & Niveaux de Confiance

    This brief synthesises coverage from specialised technology, energy and policy outlets together with official communications from U.S. and EU institutions, development finance bodies and multilateral organisations. It is complemented by research from think tanks and market data providers on prices, trade flows and regulatory developments. The aim is to distil directional signals rather than provide a comprehensive database of projects.

    Niveaux de confiance sur les constats centraux

    • Élevé – There is a structural increase in state-backed financing and risk‑sharing mechanisms for critical minerals, including price floors, strategic stockpiles and long‑tenor export credit. Justification: Corroborated by multiple official announcements (EXIM Project Vault, DFC–Orion, MP Materials–DoD, EIB Global Gateway) and consistent policy framing in the U.S. executive order and EU CRM Act.
    • Élevé – China’s dominance in processing and recent export/technology controls are key drivers of Western financing initiatives. Justification: Quantified import dependence and Chinese market share reported by CSIS, IEA and EU documents, with explicit linkage in U.S. and EU policy statements.
    • Modéré – Coordinated reference prices under FORGE will materially reshape global benchmarks for certain minerals. Justification: Political intent is clearly stated in the critical minerals ministerial framing, but operational details and enforcement mechanisms remain undefined.
    • Modéré – Price floors such as the $110/kg NdPr guarantee for MP Materials will prove difficult to sustain politically if Chinese prices remain structurally lower. Justification: Clear price differential versus current Chinese levels; long‑term political tolerance for above‑market support is uncertain and depends on future security dynamics.
    • Modéré – The minerals financing pivot will accelerate investment into projects in Africa and Central Asia, but local value‑add and governance outcomes will be uneven. Justification: Financing deals are real and sizeable (e.g., DFC, EIB, World Bank commitments), whereas governance quality and enforcement capacity vary widely and monitoring remains limited.
    • Faible à modéré – Emerging demand drivers from AI/data centres and sodium‑ion batteries will significantly alter the composition of critical mineral demand by 2030. Justification: Early but compelling signals in technology press and expert roundtables; however, adoption curves and regulatory frameworks are still in flux.

    Readers should so treat the minerals financing pivot as a firmly established policy direction, but one whose precise market impacts will depend on implementation details, political durability and the interplay with technology shifts and Chinese policy responses.

  • China’s Antimony Export Controls and Western Supply Chain Exposure

    China’s Antimony Export Controls and Western Supply Chain Exposure

    China’s 2024-25 antimony export controls triggered a historic price spike, exposed deep Western dependence on Chinese refining, and accelerated a still-fragile push to re-shore or friend-shore supply. Materials Dispatch assesses that, despite a temporary suspension of some bans, Western defense, battery and flame-retardant value chains will remain structurally exposed at least through the late 2020s, with pricing and compliance risks amplified by transshipment workarounds and slow-to-mature alternative projects in the US, Australia and Europe.

    Executive Summary

    China’s 2024-25 antimony export controls have converted what was once an obscure minor metal into a front-line strategic lever in the techno-geopolitical contest. According to analysis by the Center for Strategic and International Studies (CSIS) and the USGS, China accounts for roughly 36-48% of global mine production but around 85% of ore processing capacity, giving Beijing a decisive choke point over a material that underpins ammunition, flame retardants, lead–acid batteries and emerging grid-scale energy storage. Export licensing and targeted bans on military end users, starting in August and December 2024, drove benchmark prices up by as much as 2,600% between mid‑2024 and late‑2025, before easing slightly but remaining at structurally elevated levels into 2026.

    For Western buyers, the episode has exposed three core realities. First, even with China’s November 2025 one-year suspension of some controls (as reported by Pillsbury Law), regulatory risk on antimony exports is now baked into the system, with a key decision point approaching in late‑2026. Second, substitution and recycling help but cannot meaningfully offset dependence in the near term: the US still imports about 82% of its antimony consumption and recycled material covers only around 15% of demand, according to the USGS Mineral Commodity Summaries 2025. Third, while non‑Chinese projects in the US, Australia and Europe are advancing-with multi‑billion‑dollar public support in some cases-the combination of mine development timelines, permitting, and processing bottlenecks means Western supply chains for defense, batteries and flame‑retardant chemicals will remain strategically exposed for the rest of this decade.

    Three signals warrant close monitoring: Beijing’s posture when the current suspension window closes in November 2026; the execution and ramp‑up of key projects such as Perpetua Resources’ Stibnite (US) and Hillgrove (Australia); and the enforcement trajectory around transshipment routes via Thailand, Mexico and European processors, which currently act as de‑facto pressure valves for Chinese-origin material but sit in the crosshairs of tightening export‑control and sanctions regimes.

    Coverage & Attention

    Open‑source coverage of antimony has bifurcated into two distinct streams. On one side, specialist commodity analysts, critical‑minerals consultancies and policy think‑tanks-such as CSIS, the US International Trade Commission (USITC), Project Blue, RFC Ambrian and Fastmarkets—have produced relatively granular work on supply, pricing and defense exposure. Their output is technical, data‑driven and closely read by metals desks and policy specialists, but largely absent from mainstream financial headlines.

    On the other side, general technology and geopolitical media have framed the story primarily through the broader lens of technological decoupling and export controls. Outlets such as Numerama and TechCrunch have focused on US–China tensions over AI chips and the Pentagon’s scrutiny of high‑risk digital suppliers, including explicit references to possible use of the Defense Production Act to secure supply chains. Gaming and hardware‑oriented media, including PC Gamer and creator channels like Bellular News, have zeroed in on chip, GPU and memory shortages driven by AI datacenter demand. In this coverage, antimony is rarely named; it appears only as part of a wider pattern in which critical resource bottlenecks—whether chips, rare earths or minor metals—are becoming normalized as a structural business risk.

    Public data and government-facing research are more explicit. The USGS Mineral Commodity Summaries (2024–2025), the USITC’s executive briefings on critical materials, and CSIS and CSET (Georgetown)’s analyses of Chinese export controls collectively map the evolution of Beijing’s antimony policy from license requirements to targeted bans and then partial suspension. European institutions are visible mainly through the EU Critical Raw Materials Act (CRMA) documentation and market overviews by IndexBox and PricePedia, which track European import dependence and price dislocation.

    Coverage of enforcement and workarounds is led by investigative business reporting. A Reuters‑sourced investigation, carried by outlets such as the Times of India, has documented substantial rerouting of antimony oxide shipments via Thailand and Mexico, with digital shipment‑vetting firm Publican characterizing the pattern of transshipment as “consistent and widespread.” This strand of coverage is crucial for compliance and legal teams, as it highlights how quickly market behavior can erode the intended effect of export controls while simultaneously increasing regulatory and sanctions risk.

    Sentiment & Divergence

    Sentiment across specialized metals analysis and industry commentary is generally alarmed but pragmatic. On the alarm side, Steve Christensen, Executive Director of the Responsible Battery Coalition, has described the situation created by China’s antimony blockade as a “national emergency” for US battery manufacturers, adding that “there are no quick solutions” and that the industry was “completely caught off guard,” as quoted by Asia Financial and OilPrice. Perpetua Resources’ CEO Jon Cherry has characterized the US response as a “whole of government approach” to bringing antimony production home, underscoring official anxiety about defense dependence.

    Market‑facing commentary is somewhat more measured. Fastmarkets cites traders stressing that “everyone wants [supply security], but antimony is not a metal you can just ramp-up overnight,” while another trader is quoted observing that “China and the US have both tried to use resources as leverage, but there’s only so much you can do… In the end, money talks and the market finds a way.” This reflects a belief on trading desks that high prices and arbitrage will eventually spur new supply and re‑routing, even if tightness persists.

    There is also divergence between policy and enforcement narratives. Publican’s CEO Ram Ben Tzion notes that Chinese firms are “super creative in bypassing regulations,” and that “having policies on paper is one thing, but actually enforcing them on the ground is an entirely different matter,” in reference to the documented rerouting of Chinese-origin antimony oxide through Thailand and Mexico. At the same time, legal analysts such as James Hsiao of White & Case emphasize that Chinese companies face potential prison sentences exceeding five years for smuggling or failing to verify end users, even when transactions occur abroad—highlighting significant legal risk at the corporate level.

    Compared to this, mainstream tech and business media are more focused on export controls in advanced chips and AI, treating antimony as part of a broader ecosystem of strategic commodities but not as a standalone story. The Pentagon’s reported willingness—covered by outlets like Numerama—to contemplate using the Defense Production Act in other high‑tech domains underlines how antimony is now emblematic of a wider shift: critical materials and digital infrastructure are both increasingly seen as national security assets rather than neutral trade goods.

    Global antimony supply chain and China’s central role
    Global antimony supply chain and China’s central role

    Thematic Signals & Narrative Shifts

    From obscure minor metal to Tier‑1 strategic chokepoint. Antimony has long been used in flame retardants, alloys and munitions, but it is only recently that it has been elevated to “critical mineral” status in policy circles. The US Department of the Interior, the Department of Defense and the European Union all list antimony as a critical mineral or Tier‑1 military metal, as summarized by the USITC. CSIS and USGS data show that in 2023 the United States consumed roughly 23,000 tonnes of antimony and imported about 82% of that, with 63% of imports originating from China. For defense applications such as armor‑piercing ammunition, night‑vision systems and infrared sensors, there are limited substitutes, sharpening the perception of strategic vulnerability.

    China’s role has shifted from dominant miner to dominant refiner‑gatekeeper. According to USGS and RFC Ambrian, global mine production in 2023 was in the 83,000–110,500 tonne range, with China providing 36–48%, Russia roughly 28% and Tajikistan 19–25%. However, China controls about 85% of global ore‑processing and refining capacity, based on RFC Ambrian and Quest Metals analysis. Chinese domestic mine output has declined from about 100,000 tonnes in 2000 to around 40,000 tonnes in 2024, while China now imports more than 65% of the antimony ore concentrate it needs, with over a third coming from Tajikistan, as reported by the World Economic Forum. This underlines that Beijing’s leverage rests less on ore in the ground and more on processing infrastructure and licensing power.

    From open trade to calibrated weaponization—and partial walk‑back. On 14 August 2024, China’s Ministry of Commerce (MOFCOM) announced export restrictions on antimony and certain superhard materials, effective 15 September 2024, adding license requirements for six antimony‑related product categories, from ore and metal to oxide and gold‑antimony smelting technologies, as documented by CSIS. On 3 December 2024, according to CSET (Georgetown University), China escalated by banning exports of antimony, gallium, germanium and superhard materials to US military users and for military end uses. Then, on 9 November 2025, MOFCOM suspended antimony export bans for one year, issuing general licenses for shipments of rare earths, gallium, germanium, antimony and graphite, as reported by Pillsbury Law. This trajectory suggests a deliberate shift to treat antimony as a dialable instrument of statecraft—tightened in moments of tension, partially relaxed under diplomatic or commercial pressure, with uncertainty now structurally embedded.

    From stable niche commodity to high‑volatility asset. Price reporting from Quest Metals, Fastmarkets and Strategic Metals Invest shows antimony prices moving from around $1,400 per tonne in July 2024 to $38,000 per tonne by September 2024—an increase of roughly 2,600%—and then reaching a record $59,750 per tonne on 4 July 2025, based on Fastmarkets data. Strategic Metals Invest cites prices around $46.70/kg (about $21,200 per tonne) in February 2026, indicating some retracement but at a multiple of pre‑crisis levels. Antimony trioxide (ATO) benchmarks in Q3 2025 illustrate geographic dislocation: IMARC Group reports prices of about $62,385/tonne in the US versus $36,257/tonne in China and over $70,000/tonne in the UK. This divergence reflects both trade frictions and the premium Western buyers are willing to pay for non‑Chinese or compliant material.

    From Chinese exports to multi‑node, compliance‑sensitive routing. Trade data compiled by Reuters and Publican show that US antimony oxide imports from Thailand and Mexico between December 2024 and April 2025 surged to 3,834 tonnes—27 times the volume from the same period a year earlier. A significant share of this came via Thai Unipet Industries, a subsidiary of Chinese Youngsun Chemicals, which reportedly shipped 3,366 tonnes to US buyers in that window. Publican’s CEO characterizes this as “consistent and widespread” transshipment of Chinese-origin material through third countries, effectively diluting the impact of China’s export restrictions while amplifying enforcement and reputation risk for Western buyers who cannot fully trace origin in complex supply chains.

    From single‑use focus to overlapping demand from batteries, defense and grid storage. Historically, USGS data show that US antimony consumption is split roughly 39% into flame retardants, 40% into metal products and ammunition, and 21% into nonmetal products such as ceramics and rubber. Asia Financial and Project Blue estimate that globally, lead–acid batteries account for about a third of demand and flame retardants roughly half. Looking forward, antimony’s role in next‑generation liquid‑metal batteries (LMBs) is emerging as a new strategic anchor: the USITC notes that US firm Ambri is developing antimony‑based grid‑storage batteries, and Perpetua Resources cites an offtake agreement with Ambri tied to over 13 GWh of capacity. This embeds antimony not only in legacy automotive and defense chains but also in the energy‑transition infrastructure that governments are prioritizing.

    External Context: Supply, Demand & Pricing Fundamentals

    Global Supply Structure

    The USGS Mineral Commodity Summaries 2024–2025 and RFC Ambrian’s 2025 antimony report converge on a picture of constrained and geographically concentrated supply. Global mine production in 2023 sat between 83,000 and 110,500 tonnes, depending on methodology. China produced roughly 36–48% of that, Russia around 28%, and Tajikistan about 19–25%. On the reserves side, CSIS analysis citing USGS data estimates global antimony reserves as: China 32%, Russia 17.5%, Bolivia 15.5%, Kyrgyzstan 13%, Australia 7%, and the US around 3%.

    Symbolic image of antimony export controls impacting global trade
    Symbolic image of antimony export controls impacting global trade

    Russia’s Olimpiada mine, a gold operation that produces antimony as a by‑product, has been a critical swing supplier. RFC Ambrian reports output of about 23.6 kt in 2018 and 27.3 kt in 2023 (roughly a quarter of global mine production), but notes that the mine is now drawing down stockpiled high‑grade ore, making future volumes uncertain. Tajikistan produced about 21,000 tonnes of antimony in 2023 (around 25% of global mine supply), sending roughly 78% of exports to China for refining, according to CSIS. Australia’s output was more modest at around 2,300 tonnes in 2023, with 86% of exports likewise flowing to China for processing.

    Outside China, smelting and refining capacity is underutilized. The World Economic Forum cites more than 60,000 tonnes per year of smelter capacity globally outside China, much of it idle or under‑fed due to insufficient upstream concentrate. This is a double‑edged sword for Western strategists: there is latent potential to ramp refined output if concentrate can be secured from mines in Russia, Central Asia, Australia or the Americas, but those feedstocks themselves are enmeshed in geopolitical and logistical constraints.

    Demand Anchors & Emerging Uses

    On the demand side, USGS 2025 data indicate that, in the US, antimony’s main uses are flame retardants (39% of apparent consumption), metal products and ammunition (40%) and nonmetal products (21%). Asia Financial and Project Blue estimate global demand around 230,000–240,000 tonnes per year, with lead–acid batteries (via antimonial lead alloys) making up roughly one‑third and flame retardants about half of total end use. The Association of Battery Recyclers notes that the US achieves a 99% collection and recycling rate for lead‑acid batteries, with 59% of US lead demand met by secondary production. Antimony is recovered alongside lead in this process, contributing to the estimated ~3,500 tonnes of US secondary antimony production, about 15% of apparent consumption in 2024 according to USGS.

    Looking forward, Ambri’s liquid‑metal battery technology, which uses antimony as a key component, is a notable source of emerging structural demand. The USITC highlights that such systems target grid‑scale storage with lower cost and longer life than lithium‑ion batteries. Perpetua Resources’ disclosures mention offtake arrangements with Ambri linked to more than 13 GWh of potential storage capacity. If even a portion of such projects commercialize at scale, antimony’s role in the energy transition will extend its importance beyond legacy applications, potentially hardening competition between defense, industrial and clean‑energy buyers.

    Price Dynamics & Regional Dislocation

    According to pricing series compiled by Strategic Metals Invest and Fastmarkets, antimony prices have undergone one of the steepest surges in the critical‑minerals complex. Starting from about $5.40/lb (roughly $11,900/tonne) in early 2024, prices climbed to $10/lb by August 2024 and around $18/lb by November 2024. Quest Metals reports a spike from roughly $1,400/tonne in July 2024 to $38,000/tonne in September 2024, while Fastmarkets records a peak of $59,750/tonne on 4 July 2025. By February 2026, Strategic Metals Invest cites prices around $46.70/kg (about $21,200/tonne), still several multiples above pre‑restriction norms.

    Product‑ and region‑specific data show even more acute dislocation. IMARC Group’s Q3 2025 antimony trioxide (ATO) price index shows US prices at roughly $62,385/tonne, China at $36,257/tonne, the Netherlands at $54,691/tonne, the UK as high as $71,587/tonne, and Japan at $57,257/tonne. PricePedia reports that China’s antimony oxide exports fell from 50,200 tonnes in 2021 (58% of global supply) to 34,200 tonnes in 2024 (47%) and then to just 6,000 tonnes in 2025 (11% of supply), an 80%+ drop in 2025. European antimony import prices climbed to about €47,000/tonne in 2025, up from around €20,000/tonne at the end of 2024, while Chinese export prices remained relatively stable at roughly €22,000/tonne, opening a substantial arbitrage window.

    This dislocation has catalyzed shifts in processing geography. Belgian firm Campine NV, for example, announced a 50% expansion of ATO production capacity at its Belgian facility in 2025, responding to surging demand and elevated margins. PricePedia notes that Belgium has emerged as a key supplier of processed antimony products to the US, leveraging imported concentrates and recycled feedstock. However, even with such moves, analysts caution that non‑Chinese capacity cannot “remotely replace China’s role” in the short to medium term.

    Market Balance & Strategic Oversight

    Project Blue and CSIS estimate that the global antimony market moved into a deficit of around 10,000 tonnes in 2024, with conditions remaining tight into 2025. Fortune Business Insights values the global antimony market at about $1.15 billion in 2025, projecting growth to $2.01 billion by 2034 at a compound annual growth rate of 5.8%. This combination of structural deficit, high prices and strategic designation has prompted “whole‑of‑government” responses in the US and EU, including stockpiling, project finance and regulatory initiatives.

    Antimony price spikes and regional price differentials
    Antimony price spikes and regional price differentials

    The US Defense Logistics Agency (DLA) reported a strategic antimony stockpile of about 1,100 tonnes as of February 2025, with a target acquisition of 700 tonnes in FY 2025, according to USGS 2025 documentation. In September 2024, Mining News North reports that the Pentagon awarded US Antimony Corporation (USAC) a contract worth roughly $245 million under the DLA to support domestic supply. Separately, in October 2024 the Department of War (DoW) announced a $43.4 million Defense Production Act Title III award to Alaska Range Resources LLC to advance on‑shore antimony trisulfide production. These steps underscore the metal’s reclassification from industrial input to strategic asset.

    Risks, Implications & Watchlist

    For Procurement & Category Managers

    Buy‑side teams in defense, chemical, battery and electronics firms face an environment where price risk, counterparty risk and compliance risk are intertwined.

    • Pricing strategy needs to assume structurally higher volatility. With antimony still trading at multiples of its 2023 levels and market deficit conditions persisting, short‑term spot exposure has become materially more dangerous. Materials Dispatch assesses that multi‑year offtake agreements, potentially anchored to non‑Chinese suppliers (where feasible), will be increasingly favored—even at premium prices—to hedge geopolitical and regulatory risks.
    • Origin traceability will shape acceptable counterparties. The Reuters/Publican findings on transshipment via Thailand and Mexico, and the role of European processors using mixed feedstock, mean that “non‑Chinese” on paper may still involve Chinese material in practice. Procurement policies will need to specify origin and processing requirements, not just vendor jurisdiction, particularly for military or regulated end uses.
    • Substitution and thrifting are limited but not negligible. For some flame‑retardant and plastics applications, partial substitution away from antimony trioxide is technically possible, but for ammunition, some optical systems and emerging liquid‑metal batteries, options are constrained. Category managers should push R&D and engineering teams for realistic substitution roadmaps, but should not build strategies on aggressive near‑term substitution assumptions.

    For Supply Chain & Operations Strategists

    Operationally, the central challenge is to re‑route and diversify supply without incurring unacceptable logistical, sanctions or quality risk.

    • Diversification will lean on a narrow club of alternative producers. Russia (Olimpiada), Tajikistan and Australia remain the principal non‑Chinese ore sources, but Tajik and Australian concentrate are already heavily tied to Chinese smelters. Hillgrove’s Australian gold–antimony project, for instance, is targeting a 2026 production start with annual output of around 5,100 tonnes of antimony and 41,100 ounces of gold equivalent, representing about 7% of global antimony demand at peak, according to Mining Weekly. That is meaningful but not transformative relative to Chinese processing dominance.
    • US domestic projects are strategically important but schedule‑sensitive. Perpetua Resources’ Stibnite Gold Project in Idaho—which Perpetua states is the only known domestic antimony source capable of meeting US defense requirements for many small arms, munitions and missile systems—has secured a non‑binding indication of up to $1.8–2.0 billion in potential financing from the US Export‑Import Bank (EXIM), and multiple Department of Defense awards. However, the company’s own Definitive Feasibility Study still places initial production in the mid‑to‑late 2020s. Any permitting delays, legal challenges or construction overruns will directly extend US dependence on foreign processing.
    • Recycling logistics merit redesign, not just volume targets. With US lead–acid battery recycling already at 99% collection, the primary gains from recycling will come from optimizing antimony recovery and aligning recycled output with downstream quality specifications. Supply chain managers should explore closer integration with recyclers and processors (e.g., European players like Campine) to secure long‑term access to secondary antimony streams.

    For Compliance, Legal & ESG Teams

    Compliance risk around antimony has moved from peripheral to central, especially for companies serving defense, dual‑use or critical‑infrastructure markets.

    • Transshipment scrutiny will intensify. The documented surge in US imports of antimony oxide from Thailand and Mexico, combined with MOFCOM rules that expose Chinese firms to heavy penalties for failing to verify end users, creates a landscape where both Chinese and non‑Chinese intermediaries are under pressure. Legal counsel James Hsiao notes that Chinese executives involved in smuggling or lax end‑use verification can face fines and prison sentences exceeding five years. Western buyers should anticipate greater documentary requirements, more frequent audits and growing reliance on digital trade‑data analytics to verify supply chains.
    • Export‑control and sanctions exposure will likely expand. As China and Western governments continue to use critical minerals and high‑tech exports as policy tools, lists of restricted end users and end uses are likely to grow. Internal classification of products containing antimony (for example, certain types of munitions, specialty optics, or high‑performance electronics) should be refreshed against current and prospective control regimes.
    • ESG narratives are double‑edged. On one hand, domestic and allied‑country projects like Stibnite, Hillgrove and European recyclers can be framed as ESG‑positive, reducing reliance on less transparent jurisdictions. On the other hand, antimony mining historically has involved significant environmental impacts. ESG and legal teams should prepare for scrutiny from both national security and environmental constituencies, particularly where projects intersect with sensitive ecosystems or Indigenous land rights.

    For Geopolitical & Policy Analysts

    For geopolitical desks, antimony sits within a broader pattern of resource leverage alongside rare earths, gallium, germanium and advanced chips.

    • China’s export‑control behavior echoes the gallium precedent. CSIS analysis of China’s 2023 gallium export restrictions shows that exports initially collapsed, then recovered partially over about a year but remained below pre‑restriction levels. The antimony sequence—tight controls, sharp price spikes, and then partial policy relaxation—appears to follow a similar script, suggesting that Beijing is calibrating rather than fully weaponizing its leverage.
    • Trump–Xi trade dynamics and the 2025 suspension matter for scenario planning. Reporting from China Briefing on the October 2025 Trump–Xi meeting at the ASEAN Summit in Busan indicates that the two sides reached a concessions framework encompassing critical minerals and technology trade. MOFCOM’s November 2025 one‑year suspension of certain antimony and other critical‑mineral export bans should be read against that backdrop. Analysts should treat November 2026, when the suspension window closes, as a key inflection point for reassessing baseline scenarios.
    • The EU’s CRMA sets a ceiling on China dependence, but not a near‑term fix. The EU Critical Raw Materials Act aims by 2030 to secure 10% of annual consumption from domestic extraction, 40% from EU‑based processing and 25% from recycling, while capping dependency on any single non‑EU country at 65% at each stage of processing. Market reports from IndexBox show that, within the EU, Slovakia, Portugal and Poland account for 97% of production, but Europe still relies heavily on imported concentrates and intermediate products, much of them linked to Chinese processing. The CRMA will shape project pipelines and funding, but its targets fall beyond the current vulnerability horizon.
    • Defense doctrine is now explicitly referencing antimony. Perpetua Resources quotes historical Congressional testimony asserting that tungsten discoveries at Stibnite, Idaho, shortened World War II by at least one year—a reminder that strategic metals have been war‑critical before. Contemporary defense statements, including DoW’s framing of antimony trisulfide as essential to munitions, suggest that future doctrinal documents and budgets will continue to single out antimony alongside rare earths as a “no fail” supply chain.

    Methodological Notes & Confidence Levels

    This brief synthesizes specialized commodity analysis, official government data and open‑source reporting. Core quantitative supply, demand and stockpile figures are drawn from the USGS Mineral Commodity Summaries (2024–2025), USITC executive briefings, RFC Ambrian’s 2025 antimony report, and market‑research outputs from Project Blue and Fortune Business Insights. Policy and regulatory developments are sourced from analyses by CSIS and CSET (Georgetown), together with legal commentaries from firms such as Pillsbury Law and White & Case. Pricing and trade‑flow insights are based on Fastmarkets, Strategic Metals Invest, Quest Metals, IMARC Group, PricePedia, IndexBox and Reuters‑sourced trade investigations.

    Materials Dispatch cross‑checked these sources where possible—for example, aligning USGS and CSIS data on US import dependence, and comparing multiple price series for consistency of direction and magnitude. Corporate disclosures and press releases from Perpetua Resources, US Antimony Corporation, Campine and others were treated as indicative for project scale and strategy, but all project timelines are subject to the usual execution risks in mining and processing.

    • High confidence — Characterization of China’s share of global antimony mine production (36–48%) and refining capacity (~85%), US import dependence (~82% of consumption, 63% of imports from China), and the existence and direction of 2024–2025 Chinese export controls and their partial suspension. These points are consistently reported across USGS, CSIS, RFC Ambrian and legal analyses.
    • High confidence — Magnitude and timing of the antimony price spike between mid‑2024 and mid‑2025, and the current elevated price range. Multiple independent pricing agencies (Fastmarkets, Strategic Metals Invest, Quest Metals, IMARC Group) corroborate the broad trajectory and order of magnitude.
    • Moderate confidence — Exact scale and composition of rerouted antimony oxide flows via Thailand and Mexico, and the prevalence of Chinese-origin material within “non‑Chinese” supply to Western buyers. Evidence from Reuters/Publican is strong but necessarily partial, and underlying customs data and corporate records are not fully transparent.
    • Moderate confidence — Projected outputs and timelines for new supply projects such as Stibnite (Perpetua Resources) and Hillgrove (Australia), and for technology deployment such as Ambri’s liquid‑metal batteries. Feasibility studies and corporate guidance provide structured projections, but mining and technology projects often face delays.
    • Low‑to‑moderate confidence — Long‑term forecasts of antimony market size through 2034 and the durability of EU and US policy targets (e.g., CRMA quotas, US stockpile goals) over a 5–10 year horizon. These are contingent on political cycles, technological substitution and macroeconomic conditions that are inherently hard to predict.

    Overall, Materials Dispatch assesses with high confidence that China’s antimony export controls have permanently altered Western supply‑chain risk calculus, even if specific restrictions are periodically tightened or relaxed. The combination of Chinese processing dominance, structural market deficit and slow alternative‑project ramp‑up implies that antimony will remain a strategically sensitive, high‑volatility input for defense, battery and flame‑retardant value chains for the remainder of this decade.