Author: Anna K

  • Tech deep dive: the role of hafnium, tantalum, and other ‘niche’ tech metals

    Tech deep dive: the role of hafnium, tantalum, and other ‘niche’ tech metals

    **Hafnium, tantalum and a small cluster of “niche” tech metals sit at the center of turbine blades, nuclear reactors and high‑reliability electronics, yet their supply is structurally fragile because refining is concentrated in a handful of hazardous, HF‑intensive plants and by‑product flows that cannot easily ramp. This tech deep dive maps the physical processes, separation technologies and regulatory constraints that actually govern availability, and explains why superalloy and electronics supply chains are exposed less to geology than to midstream chemistry and compliance risk.**

    Tech Deep Dive: The Role of Hafnium, Tantalum, and Other ‘Niche’ Tech Metals

    Hafnium, tantalum and a small group of “niche” tech metals sit awkwardly in critical minerals debates. They are often mentioned in footnotes, yet they define the temperature limits of jet engines, the reliability of defense electronics, and the neutron control of naval reactors. Market narratives usually track mine output and country shares. The technical reality is more specific: availability is governed by a handful of complex, hazardous refining flowsheets and by‑product relationships that do not respond quickly to price signals.

    This article takes a process‑first view. It examines how hafnium and tantalum are actually produced, what equipment and reagents are required, and where the true bottlenecks form along the upstream-midstream-downstream chain. It also situates them alongside other niche metals such as niobium, rhenium, scandium and yttrium, which share similar execution risks: small volumes, technically demanding separations, and tight coupling to other commodities. In effect, this is a tech deep dive: the role of hafnium, tantalum, and other ‘niche’ tech metals seen through separation chemistry, operational constraints and regulatory pressure.

    1. Why These Metals Matter Technically

    Across aerospace, semiconductors and defense, performance breakthroughs often come from trace elements measured in tenths of a percent. Hafnium and tantalum sit precisely in that category: volume is small, but design windows are narrow and specifications are unforgiving. Substitution is technically possible in some applications, but it is neither fast nor risk‑free.

    1.1 Hafnium: Grain Boundaries, Neutrons and Gate Dielectrics

    Hafnium is a classic by‑product metal. It occurs as a few percent within zircon (ZrSiO4), substituting for zirconium in the crystal lattice. Its industrial importance stems from three properties:

    • High temperature performance in superalloys: In nickel‑based and cobalt‑based superalloys, small additions of hafnium strengthen grain boundaries and improve creep resistance and oxidation behaviour at turbine inlet temperatures. This is especially important in single‑crystal and directionally solidified blades used in advanced jet engines and industrial gas turbines.
    • Exceptional neutron‑capture cross section: Hafnium’s nuclear cross section makes its alloys natural candidates for control rods in reactors, including naval propulsion systems. That use requires extremely tight control of impurities, particularly zirconium, which has very different neutron behaviour.
    • High‑k dielectric oxides: Hafnium oxide (HfO2) became the workhorse “high‑k” material in advanced CMOS gate stacks. Thin HfO2 films allow lower leakage currents at small node sizes. This use is volume‑relevant but heavily dependent on ultra‑high purity precursors.

    Across these applications, volumes are modest but quality thresholds are extreme. Superalloy producers require tight control of oxygen, nitrogen and zirconium content; nuclear‑grade hafnium requires a different impurity profile than alloy‑grade; semiconductor fabs need parts‑per‑billion level control of metallic contaminants in hafnium precursors. That combination of low tonnage and high purity is structurally difficult to manage.

    1.2 Tantalum: Charge Density and Corrosion Resistance

    Tantalum’s industrial profile is defined by two main roles: high‑reliability capacitors and corrosion‑proof components in aggressive chemical environments. It also contributes meaningfully to high‑temperature alloys, but in a somewhat more substitutable fashion than hafnium.

    • Capacitors: Tantalum powder sintered into porous pellets, anodized to form a thin Ta2O5 dielectric, delivers extremely high capacitance per volume. This is critical for space‑constrained, high‑reliability electronics in defense, aerospace, medical implants and certain automotive systems. While ceramic and aluminium electrolytic capacitors compete in many applications, tantalum remains preferred where long‑term stability and surge resistance matter.
    • Superalloys and hardmetals: Tantalum additions increase high‑temperature strength and phase stability in nickel, cobalt and iron‑based alloys. Tantalum carbides form some of the hardest known materials, blended into cutting tools and wear parts.
    • Chemical equipment: Tantalum’s resistance to most acids (especially at elevated temperature) makes it valuable for heat exchangers, reactor linings and fittings in the chemical and pharmaceutical industries.

    The critical point is reliability: for many defense and aerospace electronics, tantalum is selected less for performance on day one than for predictable behaviour on day 5,000. That makes simple material substitution much more complex than theoretical performance tables suggest.

    1.3 Other “Niche” Tech Metals in the Same Risk Family

    Hafnium and tantalum are part of a broader family of low‑volume, high‑impact metals which share similar industrial behaviour:

    • Niobium (Nb): Co‑occurs with tantalum in columbite‑tantalite ores; used in high‑strength low‑alloy steels, superconducting magnets and superalloys.
    • Rhenium (Re): Critical for some of the highest‑temperature single‑crystal turbine alloys; mainly recovered as a by‑product of molybdenum refining.
    • Scandium (Sc): Used in aluminium‑scandium alloys for aerospace and additive manufacturing; typically recovered as a by‑product from laterite or uranium streams.
    • Yttrium and other heavy rare earths: Essential in lasers, phosphors and some ceramic matrix composites.

    What unites these is not periodic table position but industrial structure: small global flows, heavy reliance on by‑products, high capital intensity in midstream refining, and significant regulatory scrutiny around either radiation or conflict sourcing.

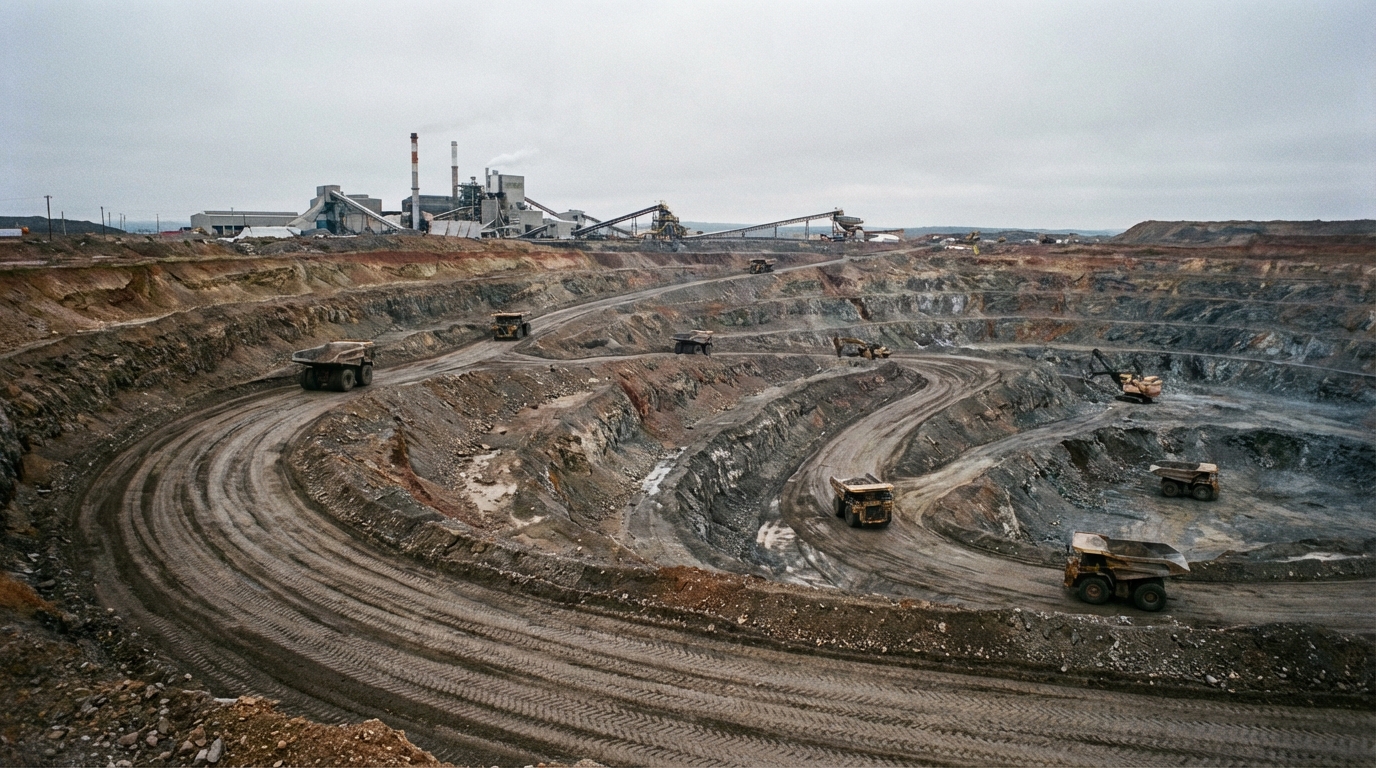
    2. Upstream Geology and Mining Constraints

    Geology is rarely the binding constraint for these metals. Resources are relatively widespread. Instead, the binding constraints are technology, co‑product economics and governance in mining jurisdictions.

    2.1 Tantalum Ores: Pegmatites, Coltan and Artisanal Flows

    Tantalum occurs mainly in complex oxide minerals such as columbite‑tantalite (“coltan”), tapiolite and various tungsten‑bearing phases. Broadly, two upstream paradigms dominate:

    • Hard‑rock pegmatites: Operations in Australia (for example, Greenbushes and Bald Hill) and parts of Brazil exploit granitic pegmatites where tantalum is either a primary target or a by‑product of lithium and tin. These mines are typically open‑pit or shallow underground operations using drill‑and‑blast, followed by crushing and dense media separation or spirals.
    • Alluvial and eluvial deposits: In the Great Lakes region of Africa (DRC, Rwanda, Burundi and neighbouring countries), tantalum is often produced from weathered pegmatites as alluvial or eluvial concentrates. A significant share has historically come from artisanal and small‑scale mining (ASM), with simple tools and minimal mechanisation.

    Hard‑rock operations tend to offer better grade control, more predictable production and easier integration with industrial ESG frameworks. ASM‑dominated supply, by contrast, brings acute compliance challenges. Conflict‑affected and high‑risk areas require supply chain due diligence under OECD guidance, and both U.S. Dodd‑Frank and EU conflict minerals regulations have tightened disclosure obligations for tantalum sourcing.

    An additional structural feature is co‑product dependence. In many pegmatite systems, tantalum is a by‑product of lithium or tin. When lithium prices drive mine planning, tantalum output becomes a secondary consideration. That decouples tantalum availability from tantalum pricing and makes forecasting supply more complex.

    2.2 Hafnium: Locked into Zirconium and Heavy Mineral Sands

    Hafnium is not mined as a standalone commodity. It is derived almost entirely from zircon, a heavy mineral found in coastal placer deposits and some inland paleoshoreline systems. These same deposits also host ilmenite, rutile and leucoxene, which are feedstocks for titanium dioxide and titanium metal.

    Upstream, heavy mineral sand operations in Australia, South Africa, Mozambique, China and a few other jurisdictions dredge or dry‑mine sand, concentrate heavy minerals by gravity and magnetic separation, and produce zircon and ilmenite concentrates. The zircon is sold into ceramics, refractories and foundry markets, or routed into zirconium chemical plants. Hafnium availability is thus structurally coupled to demand and pricing for zirconium and titanium products, not to hafnium demand itself.

    Global hafnium and tantalum supply-chain chokepoints and diversification hubs.
    Global hafnium and tantalum supply-chain chokepoints and diversification hubs.

    This coupling creates an important non‑linearity. If construction cycles or pigment markets dampen zircon demand, zircon production may fall even if hafnium prices rise. Conversely, a boom in zircon demand can generate more hafnium feedstock than midstream separation circuits are sized to handle. That is why hafnium discussions that focus purely on “ore reserves” ignore the true constraint: separation capacity and willingness to invest in small, technically demanding side‑streams.

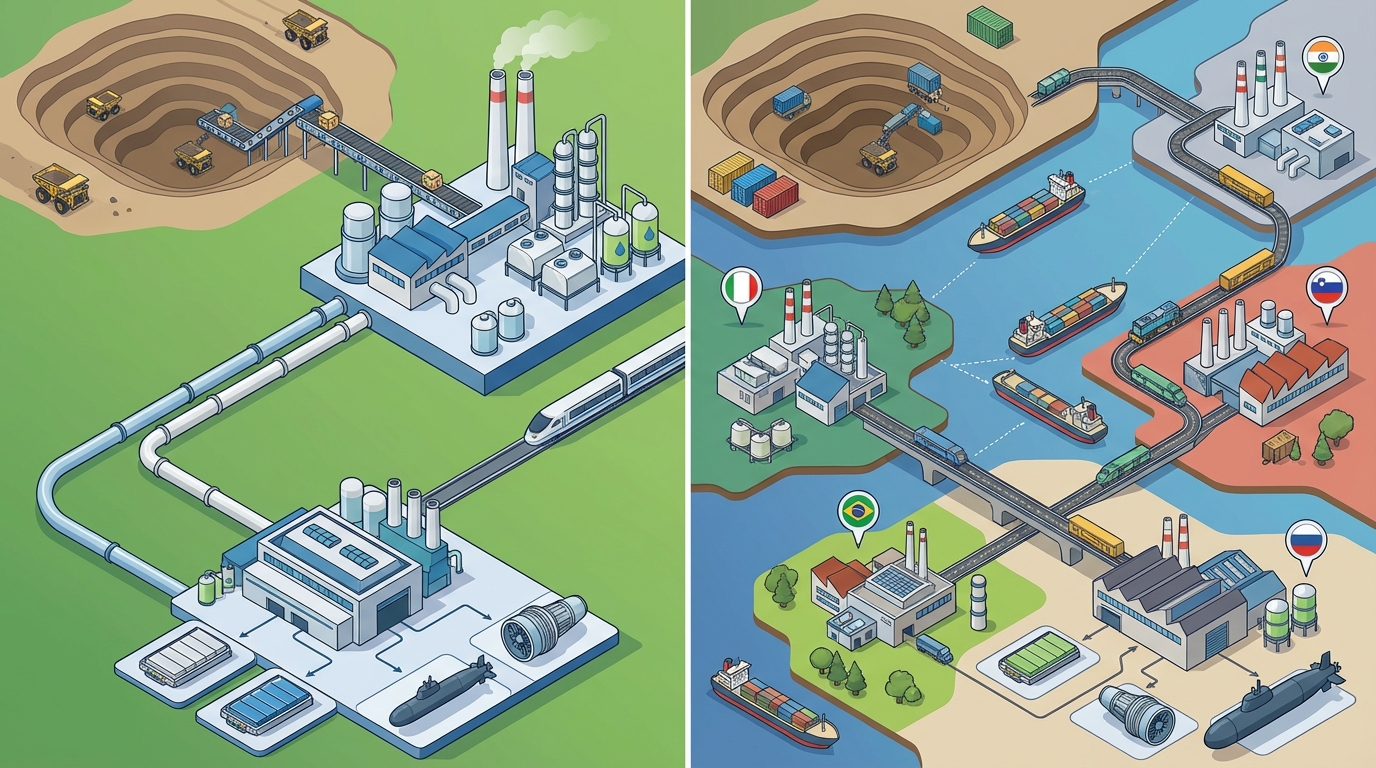
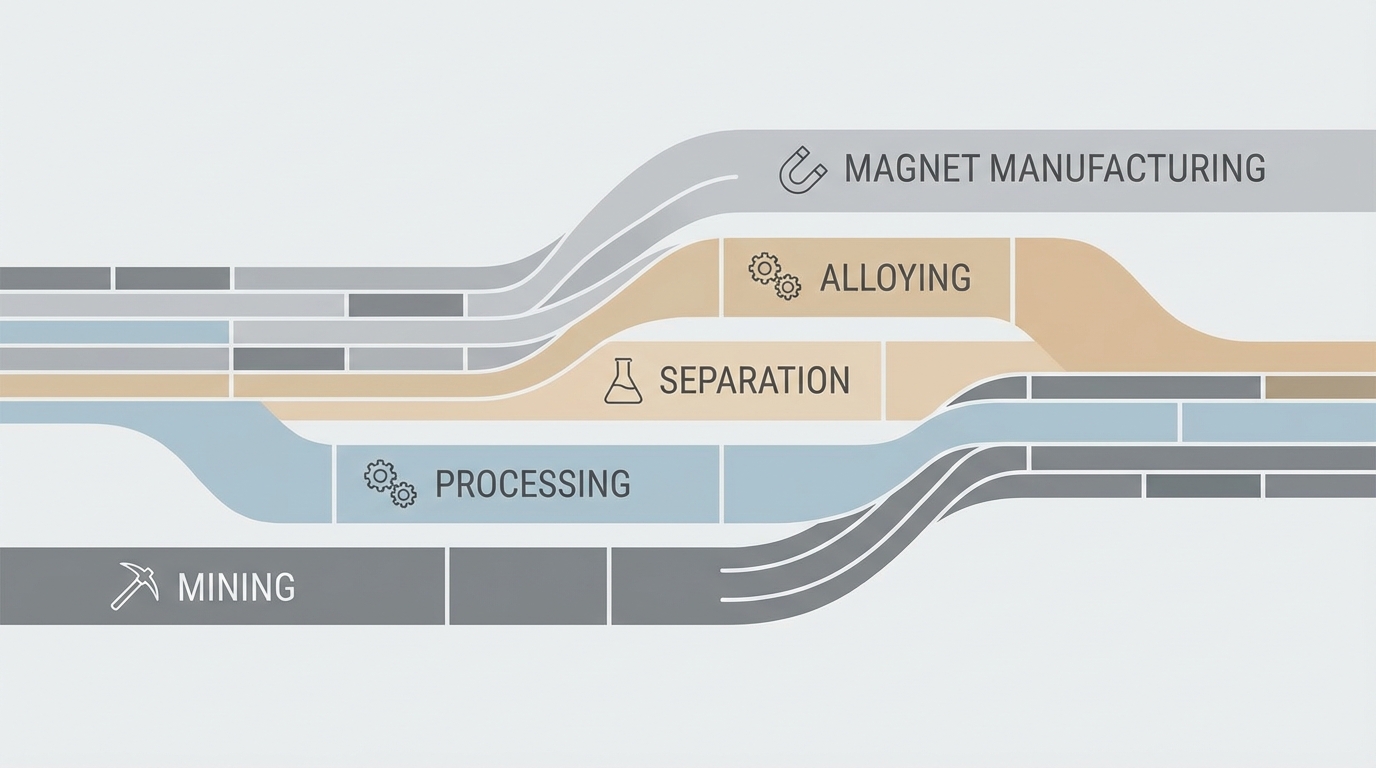
    3. Refining and Separation Technologies: Where the Real Bottlenecks Sit

    Both hafnium and tantalum owe their supply risk profile to midstream chemistry. Their primary ores are complex, refractory oxides. Extracting a saleable metal requires multiple stages of digestion, separation and reduction, often involving hazardous reagents. These flowsheets are capital‑intensive and heavily regulated, which naturally concentrates capacity into a small number of specialized plants.

    3.1 Tantalum and Niobium: Gravity, HF Chemistry and Solvent Extraction

    Industrial tantalum production can be broken into three broad stages: mineral processing, chemical separation, and metal production.

    • Mineral processing: Crushed ore or alluvial concentrate is upgraded using gravity separation (spirals, shaking tables, multi‑gravity separators) and magnetic or electrostatic separation. The goal is to produce a concentrate with elevated Ta2O5/Nb2O5 content and reject as much silica and iron as possible. Typical circuits handle throughputs from a few tonnes per hour in small hard‑rock plants to significantly higher volumes in integrated lithium‑tantalum operations.
    • Chemical digestion: The tantalum‑niobium concentrate is digested using hydrofluoric acid (HF) alone or in combination with sulphuric or hydrochloric acid. This stage produces complex fluoride species such as H2TaF7 and H2NbF7. The digestion step is highly exothermic and handled in corrosion‑resistant reactors (e.g., PTFE‑lined or tantalum‑clad equipment).
    • Solvent extraction / ion exchange: Because tantalum and niobium chemistry is closely similar, separation requires multi‑stage solvent extraction with organophosphorus extractants, or ion‑exchange resins engineered for selectivity. Dozens of extraction and stripping stages are commonplace in commercial plants to achieve high‑purity separation.
    • Oxide and metal production: After separation, tantalum is precipitated, calcined to Ta2O5, then reduced (often using sodium or aluminium) to produce tantalum metal powder or ingot. Powder is further processed (agglomeration, deoxidation, sizing) for capacitor‑grade material, typically achieving purities in the “3N” range (around 99.9%) or higher.

    Each stage has distinct execution risks. HF consumption and off‑gas scrubbing drive operating cost and environmental compliance. SX circuits with dozens of mixer‑settlers require careful hydraulic, phase separation and crud management to maintain metal recovery and purity. Reduction reactors operate at high temperatures and demand stringent safety procedures for sodium or other strong reductants. Unplanned downtime at any of these stages reverberates rapidly through capacitor powder supply.

    3.2 Hafnium: Extracting Parts per Hundred from Zirconium Streams

    Hafnium separation is an extreme case of “difficult neighbours” on the periodic table. Zirconium and hafnium share nearly identical ionic radii and chemical behaviour, yet nuclear applications require them to be separated to very low residual fractions. Industrial flowsheets so focus on maximising an inherently small separation factor through very large numbers of stages.

    • Zirconium feed preparation: Zircon concentrate is chlorinated or fused with alkali to produce zirconium tetrachloride or zirconium oxychloride. Hafnium follows the same chemistry and remains mixed through this stage.
    • Solvent extraction: Multi‑stage extraction using organophosphorus extractants (for example, tributyl phosphate or more specialised ligands) partitions hafnium and zirconium between organic and aqueous phases. Hundreds of theoretical stages may be required for stringent nuclear specifications, leading to large solvent inventories and complex plant hydraulics.
    • Hafnium purification and reduction: Hafnium‑rich streams are further purified, converted to hafnium tetrachloride or oxide, and reduced (e.g., by the Kroll process with magnesium) to sponge, then melted to ingot in vacuum or inert atmosphere furnaces. Additional remelting (electron beam or plasma) can achieve extremely low gas and metallic impurities for critical applications.

    The result is a highly specialized, small‑volume operation typically co‑located with a zirconium plant. Hafnium supply is not constrained by ore; it is constrained by the willingness of zirconium producers to invest in, permit and operate a demanding side‑stream that handles aggressive chlorides and organics for very limited tonnage. This structural reality explains why global hafnium production is concentrated in a small number of plants in a few jurisdictions.

    3.3 Energy, Water and Waste: Hidden Drivers of Capacity

    Separation technologies for both metals are energy‑ and reagent‑intensive. Although public data on kWh per tonne for individual plants is limited, several general patterns are clear:

    • Thermal steps concentrate energy use: Rotary kilns for calcining Ta/Nb oxides, chlorination furnaces for zircon, and vacuum melting systems for ultra‑high‑purity hafnium all operate at elevated temperatures and significant specific energy consumption.
    • HF and chloride management dominate environmental engineering: Fume scrubbing, wastewater neutralisation and fluoride/chloride waste handling add both capital and operating cost. Scaling up capacity implies not just more reactors, but larger treatment plants and more complex residue storage solutions.
    • Water is a hard constraint in arid regions: Gravity separation, solvent extraction and wash stages consume large quantities of water. In Western Australian pegmatite operations, for example, water balancing and recycling infrastructure can be as critical as ore grade in determining feasible throughput.

    These factors collectively explain why capacity expansions are measured in years and why idle or legacy circuits are often hard to restart. Equipment corrosion, solvent degradation and changing environmental standards mean that “nameplate” capacity on paper often overstates what can be safely and compliantly operated without substantial refurbishment.

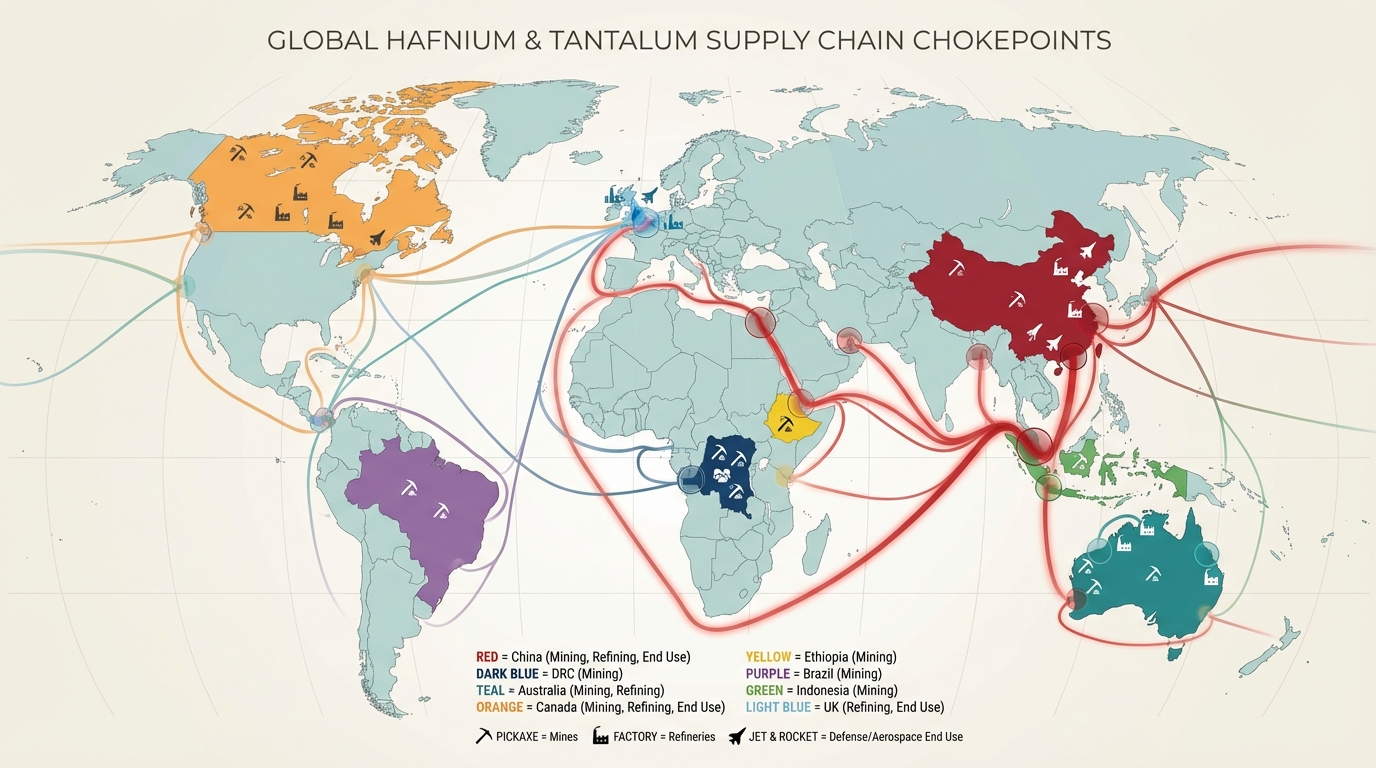
    4. Structural Chokepoints and Geopolitical Exposure

    The chokepoints for hafnium and tantalum sit mainly in the midstream: refining and separation capacity is geographically concentrated, and often controlled by a small number of firms which face tightening environmental and trade scrutiny. Upstream mining adds an additional layer of geopolitical complexity in tantalum’s case.

    Where hafnium and tantalum sit inside jet engines and advanced electronics.
    Where hafnium and tantalum sit inside jet engines and advanced electronics.

    4.1 Tantalum: Conflict Minerals, ASM and Processing Concentration

    Tantalum’s supply chain is often summarised as “Africa mines, Asia refines.” That is a simplification, but it captures two central realities:

    • Conflict‑linked ore streams: Coltan from parts of the DRC and adjoining regions has historically funded armed groups. This triggered regulatory responses such as Dodd‑Frank Section 1502 in the U.S. and the EU Conflict Minerals Regulation, which explicitly cover tantalum. Smelters handling ore from these regions now operate under extensive due‑diligence and audit regimes (e.g., Responsible Minerals Initiative protocols).
    • Concentrated refining: Chemical digestion and solvent extraction capacity for Ta/Nb is concentrated in a limited number of industrial clusters, including parts of East Asia and Europe. Many Western OEMs remain indirectly dependent on these processors even when purchasing from “clean” mine sources.

    Efforts to re‑route supply through lower‑risk jurisdictions such as Australia, Brazil and Canada have led to new or restarted pegmatite operations, including lithium‑tantalum mines where tantalum is a by‑product. However, these flows often still rely on a small set of refiners that handle HF‑based chemistry at scale. Disruptions can come from localised events (e.g., plant outages, environmental enforcement actions) just as easily as from geopolitical tensions.

    4.2 Hafnium: Small Volumes, Few Plants, High Leverage

    Compared with tantalum, hafnium’s upstream geology is less politically charged, but midstream concentration is even more pronounced. Only a handful of zirconium producers operate dedicated hafnium separation units. Some of these are in jurisdictions that are the focus of broader technology‑export debates, while others are in countries aligned with Western defense supply chains.

    Because global hafnium volumes are low, even relatively small absolute disruptions can have outsized effects on downstream users. A maintenance shutdown at a single separation plant, or a change in export licensing requirements, can tighten availability for turbine blade alloyers and nuclear component manufacturers simultaneously. In practice, large OEMs respond by qualifying multiple alloy suppliers and by building material buffers, but those buffers primarily mitigate short‑term shocks rather than structural under‑investment in separation capacity.

    4.3 Regulatory Overlays: From Conflict Minerals to Export Controls

    Both metals face an expanding overlay of regulatory attention that affects operational decisions throughout the chain:

    • Conflict minerals and due diligence: Tantalum smelters and downstream manufacturers are subject to conflict mineral reporting in major markets. This drives traceability programmes, blockchain pilots and third‑party audits. The result is a bifurcation of the supply chain: approved, auditable flows that command a premium, and marginal, often ASM‑derived flows that struggle to find compliant outlets.
    • Environmental regulation: HF use, fluoride emissions, tailings with thorium/uranium and chloride off‑gases are all under increasing regulatory pressure. Permit conditions for new plants are tighter, and older facilities often face upgrade mandates. These requirements directly affect capital budgets and timelines for any capacity expansion.
    • Export controls and industrial policy: Recent export restrictions on other niche metals such as gallium and germanium have raised awareness that similar measures could apply to hafnium, tantalum or associated processing technologies. At the same time, Western governments have launched critical mineral strategies, including funding for new Ta/Nb and Hf projects and recycling.

    The net effect is to turn what might seem like simple commodity flows into highly conditional, compliance‑loaded value chains. For materials that represent only trace weight fractions in final goods, the administrative burden is disproportionately large relative to tonnage.

    5. Technology Innovation and Diversification Pathways

    Hafnium and tantalum supply risk has triggered two broad categories of response: process innovation to make refining safer and more flexible, and demand‑side adjustments to reduce exposure. Neither category eliminates risk, but both alter the structure of bottlenecks.

    5.1 HF‑Lean and HF‑Free Flowsheets for Ta/Nb

    HF is the central hazard in conventional tantalum and niobium refining. It drives equipment cost (exotic alloys, PTFE linings), worker safety concerns, and wastewater treatment complexity. Several technology trends seek to reduce this dependence:

    • Alternative lixiviants: Research and pilot‑scale work has examined chloride‑based or alkali‑based digestion systems, where concentrates are decomposed using sodium hydroxide or other reagents, followed by selective leaching. These flowsheets can reduce HF consumption but often trade that gain for increased energy use or more complex solid-liquid separation steps.
    • Advanced ion‑exchange materials: New resin systems aim to improve tantalum/niobium selectivity at milder conditions, potentially reducing the number of SX stages. This is particularly attractive for small‑scale plants in jurisdictions with strict environmental permitting.
    • Modular refining units: Containerised or skid‑mounted circuits for small Ta/Nb streams are being explored, especially for by‑product recovery from tin and lithium operations. Modularisation helps align capital cost with the modest tonnage typical of such streams.

    From an execution standpoint, the main question is not whether such technologies exist in principle, but whether they can be run at industrial uptime and purity levels. Many flowsheets that look attractive on paper stumble at the interface between aggressive chemistry and real‑world maintenance environments.

    5.2 Hafnium: Incremental Debottlenecking and Recovery from New Streams

    For hafnium, radical new flowsheets are less visible than incremental debottlenecking and broader feed integration:

    • Debottlenecking existing plants: Upgrades to mixer‑settlers, replacement of aged solvent, improved process control and better integration with zirconium lines can yield modest increases in effective separation capacity without entirely new plants.
    • Recovery from alternative zirconium sources: Interest is growing in hafnium recovery from non‑traditional zirconium streams (for example, zirconium by‑products from nuclear fuel, or unconventional heavy mineral sands). These options often hinge on local regulatory acceptance of handling slightly radioactive or contaminated feeds.
    • Recycling: Superalloy recycling and reclaim of hafnium‑bearing scrap offer a small but strategically meaningful supplementary stream. Vacuum remelting and powder metallurgy routes can integrate recycled material with careful quality control.

    Because hafnium circuits are small, even modest improvements in recycling yields or feed integration can materially change available tonnage to aerospace and nuclear customers. The limiting factor is not always technology readiness, but rather the economic incentive to handle complex scrap and to manage its traceability.

    5.3 Demand‑Side Adjustments and Substitution

    On the demand side, engineers and materials scientists have pursued several levers to reduce exposure to fragile supply chains without sacrificing performance.

    Balancing material needs against geopolitical and trade risks in critical minerals.
    Balancing material needs against geopolitical and trade risks in critical minerals.
    • Tantalum capacitors: Higher‑capacitance ceramic capacitors, niobium‑based systems and improved circuit designs can, in some cases, reduce reliance on tantalum components. Nonetheless, in high‑reliability, high‑temperature environments, tantalum remains entrenched because of decades of field data.
    • Superalloy design: Some high‑temperature alloys have been reformulated to reduce critical element content (including rhenium and, in some cases, tantalum or hafnium) while maintaining performance through microstructural optimisation. Additive manufacturing also changes the material‑efficiency equation by reducing machining scrap.
    • Alternative high‑k dielectrics: For semiconductors, hafnium oxide remains dominant, but research into alternative high‑k materials and stack architectures continues, partly motivated by both electrical and supply considerations.

    Historical experience suggests that substitution typically reduces, rather than eliminates, demand for niche metals. Materials shift from broad use into fewer, but even more critical, roles where their unique properties are irreplaceable.

    6. Operational Implications Across the Value Chain

    From an operational perspective, the key insight is that hafnium and tantalum exposures are less about headline ore reserves and more about the interplay of by‑products, hazardous chemistry and compliance frameworks. Different segments of the value chain face distinct constraints.

    6.1 Aerospace and Defense Superalloys

    Jet engine and industrial gas turbine manufacturers rely on hafnium‑ and tantalum‑bearing superalloys for turbine blades, vanes and some hot‑section hardware. Qualification cycles for new alloys or new melt shops are long, involving extensive mechanical testing, creep data generation and, in aerospace, certification processes.

    This long qualification tail means that even when alternate alloys or suppliers are technically feasible, practical switching speed remains slow. As a result, alloy producers place significant emphasis on:

    • Secured feedstock streams from multiple refining regions to reduce exposure to any single jurisdiction or plant.
    • Scrap management and revert programmes, where offcuts and used blades are carefully segregated and recycled into new melts, capturing residual hafnium and tantalum.
    • Strategic engagement with zirconium and Ta/Nb refiners to understand capacity utilisation, maintenance plans and regulatory risks that might affect availability.

    In practice, the bottleneck often appears not at the mine or even at the metal ingot stage, but at the interface between refined metal and certified alloy production capacity, where vacuum melting and powder metallurgy lines run near full utilisation.

    6.2 Electronics, Capacitors and Semiconductor Supply Chains

    For electronics, tantalum’s main exposure is in capacitor powder and wire. The number of certified powder producers and wire mills is limited, and each is tied to particular refining circuits and ore streams. The capacitor industry has historically experienced pronounced cycles when incidents at a small number of powder plants reverberated through device pricing and lead times.

    Semiconductor use of hafnium, by contrast, hinges on chemical precursor supply rather than bulk metal. Metal‑organic and halide precursors for atomic layer deposition (ALD) require extremely high purity. Even if bulk hafnium metal is available, converting it into semiconductor‑grade precursors involves additional purification and synthesis steps, often in highly specialised facilities. Any contamination incident can force batch rejections and temporary shutdowns, amplifying the impact of upstream hiccups.

    6.3 Risk Scenarios: What Breaks First

    When assessing fragility in these supply chains, several structural failure modes recur across scenarios:

    • Disruption in HF or reagent supply: Tightening HF regulation, accidents at fluorochemical plants, or trade restrictions on specialty reagents can indirectly constrain Ta/Nb refining. Plants built around specific reagent supply chains have limited short‑term flexibility.
    • Sudden loss of a key refining site: Environmental enforcement, safety incidents or geopolitical measures targeting one large Ta, Nb or Hf separation plant can remove a significant share of global refining capacity overnight. Given the multi‑year timelines for building new SX circuits and effluent treatment, this is not easily replaced.
    • Upstream co‑product shock: Closure or curtailment of a lithium‑tantalum pegmatite, a tin mine supplying coltan‑rich tailings, or a zirconium producer facing pigment demand swings can unexpectedly tighten feedstock for tantalum or hafnium even when their own demand is stable.
    • Regulatory shock in ASM‑dominated regions: Stricter enforcement or political instability in ASM‑heavy tantalum jurisdictions can rapidly reduce ore availability that had previously flowed through semi‑formal channels.

    Historical episodes in other niche metals – such as the effect of export restrictions on gallium and germanium – illustrate how quickly downstream industries can re‑rate the risk profile of small‑tonnage materials once trade policy enters the picture. Hafnium and tantalum sit in a similar position, with the added complexity of hazardous chemistry and conflict‑linked sourcing.

    7. Conclusion: What Really Drives Hafnium and Tantalum Risk

    Hafnium and tantalum are often framed as “minor” metals, yet from a technical standpoint they are system‑critical. The analysis above highlights three structural conclusions.

    • Geology is not the primary constraint. Both metals occur in multiple regions and deposit types. The real limits are by‑product economics and midstream separation capacity built for other commodities (zirconium, lithium, tin).
    • Hazardous chemistry concentrates refining. HF‑intensive flowsheets, solvent extraction with large organic inventories and aggressive chlorination discourage a wide base of entrants. A small number of operators carry the environmental, technical and financial burden, creating natural chokepoints.
    • Compliance frameworks reshape trade flows. Conflict‑mineral rules for tantalum and tightening environmental standards for both metals mean that not all theoretical supply is practically accessible to high‑reliability end‑users.

    For aerospace, defense and advanced electronics supply chains, hafnium and tantalum risk is therefore best understood as a question of process infrastructure and regulatory exposure, not just tonnes in the ground. Materials Dispatch continues to track weak signals that can disproportionately affect these metals: changes in HF regulation, new Ta/Nb flowsheet announcements, shifts in zirconium plant investment, and any move to extend export controls to additional niche tech metals.

    Note on Materials Dispatch methodology Materials Dispatch integrates open‑source policy monitoring (including trade and export announcements by agencies such as MOFCOM and Western trade authorities), production and trade data from geological surveys and customs statistics, and close reading of end‑use technical standards in aerospace, nuclear and electronics. This triangulation focuses less on headline tonnages and more on the specific process steps and qualification bottlenecks that actually constrain industrial continuity.

  • How to integrate strategic materials risk into s&op and fp&a

    How to integrate strategic materials risk into s&op and fp&a

    In electronics, battery, aerospace, and automotive programs, strategic materials such as rare earth elements (REEs), lithium, cobalt, and platinum group metals (PGMs) now drive production feasibility as much as demand. Material shortages have already triggered 20-50% cost spikes in several segments, while the International Energy Agency (IEA) projects a significant cobalt deficit by 2025 and notes that China supplies around 60% of global dysprosium for magnets. Many planning teams have responded by integrating these risks directly into Sales & Operations Planning (S&OP) and Financial Planning & Analysis (FP&A) cycles.

    The following framework describes how organisations are operationalising that integration, what has worked in practice, and where failure modes tend to appear.

    Operational Attention Points & Signals to Watch

    • Key tradeoffs: Higher resilience (often cited at 15-25% disruption reduction) versus increased inventory holding (commonly 5-10% higher) and longer qualification timelines for alternative sources.
    • Critical risks: Hidden Tier‑2/3 dependencies, concentration of supply in a single jurisdiction, and over-reliance on a small number of refineries or separation plants.
    • Failure modes: Static “once-a-year” risk registers, S&OP and FP&A using different assumptions, and mitigation plans not tested against actual disruption scenarios.
    • Indicators to watch: New export controls or quotas on REEs and battery metals, changes to critical minerals lists (U.S., EU, Japan), major mine or refinery incidents, and revisions to IEA/USGS outlooks.
    • Governance signals: Existence of a cross-functional risk board, joint KPIs across supply chain and finance, and automated external data feeds rather than manual tracking.

    1. Map Strategic Materials Exposure Across the Value Chain

    Integration typically starts when planners discover that a disruption does not originate at a Tier‑1 supplier, but several layers upstream. A common example has been neodymium or dysprosium shortages that surfaced as delivery delays at a magnet fabricator, only later traced back to a constrained separation plant in China or to policy moves affecting concentrates.

    1.1 Identify High-Impact Materials in the Portfolio

    Teams usually classify “strategic” materials based on a mix of technical and supply criteria:

    • Function-critical role: Materials whose absence halts assembly or dramatically degrades performance, such as NdFeB magnets in EV drive motors, cobalt in high-nickel cathodes, or PGMs in aerospace turbines and autocatalysts.
    • Limited substitution: Where redesign to another chemistry or alloy would be complex, heavily regulated, or multi-year in validation (e.g., palladium to platinum substitution in catalysts, or LFP vs NMC in battery packs).
    • Concentrated supply base: Exposure to materials dominated by a few mining regions or processors. Examples often cited include REEs concentrated in China, cobalt in the Democratic Republic of Congo, and certain PGMs in Southern Africa and Russia.
    • High demand-growth pressure: Metals flagged by IEA and others as facing structural deficits, such as cobalt (with a projected deficit of around 30% mid-decade) and select REEs.

    The output is usually a shortlist of strategic materials per business line, tagged to specific products, platforms, and revenue streams.

    1.2 Trace Tiered Supply and Logistics Paths

    Once priority materials are known, organisations extend the classic S&OP bill-of-materials view upstream:

    • Link finished products to subcomponents (e.g., motors, catalysts, chips).
    • Map those subcomponents to critical materials (NdPr, Dy, Li, Co, PGMs, high-purity alumina, etc.).
    • Identify Tier‑1 and, where feasible, Tier‑2/3 suppliers, including mining and refining locations.
    • Overlay transport corridors, ports, and choke points.

    In practice, teams sourcing magnets from non-Chinese suppliers such as Lynas Rare Earths or MP Materials have often discovered that while oxide supply was diversified, downstream alloying or magnetising still depended on facilities in China. Similar patterns appear in lithium chains involving Australian miners like Pilbara Minerals or Albemarle, with conversion and cell production tied into Chinese or other Asian hubs.

    1.3 Typical Failure Modes in Exposure Mapping

    Several recurring issues have appeared across programmes:

    • Incomplete Tier‑2/3 visibility: Suppliers report country of origin as the smelter location rather than the mine, masking sanctions or conflict-region exposure.
    • Static documentation: Supply chain maps built as one-off projects, not incorporated into S&OP master data and so outdated within months.
    • Disconnected compliance: ESG or conflict-mineral reports collected for audits, but not linked into planning models that drive sourcing and capacity decisions.

    Programmes that have embedded this mapping into master data, compliance workflows, and supplier portals generally report fewer surprises when disruptions occur.

    2. Bring Strategic Materials Risk into the Monthly S&OP Cycle

    Once exposure is visible, the next step observed in practice is tagging material risk directly onto demand and supply plans. The aim is not to create a parallel “risk process” but to let S&OP scenarios reflect which volumes are structurally fragile.

    Visualizing strategic materials risk across the end-to-end supply chain.
    Visualizing strategic materials risk across the end-to-end supply chain.

    2.1 Risk-Tagged Demand and Supply Plans

    S&OP teams increasingly add strategic-material attributes to product families and supply nodes:

    • Demand side: Forecasts for EV models, data-centre hardware, or aero engines carry tags for their reliance on lithium, Ni-rich chemistries, REEs, or PGMs.
    • Supply side: Supply plans distinguish volumes coming from higher-risk jurisdictions or single points of failure, such as one refinery or one separation plant.
    • Risk metrics: Each material-route combination carries scores for likelihood, impact, and velocity (speed at which disruption translates into lost production).

    During monthly S&OP meetings, planners can then highlight, for example, that the next quarter’s magnet demand for a new e‑axle programme is 80% exposed to dysprosium sourced from a single country that already supplies around 60% of global Dy used in magnets.

    2.2 Scenario-Based Balancing of Demand and Supply

    Rather than a single “constrained plan,” many organisations now run multiple S&OP scenarios incorporating strategic materials risk:

    • Base case: Assumes current supply portfolios hold, with moderate disruption probabilities.
    • Adverse case: Reflects downside events such as export restrictions on specific REEs, energy rationing in refining hubs, or enforcement shifts in the U.S. Inflation Reduction Act (IRA) and EU critical raw materials regulations.
    • Substitution/reallocation case: Tests whether production can shift to chemistries or product mixes that rely less on constrained materials (e.g., LFP-heavy mix for batteries, different PGM loadings in catalysts).

    In one aerospace example, planners discovered during scenario runs that a relatively small increase in PGMs safety stock dramatically reduced the risk of grounded aircraft, whereas diversifying to an additional supplier would have taken years of qualification. That kind of insight rarely emerges without explicit risk-tagged S&OP simulations.

    3. Translate Material Risk into FP&A Models

    Embedding risk in S&OP creates operational visibility, but finance teams still require a way to translate it into budgets, cash-flow forecasts, and project economics. This is where probability-impact scoring, Monte Carlo simulations, and risk-adjusted scenarios enter FP&A routines.

    3.1 Probability-Impact Scoring and Monte Carlo Simulation

    FP&A teams commonly maintain a register of strategic materials with estimated disruption probabilities and financial impacts. Typical inputs include:

    • Supply deficits and demand growth: For cobalt, analysts frequently refer to IEA forecasts signalling a deficit of around 30% mid-decade under certain scenarios.
    • Price and basis-risk volatility: Historical volatility during past disruptions, such as PGMs spikes linked to labour unrest or sanctions.
    • Volume-at-risk: Percentage of annual output exposed to high-risk jurisdictions or single-source refiners, derived from S&OP exposure mapping.

    These parameters feed into Monte Carlo runs or discrete downside scenarios. The output is a distribution of potential margin, EBITDA, or cash-flow outcomes rather than a single forecast. Some organisations then calculate risk-adjusted net present values for major projects (for example, new cell plants, magnet lines, or recycling capacity) by explicitly including the probability of material constraints.

    High-level framework for embedding materials risk into S&OP and FP&A cycles.
    High-level framework for embedding materials risk into S&OP and FP&A cycles.

    3.2 Linking Risk Outputs Back to Planning Decisions

    What distinguishes mature practices is not the sophistication of the model, but the way results are fed back into operational decisions:

    • S&OP inputs: FP&A provides bands for “risk-adjusted available supply” by material, which S&OP uses when approving demand plans and allocations between customers or regions.
    • Inventory strategy: Analysis often supports holding 3–6 months of safety stock for the highest-risk materials. One battery manufacturer quantified that holding an additional 1,000 MT of NdPr equivalent, at an illustrative $80/kg, implied roughly $50M of working capital.
    • Capital allocation: Risk-adjusted scenarios highlight where nearshoring, diversification, or recycling could change the distribution of outcomes, supporting board-level discussions.

    For example, several OEMs have modelled the impact of incorporating more recycled material through partners such as Li‑Cycle or PGM recyclers like Heraeus, observing that even modest secondary feedstock shares can materially reduce downside tails in the distribution.

    4. Align Mitigations Across Procurement, S&OP, and FP&A

    Mitigation levers-diversification, nearshoring, buffers, design changes, and recycling-only reduce risk when they are consistently reflected in both operational and financial plans. Fragmented responses are a frequent cause of disappointment.

    4.1 Diversification and Nearshoring Tradeoffs

    Procurement-led initiatives have included:

    • Geographic diversification of lithium supply across Australian and South American sources, with processing partly shifted to North America or Europe.
    • Alternative REE chains using miners and separators like Lynas and MP Materials to reduce reliance on a single country, even when some magnet manufacturing still sits in East Asia.
    • Mixed PGM sourcing between South African producers such as Sibanye-Stillwater and Russian entities like Nornickel, sometimes complemented by higher recycling intake.

    FP&A teams usually model these strategies as portfolios of supply routes, each with distinct disruption probabilities, compliance profiles (e.g., IRA-eligible, EU-critical compliant), and working-capital implications. S&OP then incorporates these portfolios when approving allocation and capacity plans.

    4.2 Buffers, Substitution, and Recycling

    Other levers are more operational but still have strong financial effects:

    • Tiered safety stocks: Higher buffers for the riskiest REEs and PGMs, lower for more diversified metals, with inventory levels reviewed quarterly as risk scores evolve.
    • Design and substitution roadmaps: For instance, some EV programmes maintain optionality between nickel-rich and LFP chemistries, while catalyst makers work on PGM thrift or rebalancing between platinum and palladium.
    • Recycling integration: Firms such as Li‑Cycle in batteries or Heraeus in PGMs feature as strategic partners in S&OP and FP&A plans, providing a secondary stream that is less exposed to primary mining disruptions.

    In one consumer electronics example, alignment between procurement, S&OP, and FP&A enabled a major OEM, similar to Apple, to accelerate the use of recycled REEs in speakers and haptics. The result, as reported internally, was not only reduced primary dysprosium exposure but also smoother quarterly planning, since recycled inputs proved less correlated with geopolitical shocks.

    5. Governance, Data, and Automation

    Early integration attempts often faltered because they relied on ad hoc heroics or one-off analysis projects. More stable approaches share three elements: governance, consistent metrics, and automated data feeds.

    Linking mine and logistics disruptions to financial and operational planning.
    Linking mine and logistics disruptions to financial and operational planning.

    5.1 Cross-Functional Risk Board and Joint KPIs

    Organisations that have institutionalised this work typically operate a cross-functional risk board bringing together S&OP, FP&A, procurement, engineering, and sustainability. The board reviews a concise set of joint indicators, such as:

    • Material-related disruption downtime as a percentage of total production time (with many aiming to keep this below low single digits).
    • Variance of material-related spend against planned ranges (often targeted within a 10% band, depending on volatility).
    • Share of volume sourced from high-concentration jurisdictions for each strategic material.
    • Share of recycled or secondary material in total supply for relevant metals.

    These metrics keep discussions anchored in system-level outcomes rather than siloed cost or availability concerns.

    5.2 External Data Feeds and Early-Warning Indicators

    Another discovery in many programmes has been the importance of data timeliness. Annual reports from USGS or IEA provide strategic context, but disruptions in REEs, cobalt, or PGMs often unfold over weeks or days.

    • Automated feeds: Some firms have connected planning dashboards to structured data from USGS, IEA, customs statistics, and curated news wires, feeding into risk scores almost in real time.
    • Event triggers: S&OP and FP&A models often include triggers for re-running scenarios when major events occur-new export controls, sanctions, mine accidents, or abrupt shipping bottlenecks.
    • Vendor intelligence: Larger OEMs maintain structured dialogues with key suppliers such as Albemarle, Ganfeng, Lithium Americas, Lynas, Sibanye-Stillwater, and specialist recyclers, integrating qualitative forward views into planning cycles.

    Experience from 2020–2024 suggests that organisations with this kind of monitoring in place tended to re-plan earlier during shocks, accepting temporary working-capital increases in exchange for reduced lost-volume risk.

    6. Summary of Observed Outcomes and Open Questions

    Across battery, aerospace, and advanced manufacturing sectors, integrated approaches to strategic materials risk have produced a few consistent patterns:

    • Embedding material risk identification into monthly S&OP cycles, rather than treating it as a separate “risk project,” has made production and allocation decisions more realistic and defensible.
    • Translating exposure into FP&A models using probability-impact scoring and Monte Carlo simulation has clarified the financial stakes of choices such as diversification, nearshoring, and recycling investments.
    • Coordinated mitigations—diversified sourcing, tiered safety stocks, design options, and secondary feedstock—have tended to deliver resilience gains often cited in the 15–25% range, albeit with 5–10% higher inventory holding and some delay from qualification and compliance work.
    • Governance via a cross-functional risk board, with a limited set of shared KPIs and automated external data feeds, has helped avoid siloed reactions and stale risk assessments.

    Open questions remain around how aggressively to pursue nearshoring when local capacity is still immature, how to balance long-term offtake-like commitments with flexibility, and how quickly recycling technologies can scale in REEs, lithium, and PGMs. Nonetheless, integrating strategic materials risk into S&OP and FP&A has shifted the discussion from reactive firefighting toward structured tradeoff management between resilience, working capital, and compliance in an increasingly constrained materials landscape.

  • Weekly dispatch #6: elections, coups, and policy volatility in key jurisdictions

    Weekly dispatch #6: elections, coups, and policy volatility in key jurisdictions

    Executive summary

    Political events in early 2026 are materially altering risk profiles across rare earth and strategic metal supply chains. U.S. election-driven industrial policy, renewed Chinese export controls, and localized coups in Myanmar and the DRC have elevated heavy rare earth (HREE) disruption risk while accelerating onshoring efforts. The market impact is concentrated on a handful of high‑criticality assets: Mountain Pass (MP Materials), Kachin HREE projects, Lynas Kalgoorlie, Chinese GanZhou clusters and emerging U.S. separation capacity in Fort Worth.

    • Immediate change: Political volatility has converted a structural HREE tightness (20-30% shortfall outside China) into episodic supply shocks for dysprosium/terbium‑heavy supply chains.
    • Why it matters: Defense applications (permanent magnets, optics) and high‑temperature industrial uses face substitution limits; sourcing shifts create compliance and logistics complexity.
    • Near‑term risk: Coup‑related shutdowns (Kachin, parts of DRC) create acute 0% output scenarios; Chinese licensing windows (30-60 days) and export list expansions amplify just‑in‑time fragility.
    • Signals to watch: Feb 2026 China‑U.S. truce decisions, U.S. midterm outcome (Q3 2026 policy continuity), MOFCOM license turnaround times, and physical stockpile movements.

    What changed and why it matters

    Three political vectors converged in early 2026 to raise execution risk across strategic metals chains. First, U.S. domestic policy acceleration after the 2024/2025 election cycle has underwritten onshore capacity (Mountain Pass expansions; a Fort Worth separation plant) and direct Department of War (DoW) support for offtake and reserves. Second, Beijing expanded export controls in 2026 to include additional HREEs, and license processing remains a multi‑week bottleneck for international buyers. Third, regional coups and separatist actions (notably in Kachin State, Myanmar, and political turmoil in parts of the DRC) have halted high‑grade HREE production and disrupted logistics corridors to Chinese processors.

    Top exposures and operational notes

    MP Materials’ Mountain Pass (California) and Lynas’ Kalgoorlie (Western Australia) surface as the most resilient sources from an uptime and compliance standpoint. Mountain Pass reports 40,000 MT/year REE oxide capacity (ramping plans to 60,000 MT by late 2026) and a DoW equity/offtake framework that secures output at a premium; this reduces reliance on Chinese processing but raises procurement cost and lock‑in considerations.

    Global map of key rare earth and strategic metal jurisdictions with elevated political risk.
    Global map of key rare earth and strategic metal jurisdictions with elevated political risk.

    Kachin HREE projects (Myanmar) represent outsized supply risk: pre‑coup development claimed ore grades above 5% HREE and potential to be the largest non‑Chinese dysprosium source, but access and output have fallen to zero after January 2026 disruptions. Chinese processors and exporters (Shenghe and border operations) remain pivotal nodes, yet trucking route closures and MOFCOM re‑export controls have cut logistics flows by an estimated half in affected corridors.

    China’s GanZhou cluster continues to supply the majority of HREE volume and has moved more elements into an export‑controlled list, lengthening approval times and squeezing just‑in‑time magnet and aero supply chains. New U.S. separation capacity in Fort Worth and planned Australian expansions (Kalgoorlie, Nolans, Eneabba) offer alternative sourcing with higher operating costs and longer ramp timelines.

    Illustrated supply chain from rare earth mines to defense and clean energy applications, with visible points of disruption.
    Illustrated supply chain from rare earth mines to defense and clean energy applications, with visible points of disruption.

    Operational tradeoffs and supply‑chain impacts

    Three tradeoffs dominate current modelling: 1) supply security versus unit cost-U.S./Australian sources provide policy‑backed availability but at reported premium multiples versus Chinese processing; 2) grade versus stability-high‑grade Myanmar/DRC deposits offer material concentration advantages but carry near‑term blackout risk; 3) scale versus approval latency-Chinese refiners provide scale and efficiency but create exposure to licensing delays (30-60 days) and export list changes.

    Signals to monitor

    • Feb 2026: outcome of the China‑U.S. truce window and any extension of export relief.
    • Q3 2026: U.S. midterm political control and continuation of DoW offtake/subsidy programs.
    • MOFCOM license processing times and any further expansion of restricted HREE lists.
    • Physical restoration of access to Kachin sites and port/trucking corridor reopenings in Myanmar and eastern DRC.

    Operational metrics to watch quantitatively where available include facility uptime, reported output (MT/month) from Mountain Pass and Lynas, MOFCOM turnaround days, and any public DoD reserve procurement notices. These metrics will clarify whether onshore capacity offsets the deficit created by coup‑affected projects.

    Contrasting elections and coups as drivers of policy volatility affecting critical mineral markets.
    Contrasting elections and coups as drivers of policy volatility affecting critical mineral markets.

    Materials Dispatch Signal

    Political shocks in 2026 have converted structural HREE tightness into episodic supply risk. The practical response observed across supply chains is bifurcation: increased allocation to U.S./Allied suppliers with policy backing, and continued tactical dependency on Chinese processing where scale and grade remain unavailable elsewhere. The result is higher complexity in compliance, logistics and inventory planning, with near‑term concentrated risk around Myanmar and DRC access and medium‑term sensitivity to U.S. political continuity and Chinese export policy decisions.

  • Why ‘friend‑shoring’ is harder than it looks in critical minerals

    Why ‘friend‑shoring’ is harder than it looks in critical minerals

    Materials Dispatch cares about friend‑shoring in critical minerals for very practical reasons: procurement teams are trying to secure long‑life supply for defense, energy and electronics programs while navigating sanctions lists, origin rules, and fast‑moving trade measures. Over the past three years, rare earth and battery‑metal sourcing reviews have been repeatedly blown off course by new tariffs between allies, carbon border rules, export controls, and project delays. Each of these episodes has underlined the same blunt reality: the political story about “friends” does not match the physical and regulatory structure of critical‑mineral supply.

    When neodymium‑praseodymium (NdPr) prices swing roughly 25% in a single quarter on the back of Chinese export‑control briefings, when a supposedly friendly supplier suddenly falls under a new tariff regime, or when a flagship refinery overruns capital expenditure by 40%, the elegant speeches about allied resilience give way to crisis calls between procurement, compliance, and program managers. This briefing unpacks why friend‑shoring in critical minerals is structurally harder than it looks, and how recent rules, timelines, and capacity data point to a high‑friction decade ahead.

    Key Points

    • Friend‑shoring strategies run into China’s entrenched dominance in refining and magnet production, where processing shares of roughly 70-95% and separation capacity above 200,000 tonnes per year collide with much smaller allied projects.
    • Recent measures by allies themselves-US Section 301 tariffs on Canadian and Mexican critical minerals, EU CBAM implementation, proposed Canadian export levies, and Japanese stockpile mandates-fragment what is supposed to be a unified “friends” bloc.
    • Regulatory timelines (tariffs, tax credits, export controls) are out of sync with multi‑year project build‑outs, typical capital expenditure overruns of 30-40%, and permitting delays, creating a persistent gap between policy ambition and physical supply.
    • Defense and clean‑energy supply chains face different cost and risk tolerances; early evidence points toward an emerging segmentation, with defense willing to pay security premia and civilian energy chains remaining deeply exposed to Chinese flows.
    • Interpretation of these dynamics remains conditional: actual outcomes will hinge on how specific measures are implemented in 2025-2028, how quickly allied refining projects overcome execution risks, and how far China pushes export‑control leverage.

    FACTS: Structures, Rules, Dates and Capacities

    China’s structural position in critical‑mineral processing

    Across multiple critical materials, China holds a dominant share of mid‑stream processing and refining rather than just upstream mining. Public data from geological surveys and industry bodies describe approximate Chinese shares of:

    • Roughly 70–95% of global refining and processing in key rare earth elements (REEs) and permanent magnet materials.
    • A very large majority of oxide separation capacity, with Chinese rare‑earth separation estimated above 200,000 tonnes per year, compared with targeted capacities in the low thousands of tonnes per year for leading allied projects.
    • High shares in graphite anode materials and intermediate magnet production, even where some mining occurs in allied jurisdictions.

    US minerals data indicate that the United States remains fully import‑reliant for more than a dozen critical minerals, including several heavy rare earths such as dysprosium (Dy) and terbium (Tb). Non‑Chinese capacity for heavy rare earth separation is currently limited and highly concentrated.

    Key allied projects and capacities

    A series of allied projects has been announced or advanced with explicit friend‑shoring goals:

    • Lynas Rare Earths and Iluka Resources are developing the Eneabba refinery in Australia, targeting around 1,500 tonnes per year of separated rare earths by the mid‑2020s. Industry coverage in early 2026 highlighted delays and cost pressures.
    • Arafura Resources’ Nolans project in Australia is designed to produce approximately 4,200 tonnes per year of NdPr‑equivalent, with legal challenges and environmental litigation reported in 2026.
    • MP Materials is expanding integrated rare‑earth separation and magnet capacity in North America, including a magnet facility in Fort Worth that is reported to target around 1,000 tonnes per year of NdFeB magnets from late 2026.
    • Neo Performance Materials and Vital Metals are developing rare‑earth downstream capacity in Canada, including oxide and potential magnet‑grade material production.
    • Mountain Pass in the United States continues to operate as a major rare‑earth concentrate producer, with reported output around 45,000 tonnes per year of rare‑earth oxide equivalent.
    • On the battery‑metal side, BHP’s Nickel West operations in Australia produce on the order of tens of thousands of tonnes per year of nickel, and are often cited in discussions about low‑carbon nickel supply to allies.

    Taken together, these projects do not yet approach the processing scale that China has built over several decades. Many remain in ramp‑up or development phases, with commissioning dates extending into the second half of the 2020s.

    Major allied policy measures affecting friend‑shoring (2024–2027)

    Alongside project announcements, a dense layer of trade, industrial and security policy has emerged among “friendly” jurisdictions. Several measures are directly relevant to critical‑mineral friend‑shoring:

    • US Section 301 tariffs on Canadian and Mexican critical minerals (effective 2025). In early 2025, US authorities announced that certain critical‑mineral imports from Canada and Mexico would face 25% tariffs under Section 301, with implementation from 1 January 2025. Public justification framed the move as a national‑security and domestic‑processing measure, even though both partners are parties to the US‑Mexico‑Canada Agreement (USMCA).
    • EU Carbon Border Adjustment Mechanism (CBAM) rollout (2026–2027). The European Union’s CBAM entered a transitional reporting phase mid‑decade, with full financial adjustment scheduled to start in 2027. While initial sectors were limited, policy and market analysis in 2025–2026 described significant implications for high‑carbon nickel and stainless‑steel supply into Europe, with estimates of substantial cost uplifts (often cited in the 20–30% range) for higher‑emission routes.
    • Chinese export‑control signalling on rare earths and magnets (post‑2026). State‑linked commentary in early 2026 indicated that previously relaxed controls on dual‑use rare‑earth products and magnets could be tightened again after November 2026. Earlier export‑control moves had already triggered price and availability volatility in NdPr and related materials.
    • Australia’s Critical Minerals Strategy 2023–2030. Australia’s strategy sets explicit targets for increasing domestic processing, with public statements describing objectives for a majority share (for example, 60%) of critical‑mineral processing to occur onshore by the middle of the decade. A Critical Minerals Accelerator stream was introduced to fast‑track approvals, though projects such as Nolans still encountered legal and community challenges.
    • 2026 Critical Minerals Ministerial and FORGE forum. A ministerial meeting in February 2026, involving the United States and several allied resource holders, launched the FORGE forum, oriented around joint stockpiling, co‑financing of strategic projects, and information‑sharing on critical‑mineral security.
    • “Project Vault” US–Australia stockpiling initiative. Also in early 2026, reporting described a bilateral stockpiling program, Project Vault, intended to secure rare earths and related materials for defense uses. Financing and construction were reportedly affected by a capital‑expenditure overrun on the order of 40% relative to initial estimates.
    • US Inflation Reduction Act (IRA) Section 45X implementation. Treasury guidance in early 2026 clarified that advanced manufacturing production credits for critical‑mineral processing (often referred to as Section 45X credits) would expand from 2026, with a 10% credit level cited for eligible critical‑mineral processing. Eligibility was tied to domestic or free‑trade‑agreement (FTA) partners, leaving some “friendly” but non‑FTA states-such as Ukraine—outside the regime pending review.
    • Japan’s rare‑earth stockpile requirements (effective April 2026). Japan moved to formalise minimum stockpile days for heavy rare earths used in defense magnets, such as Dy and Tb, with a 60‑day target referenced. Sourcing plans highlighted reliance on non‑Chinese supply from entities such as Lynas’ Malaysian operations and Australian projects.
    • Canada’s proposed export levy on rare‑earth concentrates (2026). In response in part to upstream‑only extraction patterns, Canadian policymakers discussed a proposed 5% levy on unprocessed rare‑earth concentrate exports in 2026, with indications that defense‑related offtake could receive exemptions. This would coexist with, and potentially interact awkwardly with, US tariff policy.

    Documented supply disruptions and legal constraints

    Several concrete disruptions shaped allied thinking on friend‑shoring:

    • Russian aggression against Ukraine disrupted titanium feedstock and graphite projects in that country, including deposits identified in US‑Ukraine critical‑minerals cooperation documents. Energy infrastructure attacks and logistics constraints led to repeated interruptions in ore and concentrate shipments.
    • Australian operations in multiple commodities, including nickel and gold‑PGMs, experienced weather‑related shutdowns and transport interruptions from floods and cyclones in 2025–2026.
    • Legal challenges from Indigenous and local communities in Australia, including litigation targeting the Nolans rare‑earth project, resulted in permitting delays measured in many months.
    • NdPr and broader rare‑earth spot markets saw marked volatility; one widely cited example was a roughly 25% swing in NdPr spot prices during the first quarter of 2026 associated with renewed Chinese export‑control commentary.

    Industry and project‑finance case studies across critical‑mineral projects repeatedly reference capital‑expenditure overruns in the range of 30–40%, particularly for first‑of‑a‑kind separation or refining facilities. Project Vault’s reported 40% overrun is one recent illustration.

    INTERPRETATION: Why Friend‑Shoring Is Harder Than It Looks

    Materials Dispatch’s reading of this evidence is blunt: the policy story about moving critical‑mineral supply chains to “friends” crumbles under scrutiny of real‑world capacities, trust deficits, and mismatched incentives among those same friends. The rhetoric of seamless allied collaboration collides with three frictions: structural dependence on Chinese processing, fragmentation of policy among allies, and divergent priorities between defense and clean‑energy applications.

    Global critical minerals friend‑shoring corridors and chokepoints
    Global critical minerals friend‑shoring corridors and chokepoints

    Capacity constraints: one China versus many small allies

    China’s processing advantage rests on decades of cumulative investment, technology learning and integrated ecosystems clustered around magnets, batteries and specialty alloys. Allied friend‑shoring initiatives are, at present, a patchwork of discrete projects that often depend on Chinese equipment, engineering experience, or market demand even as they seek to “diversify away.”

    To the extent that China controls 70–95% of processing and more than 200,000 tonnes per year of rare‑earth separation capacity, while leading allied projects target capacities in the low thousands of tonnes per year, any assumption of near‑term parity looks ungrounded. Even if every highlighted allied project (Lynas–Iluka, Nolans, MP’s expansions, Canadian refineries) were to deliver on time and on budget—conditions which past experience suggests are optimistic—the combined non‑Chinese separation capacity would still leave many supply chains structurally reliant on China for a large share of processed material.

    Operational reality is harsher. Over the last procurement cycle, Materials Dispatch has observed repeated two‑ to three‑year slippages from initial commissioning dates, 30–40% capital‑expenditure overruns, and slower‑than‑planned ramp‑ups in metallurgy‑heavy projects. Under those conditions, friend‑shoring appears less like a quick hedge and more like a long‑duration transition with persistent single‑point‑failure risks. A handful of non‑Chinese refineries and magnet plants become the new choke points, rather than true redundancy to China’s ecosystem.

    Policy fragmentation and trust deficits among allies

    Friend‑shoring assumes that allies behave as a coherent bloc. The tariff, CBAM and export‑levy landscape suggests otherwise. US imposition of 25% Section 301 tariffs on critical‑mineral imports from Canada and Mexico—two formal FTA partners—sends a clear message that even close allies can be reclassified as targets if domestic politics favour visible “tough on trade” moves. European CBAM rules, meanwhile, put emissions‑intensive Australian and other allied metals at a disadvantage relative to lower‑carbon suppliers, regardless of security considerations.

    Canada’s proposed levy on rare‑earth concentrate exports, designed to push value‑added processing onshore, introduces another layer of friction with US ambitions to pull concentrates into its own refineries. Japan’s stockpile mandates increase demand pressure in a relatively illiquid heavy‑REE segment, potentially crowding out other allied needs. And Ukraine, held up rhetorically as a future critical‑mineral partner, remains excluded from certain IRA tax‑credit benefits until at least a scheduled review.

    Why friend‑shoring supply chains are more fragmented and fragile than they appear on paper
    Why friend‑shoring supply chains are more fragmented and fragile than they appear on paper

    Policy analysis from strategic‑studies institutions has been explicit about the resulting trust deficit, describing some of these reversals as “agreements torn up.” In practice, this forces procurement and risk teams to treat allied policy as a moving target rather than a stable foundation. Every new levy, tariff or exemption‑carve‑out increases the legal and compliance load just to maintain existing flows, let alone build new ones.

    Defense versus energy: incompatible tolerances for cost and fragility

    Defense supply chains and energy‑transition supply chains do not value the same things. High‑end defense platforms—fighter aircraft, submarines, precision‑guided munitions—require small volumes of very high‑purity materials (for example, NdPr, Dy, Tb for permanent magnets; titanium sponge for airframes) with extreme reliability and traceability. Defense ministries and prime contractors can and often do tolerate security premia and stockpiling overheads, because materials costs are a small fraction of program budgets.

    By contrast, clean‑energy and mass‑market electronics supply chains require very large volumes at lowest‑possible unit cost: lithium, nickel, graphite, copper, and REEs for millions of EVs and turbines. Here, a 20–30% cost uplift linked to CBAM, friend‑shoring, or non‑Chinese processing can meaningfully slow deployment or shift manufacturing elsewhere. Evidence to date suggests that where friend‑shoring raises unit costs, defense applications are more likely to absorb those costs, while commercial and green‑energy applications remain exposed to cheaper, higher‑carbon or higher‑risk Chinese flows.

    The likely outcome is de facto segmentation: a “defense track” of ring‑fenced, partly stockpiled, non‑Chinese material flows at a significant implicit security premium; and a “commercial/energy track” that continues to rely heavily on Chinese or mixed‑origin supply for cost reasons. That segmentation would complicate plant economics for allied refineries, which depend on blending defense‑grade and commercial volumes, and could entrench China’s dominance in cost‑sensitive segments even as allies secure narrow defense corridors.

    Operational frictions: permitting, overruns, and disruptions

    Permitting, legal challenges, and physical disruption have already undercut multiple high‑profile friend‑shoring projects. Litigation over Indigenous land rights and environmental impacts at the Nolans project, regulatory controversies around processing plants in Malaysia, and weather‑related downtime at Australian nickel and gold‑PGM mines illustrate how easily a single site can be taken offline or delayed for months.

    From an operational‑risk perspective, allied friend‑shoring is currently built on an extremely narrow physical base: a few mines, a handful of separation plants, and even fewer magnet facilities. Materials Dispatch has seen sourcing strategies that assumed two‑ to three‑year ramp‑ups to full design capacity; experience shows that metallurgical tuning and community issues can stretch those timelines beyond five years. Against that backdrop, multi‑decade Chinese plants with fully depreciated infrastructure and deep local supply bases look even more entrenched.

    Competing defense and clean‑energy demands for the same critical minerals
    Competing defense and clean‑energy demands for the same critical minerals

    When Chinese export‑control discussions alone can move NdPr prices by roughly 25% in a quarter, while allied capacity remains in construction or commissioning, the near‑term net effect of friend‑shoring is not necessarily lower volatility. Until alternative capacity is both large and diversified enough, the system remains highly sensitive to Beijing’s regulatory choices.

    Mineral‑by‑mineral friction: where friend‑shoring is most strained

    The frictions above do not apply evenly across all materials. Some segments are structurally more challenging for friend‑shoring:

    • Heavy rare earths (Dy, Tb). With China holding around 95% of processing for heavy REEs, and non‑Chinese projects only targeting on the order of a few thousand tonnes per year by the late 2020s, this is the highest‑friction segment. Japanese stockpile mandates add further tightness.
    • Graphite. China dominates graphite anode materials. Ukraine and Canada feature in diversification plans, but war‑related disruptions in Ukraine and potential tariff/levy frictions in North America complicate scaling.
    • Nickel. EU CBAM pressures higher‑emission nickel routes while allies such as Australia wrestle with their own environmental and community constraints. Lower‑carbon deposits in Canada or other regions require substantial capital and time to build out.
    • Titanium. Ukraine and Australia are both important titanium feedstock suppliers. War risks in Ukraine have already demonstrated how quickly a “friendly” source can become logistically constrained.

    In each case, friend‑shoring is technically possible, but it collides with some combination of Chinese incumbency, allied policy friction, and local operational risk. The aggregate effect is a slower, more expensive and more politically fragile pathway than headline speeches imply.

    WHAT TO WATCH: Regulatory and Industrial Weak Signals

    Several developments will determine whether friend‑shoring in critical minerals remains mostly rhetorical or begins to reshape real flows:

    • Final scope, product codes and enforcement posture for US Section 301 tariffs on Canadian and Mexican critical minerals, including any exemptions or suspensions negotiated under USMCA channels.
    • How the European Commission implements CBAM for metals and whether nickel‑bearing intermediates central to batteries and stainless steel are pulled into the effective coverage through implementing acts.
    • The exact form and timing of any renewed Chinese export controls on rare earths and magnets after November 2026, including licence requirements, product lists, and informal implementation signals from customs.
    • Progress milestones at key allied projects (Lynas–Iluka Eneabba, Nolans, Canadian rare‑earth refineries, MP Materials’ magnet plant), including commissioning dates, reported throughput, and environmental/community challenge status.
    • Formalisation of Japan’s stockpile mandates and any move by other allies to adopt similar minimum‑days‑of‑supply rules for Dy, Tb and other highly strategic inputs.
    • Implementation guidance and audits around IRA Section 45X credits, particularly origin‑verification rules and any early evidence of non‑compliance or reclassification of partner countries.
    • Decisions in Canada on the proposed export levy for rare‑earth concentrates and how these interact with US defense‑related offtake agreements and future US tariff policy.
    • Whether the FORGE forum and Project Vault translate into binding offtake, joint‑financing vehicles and transparent stockpiling rules, or remain high‑level declarations with limited operational footprint.
    • Evidence of de facto segmentation between defense‑oriented and commercial supply chains—for example, dedicated defense‑only processing lines, separate compliance regimes, or differentiated stockpile standards.
    • Patterns of capital‑expenditure overruns, delays and cancellations across allied critical‑mineral projects, which will indicate whether financiers and policymakers are adjusting assumptions after early overruns.

    Note on Materials Dispatch methodology Materials Dispatch integrates systematic monitoring of regulatory texts and official communications from key jurisdictions with project‑level reporting and trade‑flow data, then cross‑checks those signals against end‑use technical requirements in defense, automotive, power, and electronics supply chains. This combined view helps distinguish between headline policy announcements and measures that genuinely alter feasible material flows and qualification pathways.

    Conclusion

    The emerging evidence base points to friend‑shoring in critical minerals as a slow, conflict‑ridden realignment rather than a clean break from China. Capacity constraints, allied policy fragmentation, and diverging priorities between defense and clean‑energy users combine to create a landscape where rhetoric about friends often outpaces what rules, plants, and ports can actually deliver.

    None of this implies that friend‑shoring will fail outright; it suggests instead that its outcomes will be uneven, mineral‑specific and politically contingent. For critical‑material stakeholders, the central task is not to accept or reject the friend‑shoring narrative, but to track how concrete regulatory measures, project execution and demand segmentation interact in practice. Materials Dispatch will continue active monitoring of regulatory and industrial weak signals that will define how friend‑shoring in critical minerals evolves from slogan to operational reality.

  • Designing a strategic materials risk index for your supply chain

    Designing a strategic materials risk index for your supply chain

    Designing a strategic materials risk index for supply chains has become a recurring task across energy, defense, and advanced manufacturing. Rare earth elements, battery metals, and precious metals behave differently from bulk commodities: a handful of mines or refineries can control global flows, a single export quota can reshape trade routes, and price series can behave more like small-cap equities than raw materials. A Strategic Materials Risk Index (SMRI) gives organizations and analysts a structured way to compare these exposures across materials, suppliers, and time horizons.

    At its core, an SMRI is a scoring framework that blends quantitative indicators and qualitative judgments into comparable 0-10 style risk scores for each material and, in some cases, for each major supplier. The following methodology reflects what risk teams, commodity analysts, and journalists have been using in practice to move from anecdotal concerns (“lithium is volatile”, “China dominates rare earths”) to disciplined, reproducible assessments.

    Key Operational Attention Points

    • Tradeoffs: Higher geographic diversification can come with weaker traceability or ESG credentials; lower volatility materials may still face acute regulatory or sanctions risk.
    • Failure modes: Overreliance on midstream chokepoints (e.g., rare earth separation in China) often goes underweighted relative to mine-level risk.
    • Signals to watch: export control announcements, mining license changes, refinery outages, and widening bid-ask spreads in thinly traded materials.
    • Data gaps: artisanal and small-scale production, off-exchange trades, and opaque long-term contracts frequently limit visibility for index scoring.

    1. Setting Scope, Risk Appetite, and Time Horizon

    An effective SMRI starts with a clear definition of what is being measured and for what purpose. In practice, teams first map the “material universe” relevant to a given supply chain or coverage angle. For an EV-focused analysis, lithium, nickel, cobalt, graphite, and neodymium-praseodymium (NdPr) tend to dominate. Aerospace and defense analyses often center on titanium, tungsten, high-purity aluminum, and specific rare earths used in guidance systems and permanent magnets.

    Three scoping dimensions tend to matter most:

    • Position in the value chain: Some teams index risk at the ore or concentrate level; others focus on refined products (e.g., battery-grade lithium carbonate equivalent, separated rare earth oxides) or even alloyed forms.
    • Direct vs. indirect exposure: Primary materials used in-house differ from materials embedded deeper in supplier tiers (for example, palladium in catalytic converters sourced as complete units).
    • Risk appetite and mission-criticality: Defense primes, grid-scale storage manufacturers, and jewelers often apply very different tolerance thresholds to disruption, compliance risk, and substitution.

    Time horizon framing is equally important. Near-term security (the next procurement cycle) tends to be driven by operational capacity, logistics, and current policy. Medium-term (one to several years) brings in project development pipelines and foreseeable regulatory shifts. Long-term planning introduces technology substitution, recycling, and industrial policy as dominant factors. Most SMRI implementations so record, at minimum, a “current” and a “strategic” score for each material.

    2. Building the Data Spine for an SMRI

    Before scoring begins, teams typically assemble a data spine that can support consistent comparisons across materials. In practice, this tends to include:

    • Production and reserve data: Country- and company-level output and reserves, often drawn from geological surveys, company filings, and industry databases.
    • Processing and refining capacity: Midstream capacity for separation, refining, and alloying. For rare earths, for instance, China accounts for roughly 70% of global rare earth oxide production and about 85% of rare earth separation capacity.
    • Trade and logistics flows: Import-export data by HS code, dominant routes and ports, and known chokepoints.
    • Geopolitical and regulatory information: Sanctions lists, export control regimes, environmental and labor regulations, and critical raw materials lists (e.g., EU, US, Japan).
    • Market data: Spot prices, where available forward curves, and liquidity indicators such as trading volumes or bid–ask spreads.
    • Supplier-level information: Financial statements, ESG reports, incident logs, and audit outcomes for major producers such as Lynas Rare Earths, MP Materials, Rio Tinto, Glencore, and Newmont.

    Data gaps are unavoidable, particularly for artisanal production and opaque midstream tolling arrangements. Mature SMRIs typically flag such gaps explicitly and incorporate a data-quality or “confidence” overlay rather than silently treating missing information as low risk.

    3. Core Risk Dimensions in a Strategic Materials Index

    Most robust SMRIs converge on five core dimensions. Each dimension is expressed as a 0–10 risk score, where higher values indicate higher risk, based on several sub-factors.

    3.1 Supply Concentration Risk

    This dimension reflects how exposed a material is to disruption from a small number of countries or producers, and from tight capacity.

    • Geographic concentration: One frequently used rubric interprets a score near 10 as “more than 80% of global production controlled by a single country”; a mid-range score around 5 corresponds to “roughly half to four-fifths from the three largest producing countries”; a low score near 1 implies “less than 30% from the top three.” Rare earths and tungsten (with production strongly centered in China, alongside Vietnam and Russia for tungsten) tend to sit at the high end of this scale.
    • Producer concentration: The number and independence of major producers. Markets dominated by a handful of firms, or by national champions closely tied to state policy, typically attract higher scores than diversified, multi-continent producer sets.
    • Capacity utilization and slack: Materials where mines, refiners, or separators run close to nameplate capacity leave little room to offset disruptions. Observed practice often treats “very high average utilization with minimal spare capacity” as high risk and “substantial spare capacity” as lower risk.
    • Midstream chokepoints: Even when mining is diversified, refining and separation can be horizontally concentrated, as seen in rare earth separation or cobalt refining in China.

    Supply concentration scores generally emerge from a weighted blend of these sub-factors, with midstream chokepoints receiving extra attention in materials such as rare earths, cobalt, and battery-grade lithium chemicals.

    3.2 Geopolitical and Regulatory Risk

    Here the index captures country-level instability and policy actions that can restrict supply even when geology and capacity appear ample.

    • Political stability: Teams often draw on composite indices to differentiate between stable jurisdictions and those with elevated risk of expropriation, conflict, or sudden policy shifts. Examples include cobalt production in the Democratic Republic of Congo or nickel in Indonesia.
    • Export controls and trade policy: Previous episodes of rare earth export quotas by China, restrictions on Indonesian nickel ore exports, or evolving controls on gallium and germanium illustrate how quickly trade policy can rewire markets. Materials that have already been subject to such measures tend to score at the higher end.
    • Sanctions exposure: Palladium and platinum sourced from Russia, for instance, intersect with US and EU sanctions regimes. Similar considerations apply to gold or tantalum originating from conflict-affected regions.
    • Compliance burden: Conflict minerals rules (for tin, tantalum, tungsten, and gold), emerging EU due diligence requirements, and national critical raw materials strategies can impose complex reporting and auditing obligations. Materials falling under multiple overlapping regimes are often scored as higher risk on this sub-dimension.

    Different organizations assign different weights here. Defense-oriented entities, for example, frequently place greater emphasis on sanctions and export controls, while consumer-facing brands often assign more weight to ESG and human rights compliance risk.

    3.3 Price Volatility and Market Liquidity

    Strategic materials can behave in markedly different ways financially. Lithium offers a vivid illustration: prices moved from around $5,000 per metric ton in 2020 to approximately $80,000 per metric ton in 2022, before retreating to roughly $15,000 per metric ton in 2024. Such swings contrast with more moderate, though still material, volatility in gold or silver.

    • Historical price volatility: Teams typically track standard deviations of daily or monthly prices over one- and three-year windows, normalised by mean price. Materials with very high relative volatility gravitate toward higher index scores.
    • Market liquidity and depth: Gold and silver, traded on COMEX and via the London Bullion Market Association, tend to exhibit tight spreads and deep order books. In contrast, rare earth oxides and many minor metals trade over the counter with thin volumes and wide spreads, earning higher risk scores.
    • Price discovery mechanisms: Transparent exchange benchmarks generally reduce perceived risk. Markets where a small set of producers, often in one country, effectively set prices through non-public contracts are usually treated as riskier.
    • Macro and policy sensitivity: Some materials track global growth, interest rates, or currency shifts; others respond primarily to technology-specific demand (e.g., EV adoption for lithium and NdPr) or to policy decisions (such as subsidies or bans).

    For journalists, this dimension often provides the most accessible narrative hook, linking a material’s SMRI profile to headline price moves and explaining why thin liquidity can amplify shocks.

    3.4 Supplier Operational and Financial Risk

    Beyond country-level and market-level dynamics, the SMRI often includes a supplier layer for major counterparties.

    • Financial strength: Larger diversified miners such as Rio Tinto, Glencore, or Newmont generally present different risk profiles from single-asset producers or heavily leveraged mid-tier firms. Analysts look at leverage, cash generation, access to capital markets, and ownership structure.
    • Operational reliability: Historical delivery performance, mine uptime, safety incidents, and environmental breaches all feed into perceived risk. A mine operating consistently near technical limits, or with a history of tailings failures, tends to score higher.
    • Asset concentration: Dependence on a single mine, smelter, or separation plant for a large share of global supply creates a structural risk, independent of corporate strength.
    • ESG and community relations: Local opposition, indigenous rights disputes, or non-compliance with environmental permits can delay expansions or even halt operations, affecting medium-term security of supply.

    In an SMRI context, supplier scores are often aggregated with material-level scores to highlight where corporate concentration amplifies or mitigates country and market risks.

    3.5 Substitution and Technology Risk

    This dimension captures how dependent a given application is on a specific material, and how likely technology pathways are to reduce or increase that dependence.

    • Functional criticality: Some materials provide irreplaceable properties in current designs (e.g., neodymium-iron-boron magnets in high-performance motors). Others can be swapped with limited performance sacrifice.
    • Availability of substitutes: The presence of drop-in or partial substitutes, even at some performance loss, often pulls risk scores down.
    • Technology trajectory: R&D pipelines, patent trends, and announced product roadmaps indicate whether demand is likely to pivot away from or further toward a given material. For instance, emerging LFP and sodium-ion chemistries alter longer-term lithium and cobalt exposure.
    • Recycling and circularity: High recycling rates, existing urban mining infrastructure, and recoverability from end-of-life products can temper primary supply risk over longer horizons.

    Because this dimension is inherently forward-looking, SMRIs often express it as a separate “strategic” risk score, alongside a more near-term operational risk score.

    4. Weighting, Aggregation, and Calibration

    Once dimension scores exist, the question becomes how to weight them. In practice, weighting reflects institutional priorities and sector exposure. A precious metals refiner might assign greater weight to price volatility and sanctions risk; a magnet manufacturer might prioritise supply concentration and technology substitution.

    Common practice includes:

    • Setting baseline weights for the five dimensions (for example, equal weighting for an exploratory analysis).
    • Adjusting weights for specific user groups or use-cases (e.g., a “compliance-focused” view vs. a “production continuity” view).
    • Calibrating by back-testing: comparing historic SMRI scores with known disruption events such as China’s rare earth export quotas, the Russia–Ukraine conflict impacts on palladium, or previous cobalt supply squeezes.

    Calibration exercises often reveal where an index underweights midstream chokepoints or overweights price volatility relative to hard physical risks. Iterative refinement tends to bring the framework closer to how disruptions actually propagate through supply chains.

    5. Example Walkthrough: Lithium in an EV-Oriented Supply Chain

    To illustrate how these elements come together, consider lithium as viewed through an EV-focused SMRI lens.

    • Supply concentration: Mining is relatively diversified across Australia, Chile, China, and others, suggesting moderate geographic concentration. However, refining into battery-grade chemicals shows heavier concentration in China, lifting the overall supply concentration score.
    • Geopolitical and regulatory: Producing countries range from relatively stable OECD jurisdictions to Latin American states debating nationalisation and higher royalties. Geopolitical risk is therefore mixed, while regulatory risk around environmental permits and water use is non-trivial.
    • Price volatility and liquidity: The extreme 2020–2024 price swings highlight high volatility. Liquidity is improving, with emerging exchange contracts and benchmarks, but remains shallower than for base or precious metals, so scores here tend to be elevated.
    • Supplier risk: Major diversified miners coexist with specialised lithium producers. Single-asset exposure, project delays, and technical challenges in brine processing can increase supplier-level risk for specific counterparties.
    • Substitution and technology: Current mainstream EV chemistries are heavily lithium-dependent. However, chemistries differ in cobalt and nickel intensity, and long-term innovation (including sodium-ion) introduces uncertainty over multi-decade horizons. Substitution risk is therefore significant but plays out slowly.

    Analysts building an SMRI score for lithium often end up with high scores on volatility, medium-to-high on supply concentration and geopolitical/regulatory risk, and more nuanced, horizon-dependent scores for substitution and technology risk. The resulting index value then anchors discussions about diversification, recycling, or R&D prioritisation, without dictating any single course of action.

    6. Signals, Failure Modes, and Use in Reporting

    Across materials, several recurring failure modes appear when SMRIs are absent or underdeveloped:

    • Treating “number of mines” as a proxy for security while ignoring refining and separation bottlenecks.
    • Focusing solely on prices and ignoring compliance or sanctions risk, particularly in gold, tantalum, and palladium.
    • Underestimating the pace at which export controls or quotas can be introduced, as seen in multiple rounds of Chinese measures on rare earths and other specialty materials.
    • Assuming that technological substitution will arrive faster than project development timelines, especially in defense and aerospace applications.

    For business and policy journalists, a material-level SMRI can also provide a backbone for explanatory reporting. Each dimension translates naturally into narrative angles: concentration becomes a story about geographic dependencies; geopolitical risk links to sanctions and industrial policy; volatility and liquidity illuminate why certain price spikes feel disorderly; supplier and technology dimensions connect to corporate strategy and innovation coverage.

    Over time, as more data points are collected and back-tested against real disruptions, SMRIs evolve from one-off analytical exercises into living tools that support procurement, policy analysis, and public communication about the resilience of strategic materials supply chains.

  • How to use price and lead‑time data to anticipate strategic materials shortages

    How to use price and lead‑time data to anticipate strategic materials shortages

    In strategic metals supply chains, the earliest signs of a shortage rarely appear in public price indices. They tend to emerge first in delivery promises, supplier behavior, and access to material. Only later do reference prices on venues such as LME or COMEX, or assessments from CRU Group, Fastmarkets, S&P Global, or MetalMiner, begin to fully reflect the imbalance. This guide sets out a practical framework for analysing how to use price and lead‑time data to anticipate strategic materials shortages, as observed in rare earths, platinum group metals, lithium compounds, titanium, tungsten, and related critical inputs.

    • Lead-time inflation is typically the earliest quantitative signal of emerging tightness in strategic materials.
    • Supplier behavior changes (allocation, MOQs, payment terms, buybacks) often precede or amplify lead-time shifts.
    • Published prices and indices usually confirm, rather than initiate, shortage narratives.
    • Combining lead-time, behavior, and price data into tiered alert levels clarifies internal risk communication.

    1. Why Price-Only Monitoring Misses Early Shortage Signals

    Strategic metals markets are only partially transparent. A portion of volume trades via visible benchmarks, but a significant share moves through long-term contracts, relationship-driven channels, and off-market deals. As a result, reference prices tend to be lagging indicators of stress.

    In practice, availability constraints typically manifest through lead-time extension, access restrictions, and supply chain behavior changes before published prices adjust. Material may remain notionally “available” at index-linked prices, but:

    • New spot enquiries receive longer delivery promises or are declined.
    • Existing customers are given priority allocations while new accounts struggle to secure volume.
    • Minimum order quantities (MOQs) increase as producers and traders ration scarce units.
    • Suppliers tighten payment terms or request prepayments.
    • Buyback activity of scrap or previously sold material accelerates.

    These behaviors alter physical access long before headline indices move meaningfully. As one practitioner summary put it, “Lead time is the most reliable early warning signal because it reflects real supply-demand imbalance before price discovery occurs.” When lead times extend from 6 weeks to 12+ weeks in heavy rare earths, for example, this has often signalled constrained supply several weeks before published prices reflected the shortage.

    2. Lead Time as the Primary Shortage Indicator

    Lead time-order placement to material receipt-captures both upstream production constraints and midstream logistics congestion. Unlike prices, which reflect only transacted volumes visible to price reporters or exchanges, lead time reflects the full pipeline of confirmed and anticipated commitments.

    In shortage analysis, a useful construct is lead‑time inflation: the ratio between current and baseline lead times for a given material-supplier pair.

    Lead-time inflation factor = Current lead time / Baseline lead time

    General observations from strategic metals programs:

    • Lead-time extension of roughly 25-50% has been associated with emerging tightness, where material is still available but supply is clearly tightening.
    • Extension in the range of 50-100% has typically coincided with significant shortages developing, often alongside first mentions of allocation.
    • Extension exceeding 100% (for example, 6 weeks expanding to 12+ weeks) has usually indicated acute shortages or de facto unavailability.

    These ranges are not universal rules; different materials exhibit different baseline volatilities. However, framing lead-time changes as inflation factors creates a consistent metric across suppliers and materials. In internal dashboards, teams frequently flag lead times exceeding the 75th percentile of historical observations and escalate once they cross the 90th percentile.

    3. Supplier Behavior as a Qualitative Signal Layer

    Lead-time data gains power when combined with qualitative observations from daily supplier interactions. In several disruptions, the most reliable early warnings came from changes in “how” suppliers communicated, not just “what” they quoted.

    Visualizing price and lead-time data across a global supply chain.
    Visualizing price and lead-time data across a global supply chain.

    Behavioral signals frequently observed as supply tightens include:

    • Allocation notices: explicit statements that volume will be rationed across customers; or implicit signals such as “can only offer X% of typical volume”.
    • Rising MOQs: requirements to place larger orders per line item, effectively steering scarce tonnage toward larger or higher-priority accounts.
    • Withdrawal of spot offers: traders and distributors declining to quote spot tonnage that was previously available, especially in REO, cobalt sulphate, or tungsten APT.
    • Increased buyback interest: producers seeking scrap or offering to repurchase previously sold units, signaling a desire to consolidate material.
    • Payment term tightening: shifts from open account to shorter terms or prepayment as suppliers manage credit and allocation risk.
    • Reduced spec flexibility: unwillingness to support special grades, tolerances, or packaging formats that were previously accepted.

    Capturing these signals systematically often requires nothing more complex than a structured supplier communication log. Typical fields include date, supplier, material, quoted lead time, any allocation or MOQ comments, and free-text notes about tone or urgency. When several suppliers begin exhibiting similar constraints simultaneously, the pattern often precedes visible price adjustment.

    4. Price Data as Confirmation, Not the First Alarm

    Price series from S&P Global, Fastmarkets, CRU Group, MetalMiner, and exchange data from LME or COMEX remain important, but in this framework they are treated as confirmatory signals. They help distinguish between temporary logistics noise and genuine structural tightening.

    Observed patterns in strategic material shortages:

    • Lead times begin to extend while prices remain comparatively stable; bid-ask spreads may start to widen.
    • As supply tightness intensifies, published prices often register cumulative increases in the 5-10% range, associated in many internal frameworks with a medium-level alert.
    • Further escalation, with price increases greater than 10% accompanied by acute lead-time inflation and allocation, corresponds to high-severity shortage conditions.

    Monitoring bid-ask spreads and dispersion between different price sources (for example, Fastmarkets vs. CRU assessments, or off-index transaction reports vs. LME prices) often adds useful nuance. Widening spreads and inconsistent prints are typical during periods when participants are unsure where equilibrium lies, even before a new price level stabilizes.

    5. Tiered Alert Framework Combining Lead Time and Price

    Many organizations have formalized these observations into a tiered alert structure that combines lead-time, supplier behavior, and price movements. A typical framework is outlined below, framed as a descriptive model rather than a prescription.

    Level 1 – Emerging Tightness

    • Lead times drifting toward the 75th percentile of historical range.
    • Isolated allocation hints from one or two suppliers.
    • Price indices broadly stable, with mild upticks and slightly wider bid-ask spreads.

    At this stage, internal teams often increase the frequency of supplier check-ins, refresh demand forecasts, and verify critical inventory positions, treating the situation as a “watch” condition.

    Level 2 – Developing Shortage

    • Lead times approaching or exceeding the 90th percentile of historical observations.
    • Multiple suppliers signalling allocation, increased MOQs, or the withdrawal of spot offers.
    • Published prices trending higher, with cumulative moves in the 5–10% range and higher volatility.

    Under these conditions, observed organizational responses often include increased focus on alternative suppliers, cross-functional S&OP reviews, and scenario planning for constrained supply.

    Operations planners using data to identify emerging material shortage risks.
    Operations planners using data to identify emerging material shortage risks.

    Level 3 – Acute Shortage

    • Lead times doubling versus baseline, or explicit statements that material is unavailable for new orders.
    • Allocation communicated formally; even long-standing accounts face caps.
    • Published prices rising by more than 10%, with frequent off-index transactions at significant premia.

    In this phase, organizations commonly transition to allocation management toward their own customers, activation of secondary sources (including scrap or substitutes where technically feasible), and high-level governance involvement.

    6. Integrating Lead-Time Inflation into Planning Analytics

    Once measured, lead-time inflation can feed directly into planning models. Rather than treating lead time as a static parameter, some S&OP teams maintain both a baseline and a current value, using the inflation factor as a multiplier in internal safety-stock calculations.

    A simple representation often used in practice:

    Adjusted safety stock = Baseline safety stock × Lead-time inflation factor

    When lead time extends from, for example, 6 weeks to 12 weeks, the inflation factor of 2 would double the buffer quantity implied by a given demand forecast and service target. This does not automatically dictate an inventory decision, but it clarifies the magnitude of additional exposure if inventory policy remains unchanged.

    Similarly, internal “reorder points” or planned order release dates can reference current, not baseline, lead times. Teams that adopt this practice often report fewer last-minute expedites when markets tighten, because the math itself embeds early warning information that would otherwise sit in disconnected emails or informal supplier comments.

    7. Supplier Segmentation by Lead-Time Risk

    Lead-time monitoring also reveals structural differences between supplier types. A common segmentation observed in strategic metals sourcing is:

    • Integrated producers: Mining-to-refining chains or vertically integrated refiners often provide the most stable baseline lead times and predictable allocation behavior, though typically at larger contractual volume commitments.
    • Major traders and distributors: These entities bridge multiple producers and customers, offering flexible packaging and volumes. Their lead times depend heavily on inventory strategy and can either buffer or amplify upstream disruptions.
    • Spot-focused traders: Highly responsive to short-term supply-demand shifts; lead times and availability are volatile, but these channels sometimes provide the last pockets of material in acute shortages.

    By tracking lead-time inflation by supplier tier and geography, risk teams gain visibility into where structural resilience actually resides. For instance, if integrated producers in multiple jurisdictions maintain stable lead times while spot traders experience sharp inflation, the signal differs from a scenario where integrated producers themselves begin extending lead times in unison.

    Diagram of how price and lead-time signals propagate through the supply chain.
    Diagram of how price and lead-time signals propagate through the supply chain.

    8. Case Pattern: Lead Time Leading Price in Rare Earth Oxides

    During a recent tightening episode in heavy rare earth oxides, internal monitoring at several manufacturers showed a consistent pattern:

    • Chinese and non-Chinese refiners initially continued quoting at previously standard prices, but with lead times moving from around 6 weeks toward the 10–12 week range.
    • Distributors began withdrawing spot offers for specific dysprosium– and terbium-rich blends, citing “no free stock”.
    • Allocation conversations followed, with existing long-term customers receiving volume while new enquiries were declined or redirected to later quarters.
    • Only after these physical signals had been evident for several weeks did published rare earth oxide assessments from price reporting agencies register sustained upward moves.

    From an analytical standpoint, this episode illustrated the central principle of this framework: price series alone would have identified the shortage later than a combined view of lead-time inflation, supplier behavior, and emerging allocation language.

    9. Operationalizing the Monitoring Workflow

    In practice, the most robust early-warning systems for strategic materials combine several elements into a repeatable workflow:

    • Data sources:
      • Internal: ERP lead-time history, purchase order confirmations, supplier emails, S&OP meeting notes.
      • External: Benchmark and assessment feeds from CRU Group, Fastmarkets, S&P Global, MetalMiner, and exchange data from LME and COMEX.
    • Cadence: Many organizations integrate supply-risk reviews into their regular S&OP cycle, with more frequent checks during known stress periods such as major maintenance seasons or geopolitical inflection points.
    • Structured logs: Centralized records of supplier quotes and qualitative comments, often maintained in shared spreadsheets or procurement systems, prevent early warnings from being trapped in individual inboxes.
    • Automated alerts: Simple rules-such as notifying category managers when lead time for a given material exceeds its historical 75th or 90th percentile, or when cumulative price movement crosses pre-set thresholds—are frequently used to trigger deeper review.

    Over time, these practices tend to create an institutional memory of how specific materials behaved during past disruptions. That history, in turn, improves interpretation of future signals: whether a sudden two-week extension is just a seasonal blip, or the first sign of a broader structural problem.

    10. Summary: Complementary Roles of Lead-Time and Price Data

    Experience across multiple strategic materials points to a consistent hierarchy of signals. Lead time, supplier allocation behavior, and qualitative access conditions typically signal tightness first. Published prices, indices, and benchmark assessments provide confirmation and magnitude, but on a lag.

    Analytical frameworks that treat lead-time inflation as a core risk metric, capture supplier behavior systematically, and then overlay price developments from sources such as CRU Group, Fastmarkets, S&P Global, LME, COMEX, and MetalMiner, tend to surface shortages earlier and in a more structured way. That, in turn, supports more deliberate internal decision-making on buffers, substitutions, and customer allocation when disruptions inevitably arise.

  • Top 10 signals that a strategic materials crisis is brewing

    Top 10 signals that a strategic materials crisis is brewing

    Top 10 Signals a Strategic Materials Crisis Is Brewing: Inventories, Controls, Premiums

    Materials Dispatch tracks the same simple question across rare earths, battery metals and precious metals: is this still a price story, or has it already become an availability story? When the answer quietly shifts to availability, a strategic materials crisis is already forming underneath the surface of quoted prices and benchmark indices.

    This briefing ranks the top 10 signals that a strategic materials crisis is brewing, based on the 2024-2026 pattern in silver, gold, platinum group metals (PGMs), copper-linked by‑products and rare earths. These are the indicators that moved first in our models and client casework when supply chains started to feel stress: chronic deficits, inventory air‑pockets, export controls, delivery premiums and national security stockpiling.

    The list is ordered by how quickly each signal tends to translate into real‑world disruption for manufacturers, energy developers and defense programs. The focus is deliberately operational: exchange inventory runs, delivery queues, licensing changes and mine outages, rather than abstract macro narratives. Several of the signals will be familiar from past commodity squeezes; what’s new is how tightly they now interact across metals because of AI infrastructure build‑out, electrification and rising geopolitical confrontation.

    Individually, none of these indicators proves a crisis. Together, they define the shift from a market where participants worry about price volatility to one where the real contest is simply who gets metal at all, and on what terms.

    1. Structural Silver Deficits Turning Chronic

    Structural Silver Deficits Turning Chronic – trailer / artwork
    Structural Silver Deficits Turning Chronic – trailer / artwork

    The asset/risk. Silver has moved from a cyclical precious metal to a structurally undersupplied industrial input. Survey data for 2021-2025 point to cumulative deficits on the order of 800+ million ounces, with annual shortfalls approaching or exceeding 200 million ounces in some scenarios. Most silver is produced as a by‑product of copper, lead and zinc, so primary output barely responds to higher prices.

    Strategic context. Solar photovoltaics, high‑efficiency power electronics, 5G/AI data centers and automotive electronics are now the dominant marginal buyers. These sectors are relatively insensitive to price in the short term: a few dollars per module matters far less than delivery risk on a gigawatt‑scale project. In our tracking of PV build‑out, silver thrifting gains have been offset by sheer volume growth, so industrial demand keeps encroaching on what used to be investment and jewelry metal.

    The bottleneck. Because silver rides on the capex cycles of copper and zinc, even a spike to “three‑digit” prices doesn’t quickly create new supply. Major greenfield projects face 7-10 year lead times and heavy permitting exposure. When annual deficits persist for multiple years, the adjustment comes not from mines but from inventory drawdown and, ultimately, demand destruction in lower‑priority uses.

    The verdict. A multi‑year silver deficit is one of the clearest early signals that the broader strategic metals system is tightening. The risk is highest for electronics, PV and defense programs that depend on high‑purity silver paste and contacts, and lowest for discretionary jewelry demand that can switch alloys. Once industrial users start competing with each other rather than with investors, the system shifts from “what’s the price?” to “who gets what,” and that is where crisis dynamics begin.

    2. Exchange and Vault Inventories Draining Faster Than Prices React

    Exchange and Vault Inventories Draining Faster Than Prices React – trailer / artwork
    Exchange and Vault Inventories Draining Faster Than Prices React – trailer / artwork

    The asset/risk. COMEX, LBMA and similar vault systems are supposed to act as shock absorbers between paper trading and physical flows. When registered inventories fall by double‑digit percentages over a few months while spot prices move only gradually, the buffer is being consumed quietly in the background. In silver, for example, reference inventories in some scenarios fall by over 100 million ounces within a single quarter as industrial users stand for delivery instead of rolling futures.

    Strategic context. Large industrials, fabricators and bullion banks treat exchange inventories as a last‑resort liquidity source. During normal markets, they prefer long‑term contracts, OTC swaps or internal stockpiles. When those parties start competing for scarce exchange metal, it’s a sign that off‑market supply has already tightened. Similar dynamics have played out in platinum and palladium stocks on NYMEX during South African cost spikes and Russian export uncertainty, and in base‑metal warehouses during smelter outages.

    The bottleneck. Inventories can fall much faster than mines can respond. Registering new metal isn’t instantaneous either; it depends on refining capacity, assay times and logistics from operations like Freeport‑McMoRan’s Grasberg or Norilsk Nickel’s Russian complexes. As inventories sag, lease rates and time‑spreads start sending stress signals, but these are often ignored outside specialist desks.

    The verdict. Rapid, synchronized drawdowns across exchanges and major commercial vaults, especially when accompanied by rising lease rates, flag a market moving from financial tightness to physical scarcity. This signal is particularly critical for North American and European manufacturers that rely on exchange deliverability as a contingency. By the time public inventory charts look like a “ski slope,” the scramble for alternative sources and substitutes is usually already underway in the background.

    3. Breakdown of Historical Price Relationships (Gold–Silver Ratio & Beyond)

    Breakdown of Historical Price Relationships (Gold–Silver Ratio & Beyond) – trailer / artwork
    Breakdown of Historical Price Relationships (Gold–Silver Ratio & Beyond) – trailer / artwork

    The asset/risk. The gold–silver ratio, typically oscillating in a wide but recognizable band, serves as a crude barometer of whether silver is trading primarily as a monetary metal or as an industrial one. When that ratio compresses sharply-moving, for instance, from levels above 70:1 into the 40s while gold is already strong-it suggests silver is being pulled tighter by industrial and strategic demand than gold itself.

    Strategic context. Gold responds primarily to macro‑financial stress, central bank policy and sovereign balance sheets. Silver, by contrast, has one foot in that monetary camp and one foot in the electronics and energy transition complex. A sudden silver outperformance against gold during an already elevated gold environment indicates that physical constraints, not just financial hedging, are driving behavior. Similar “decouplings” can be seen in ratios like palladium-to-platinum or cobalt-to-copper when specific supply or demand shocks hit catalytic converters or high‑nickel batteries.

    The bottleneck. Hedging and trading models in many institutions assume historical cross‑metal relationships will roughly hold. When those relationships break, risk systems lag reality. Physical users hedging silver via a gold proxy, for example, find that their hedge no longer tracks their input costs. That can force abrupt changes in procurement strategy, including accelerated spot buying or the unwinding of structured products, adding volatility to already stressed markets.

    Global supply chains for strategic materials under stress
    Global supply chains for strategic materials under stress

    The verdict. Sharp, persistent compression in the gold–silver ratio, or unusual divergence between PGMs that share many applications, is less about “mispricing” and more about stress fractures in the underlying supply chain. The signal is particularly relevant for electronics, PV and auto OEMs that have historically treated silver and certain PGMs as semi‑fungible within budgets. Once these ratios break, financial hedges stop providing cover, and availability risk starts to dominate planning.

    4. Escalating Chinese Export Controls on Silver, Rare Earths and Allied Inputs

    Escalating Chinese Export Controls on Silver, Rare Earths and Allied Inputs – trailer / artwork
    Escalating Chinese Export Controls on Silver, Rare Earths and Allied Inputs – trailer / artwork

    The asset/risk. China’s position in strategic materials is not limited to rare earth oxides (REO). It is a major refiner and exporter of silver, NdPr, dysprosium, gallium, germanium and a host of intermediate products. Moves to restrict exports via licensing, quotas or firm‑level approvals directly change the “rules of the game” for downstream users in autos, defense and electronics.

    Strategic context. A licensing regime that restricts silver exports to a small number of qualified firms, or that caps REO exports in the name of “resource security,” effectively weaponizes China’s refining and processing advantage. The 2020–2023 experience with rare earths and battery metals set the template: export controls can emerge initially as “national security” or environmental measures, then tighten in response to foreign policy disputes, leaving EU auto makers or Asian motor producers scrambling.

    The bottleneck. Even when ore or concentrates are mined outside China-at operations like Lynas’ Mt Weld, Pilbara Minerals’ Pilgangoora or North American RE projects—processing capacity for magnet‑grade oxides and many specialty silver products remains concentrated in China. Re‑routing through alternative refining hubs in Japan, Korea or Europe requires time, capex and permitting. In the interim, physical premiums over exchange prices can blow out by 15–20% for reliable delivery of NdPr, Ag and allied inputs.

    The verdict. When Chinese export controls move from headline risk to detailed implementation—firm lists, license categories, new customs codes—that’s a strong signal that availability, not just price, will dictate outcomes. The impact is most acute for magnet producers, EV motor and wind OEMs, and defense platforms with high rare earth content, such as advanced fighter aircraft. At that point, non‑Chinese supply chains become less about shopping for the best price and more about securing any qualifying tonnage at all.

    5. Central Bank Gold Accumulation at “Structural Bid” Levels

    Central Bank Gold Accumulation at
    Central Bank Gold Accumulation at “Structural Bid” Levels – trailer / artwork

    The asset/risk. Gold remains the only strategic metal held in size on central bank balance sheets. When state buying accelerates into four‑digit tonne per year territory and stays there, it does more than just lift the gold price; it re‑anchors the entire precious metals complex and frees monetary gold from some of its previous correlation to real yields or the dollar.

    Strategic context. After the freezing of Russian reserves, several emerging‑market central banks stepped up gold purchases as a sanctions‑resistant asset. If that trend solidifies into a persistent structural bid, it has two knock‑on effects. First, it supports higher “normal” gold price levels, which affects collateral values and funding costs for gold‑linked miners. Second, it nudges investor flows and some state actors to look at adjacent precious and strategic metals—silver, PGMs—as supplemental hedges, tightening those markets indirectly.

    The bottleneck. Gold mine supply grows slowly, and major expansions—such as block cave ramps at Grasberg or new West African developments—take many years. Recycling responds somewhat to higher prices but is constrained by collection and refining infrastructure. When central banks absorb a large share of annual mine output while investors also seek allocation, the share left over for industrial fabrication in electronics, medical devices and some catalysts shrinks, even if those sectors are not the price drivers.

    The verdict. Sustained, high‑intensity central bank buying is a systemic signal that strategic actors are repositioning for a long period of geopolitical and monetary uncertainty. For industrial users, gold itself may not be the bottleneck, but its behavior shapes risk premia and opportunity costs across the precious metals spectrum. The signal is especially important for firms exposed to palladium and rhodium, where Russian supply risk overlaps with rising “store of value” interest in a thinly traded market.

    6. Tier‑1 Mine and Smelter Disruptions Pushing Up the Global Cost Curve

    Tier‑1 Mine and Smelter Disruptions Pushing Up the Global Cost Curve – trailer / artwork
    Tier‑1 Mine and Smelter Disruptions Pushing Up the Global Cost Curve – trailer / artwork

    The asset/risk. Disruptions at a handful of Tier‑1 assets—Grasberg for copper/gold/PGMs, Norilsk for nickel and palladium, large South African PGM complexes like Mogalakwena or Impala’s operations—can reprice entire metals systems. These operations sit at the low to mid‑cost part of the curve and supply significant by‑product output that the market often treats as “assured.”

    Volatile markets for critical raw materials
    Volatile markets for critical raw materials

    Strategic context. When a major block cave ramps more slowly than planned, when tailings or geotechnical incidents hit output, or when power or labor problems in South Africa curtail smelter throughput, the marginal unit of supply shifts to higher‑cost, often smaller operations. That raises the incentive price needed for new capacity and pushes more of the market’s dependence onto politically and technically complex regions. In PGMs, for example, the interplay between South African cost inflation and Russian trade frictions has repeatedly forced auto makers to rebalance between palladium and platinum.

    The bottleneck. Big mines cannot be “turned back on” quickly. Even when disruptions are temporary, remediation, regulatory review and community consultation slow any return to full output. Meanwhile, mid‑tier producers and recyclers like Umicore or Johnson Matthey may benefit from higher prices but face their own constraints in feedstock quality and plant capacity. For by‑product metals like silver, rhenium or selenium, disruptions at copper or molybdenum operations propagate quietly into specialty supply chains months later.

    The verdict. A cluster of Tier‑1 disruptions within an 18–24 month window is a defining marker of crisis risk. The effect is most severe for downstream users whose specifications limit substitution and who rely on stable, low‑impurity material streams: aerospace alloys, advanced catalysts, chip fabrication and defense systems. Once the global cost curve steps up and stays there, planning assumptions based on “cheap, abundant” strategic metals become obsolete.

    7. State Stockpiling and Defense-Linked Classification of Civilian Supply Chains

    State Stockpiling and Defense-Linked Classification of Civilian Supply Chains – trailer / artwork
    State Stockpiling and Defense-Linked Classification of Civilian Supply Chains – trailer / artwork

    The asset/risk. When governments formally classify EVs, semiconductors, grid hardware and even data centers as strategic infrastructure, their approach to materials sourcing changes. Copper, silver, NdPr, high‑purity alumina and certain PGMs move from being procurement concerns to national security assets. State stockpiles grow, Defense Production Act‑style tools are deployed, and equity stakes or long‑term offtakes in mines become acceptable policy instruments.

    Strategic context. The US, EU, China, Japan and Korea are all building frameworks that blur the line between commercial and defense demand. Battery factories attract support on national security grounds; rare earth separation plants receive grants and guarantees; strategic metals recycling is written into industrial policy. This tends to pull forward demand and lock up supply, especially when agencies mandate domestic sourcing thresholds or priority allocations for defense and critical infrastructure projects.

    The bottleneck. State actors aren’t constrained by quarterly earnings or payback periods in the same way as commercial buyers. When they move aggressively into long‑term contracts, build stockpiles or back JVs in assets like Lynas, Pilbara or emerging North American RE refineries, available “free” market volumes shrink. Civilian buyers without political priority—consumer electronics, smaller OEMs, contract manufacturers—find that the benchmark tonnage they assumed was accessible has been pre‑empted by strategic programs.

    The verdict. The clearest signal here is less about rhetoric and more about specific instruments: government equity in mines, guaranteed floor prices, take‑or‑pay offtakes, and export licensing tied explicitly to defense needs. Once those appear across multiple jurisdictions, a materials crisis becomes a distributional problem: not just how scarce a metal is in aggregate, but which sectors have the political weight to secure it on favorable terms.

    8. Low Supply Elasticity in By‑Product Metals Colliding with Electrification Demand

    Low Supply Elasticity in By‑Product Metals Colliding with Electrification Demand – trailer / artwork
    Low Supply Elasticity in By‑Product Metals Colliding with Electrification Demand – trailer / artwork

    The asset/risk. Many of the most critical materials in the energy transition—silver, tellurium, selenium, germanium, ruthenium, iridium, and several PGMs—are produced predominantly as by‑products of copper, nickel, zinc or platinum mining. Even when prices for these minor metals spike, their supply responds only marginally unless the host metal’s economics justify new investment.

    Strategic context. Electrification, AI build‑out and grid reinforcement all pull heavily on by‑product metals. Silver paste for PV, ruthenium for chip fabrication, iridium for PEM electrolysers and certain catalysts, palladium for auto and industrial emissions control, and cobalt for specific battery chemistries are all growth markets. In parallel, some host metals like nickel and cobalt face their own cyclical headwinds and ESG constraints, dampening appetite for new projects that would otherwise bring more by‑products to market.

    The bottleneck. By‑product supply is tethered to host metal capex cycles and ore grades, not to the price of the by‑product itself. Pilbara’s spodumene output, for example, determines how much tantalum and certain minor by‑products reach market; a copper mine’s cut‑off grade sets the ceiling for associated silver or rhenium production. Recycling helps but is limited by collection, technology and working‑capital needs. The result is an inelastic supply curve that turns moderate demand growth into extreme price and availability swings.

    The verdict. When multiple by‑product metals experience simultaneous demand surges from green and digital infrastructure, the risk of localized crises rises sharply. This signal matters most for sectors with tight specifications and limited substitution options, such as high‑efficiency PV, advanced semiconductors and industrial catalysts. It’s less acute for lower‑spec uses where alloy changes are feasible. The underlying message: reliance on “cheap” by‑products is a hidden vulnerability in many decarbonization roadmaps.

    9. Policy-Driven Volatility and Mandatory Localisation of Strategic Value Chains

    Policy-Driven Volatility and Mandatory Localisation of Strategic Value Chains – trailer / artwork
    Policy-Driven Volatility and Mandatory Localisation of Strategic Value Chains – trailer / artwork

    The asset/risk. New rounds of critical minerals legislation, export restrictions, sanctions and local‑content rules are turning supply chains into regulatory mazes. US and EU incentives for domestic refining, China’s counter‑measures, and resource nationalism in producer countries (royalty hikes, export taxes, local processing mandates) all add layers of uncertainty to the cost and timing of projects.

    Key warning signals of a brewing strategic materials crisis
    Key warning signals of a brewing strategic materials crisis

    Strategic context. Unlike classic commodity cycles driven mainly by demand and capex, the current phase is heavily policy‑shaped. The same tonne of NdPr, lithium carbonate or battery‑grade nickel can attract very different economic outcomes depending on where it’s processed, what content rules apply, and which trade lanes are open. For example, a rare earth project that feeds a domestic separation plant backed by government guarantees may look viable even when spot prices wouldn’t normally justify investment.

    The bottleneck. Policy can move faster than projects. Environmental approvals, community agreements and grid connections still take years, even when subsidies are generous. Meanwhile, the threat or announcement of new rules can cause “front‑running” behavior: accelerated purchasing, stockpiling, and opportunistic arbitrage. Volatility expands as markets try to price not just fundamentals but also the probability and design of future regulations, often with incomplete information.

    The verdict. When critical minerals debates shift from white papers to binding rules, and when producer governments start demanding local processing or state equity for strategic assets, a new layer of crisis risk emerges. The supply picture becomes lumpy, political and time‑inconsistent. The most exposed actors are those reliant on cross‑border intermediate products—cathode materials, magnet alloys, concentrates—whose status can change overnight with a policy communiqué.

    10. Growing Gap Between Benchmark Prices and Physical Delivery Premiums

    Growing Gap Between Benchmark Prices and Physical Delivery Premiums – trailer / artwork
    Growing Gap Between Benchmark Prices and Physical Delivery Premiums – trailer / artwork

    The asset/risk. In a healthy market, futures benchmarks like LME, COMEX or Shanghai and OTC reference indices provide a reasonable proxy for physical procurement costs. In a stressed strategic metals environment, those benchmarks become only the starting point. Real‑world buyers face hefty physical premiums, pre‑payment requirements, take‑or‑pay clauses and quality differentials that can push their all‑in costs 15–20% above “market price,” especially for NdPr, palladium and some high‑purity silver and copper products.

    Strategic context. This divergence reflects a shift from a price‑clearing market to an allocation market. Traders and refiners prioritize long‑standing relationships, creditworthy counterparties and JIT‑compatible logistics. High‑performance segments—defense, aerospace, cutting‑edge semiconductors (where players like SK Hynix and Micron dominate HBM and DRAM supply)—command preferential access to material that meets tight impurity and form‑factor specs. Other users are left bidding for what’s left, often at substantial premiums and with slower, less reliable delivery.

    The bottleneck. Premiums blow out fastest when there are simultaneous stresses: mine disruptions, export controls, low inventories and policy uncertainty. Logistics constraints—limited shipping slots, inspection delays, insurance complications for sanctioned jurisdictions—add another layer. For many buyers, the relevant decision is no longer whether to lock in a futures price, but whether to accept high premia and onerous contract terms just to secure material.

    The verdict. A persistent, widening gap between spot benchmarks and physical delivery costs is the clearest late‑stage signal that a strategic materials crisis has moved from theory to practice. At that point, the market is no longer about efficient price discovery; it’s about triage and relationship capital. Those with long‑term offtakes, stockpiles and recycling loops—such as integrated autocatalyst makers or vertically aligned magnet producers—retain leverage. Those relying solely on spot purchases face the sharp end of scarcity.

    Conclusion: Reading the Top 10 Signals in Combination

    Each of these signals—chronic silver deficits, inventory drain, distorted ratios, Chinese export controls, central bank gold accumulation, Tier‑1 disruptions, state stockpiling, by‑product inelasticity, policy‑driven volatility and premium blow‑outs—has appeared in past cycles. What’s different in the mid‑2020s is how often they’re appearing together, and how tightly they’re linked across metals.

    In Materials Dispatch’s work with automotive, electronics, PV and defense supply chains, the pattern is consistent. The first discomfort shows up in by‑product availability and refinery slots. Then exchange stocks begin to slide and benchmark correlations start to break. Policy responses, stockpiling and export controls follow, pushing more volume into long‑term bilateral deals. Finally, physical premia detach from quoted prices, and the real conversation ceases to be about “cheap vs. expensive” metal and becomes a negotiation over priority access.

    For industrial strategists, compliance teams and procurement leads, the practical implication is straightforward: none of these metrics is sufficient on its own, but together they form an early‑warning system. When three or more of these signals flash red in the same metal system within a short period—silver in PV, NdPr in magnets, palladium in auto catalysts—the probability that a localized tightness will evolve into a strategic materials crisis rises sharply.

    The key advantage lies with organizations that treat these indicators not as distant market curiosities, but as operational inputs to contracting, inventory policy, technology road‑mapping and site selection. As availability increasingly takes precedence over price, strategic positioning in metals becomes as central to competitive advantage as design, software or brand.

  • Review: lynas, mp materials, and other key rare earth suppliers in 2026: Latest Developments and

    Review: lynas, mp materials, and other key rare earth suppliers in 2026: Latest Developments and

    By 2026, the rare earths supply chain outside China is beginning to look more structured, but it remains thin, concentrated, and exposed to a small number of highly strategic assets. Lynas Rare Earths and MP Materials sit at the centre of this system, with a second tier of emerging projects in Australia, North America, the Middle East and Brazil attempting to close persistent gaps in neodymium-praseodymium (NdPr) and heavy rare earth (HRE) supply. From an operational continuity and supply security standpoint, the key question is less about headline capacity and more about how resilient these nodes are to disruption, policy change, and ramp‑up risk.

    Key Findings on 2026 Rare Earth Supply Resilience

    • Lynas and MP Materials form the backbone of non‑Chinese rare earth supply, but both rely on complex multi‑jurisdictional processing chains that introduce logistical and regulatory single points of failure.
    • The non‑Chinese NdPr deficit and even tighter HRE balance create a structurally “brittle” system: modest delays at one or two facilities can cascade into multi‑sector constraints for EVs, wind, and defense.
    • US Department of Defense (DoD) funding and Australian policy support underpin several projects, but tie long‑term availability to political and budget cycles as much as to geology.
    • Emerging projects (Arafura Nolans, Maaden-MP JV, Browns Range, Eneabba and others) are strategically important as diversification levers, yet most remain exposed to schedule risk, permitting friction, and infrastructure constraints.
    • Shipping routes, water availability, and radioactive waste rules are not side issues; they are central to uptime and ramp‑up reliability for nearly every major non‑Chinese supplier.

    Analytical Framework: How Operational Continuity Was Evaluated

    This review draws on public disclosures, technical reporting, and specialist analysis from 2025-2026 to assess each supplier on four operational axes: (1) ability to sustain or grow production through 2026-2030, (2) vulnerability to logistical and infrastructure disruptions, (3) exposure to regulatory and ESG constraints, and (4) geopolitical insulation from coercive trade dynamics. Instead of focusing solely on nominal tonnes of rare earth oxide (REO), the emphasis is on NdPr and HRE flows, since those underpin permanent magnets for EV traction motors, offshore wind turbines, precision‑guided munitions, and advanced aerospace systems.

    Within this framework, Lynas’ integrated Mt Weld–Kalgoorlie–Malaysia–Texas system and MP Materials’ Mountain Pass–US magnet strategy emerge as the primary pillars of non‑Chinese supply. Other projects are assessed relative to these anchors, with particular attention to how they alleviate – or replicate – existing bottlenecks.

    Lynas Rare Earths: Integrated Chain with Multi‑Jurisdictional Fragility

    Lynas controls one of the highest‑grade rare earth deposits at Mt Weld in Western Australia and operates a complex downstream chain that, by 2026, spans mining and concentration in Australia, cracking and separation in Malaysia, and a DoD‑funded heavy rare earth facility in Texas.

    Production Profile and Strategic Role

    For 2026, Lynas projects total REO production of about 16,100 tonnes, a 53% year‑on‑year increase, including approximately 8,800 tonnes of NdPr oxide with 35% growth. Company reporting indicates that NdPr accounts for the majority of revenue, and external analysis estimates Lynas covers around 5–7% of global NdPr demand. In the first half of its 2026 financial year alone, production had already reached 7,609 tonnes of REO, underpinning the likelihood of the full‑year target being technically achievable if operations remain stable.

    Lynas is also expanding into heavy rare earth separation. Following the first non‑Chinese commercial dysprosium (Dy) oxide production in May 2025, the company has highlighted an HRE program that begins with samarium (Sm) from April 2026 and is expected to scale to other elements including gadolinium (Gd), Dy, terbium (Tb), yttrium (Y) and lutetium (Lu) over the subsequent two years. Exact tonnages for each HRE stream have not been disclosed, but the presence of this capability outside China is structurally significant for high‑temperature magnet and defense applications.

    Operational Continuity: Strengths and Failure Points

    On the continuity side, Lynas benefits from several stabilizing factors:

    • A mature mine at Mt Weld with disclosed reserves around 2 million tonnes REO, providing resource security beyond the current decade.
    • An established separation facility in Malaysia with a track record of producing separated oxides at industrial scale.
    • A customer base reportedly aligned to long‑term strategic contracts rather than spot sales, dampening some short‑term market volatility in offtake patterns.
    • Flexibility to process third‑party feedstocks deemed ESG‑compliant, which can partially offset mine‑specific disruptions.

    that said, the same configuration carries embedded fragilities. The Australian ore is shipped to Malaysia for cracking and separation, creating exposure to maritime chokepoints and freight disruptions. During periods of Red Sea instability, for example, diversions increase lead times and operational complexity, especially when synchronized with maintenance outages or ramp‑up work on new circuits.

    Regulatory risk at the Malaysian plant is perhaps the most significant structural issue. The facility has been subject to ongoing scrutiny over the management of low‑level radioactive waste, particularly thorium‑bearing residues. Stricter environmental conditions and licensing reviews have already contributed to delays and limitations on HRE ramp‑up capacity. Any tightening in waste regulations, or political shifts around permitting, could constrain throughput or force reconfiguration of flows between Malaysia, Australia and the US.

    To mitigate part of this concentration risk, Lynas is building additional processing capability at Kalgoorlie in Western Australia and an HRE separation plant in Texas backed by US DoD funding. While these assets enhance diversification, they also introduce a classic ramp‑up challenge: overlapping commissioning schedules, acute engineering labor needs, and the need to stabilize three major facilities (Kalgoorlie, Malaysia, Texas) around the same mid‑decade window.

    Risk Inflection Points for Lynas

    • Malaysian licensing and waste policy: Any non‑routine change in thorium disposal requirements, license renewals, or community consent processes is a direct lever on effective capacity and uptime.
    • Shipping lane disruptions: Sustained instability in key trade routes linking Western Australia and Malaysia would increase lead times and inventory requirements, stressing working capital and scheduling.
    • Texas HRE ramp‑up: The US facility is intended to diversify geopolitical risk, but early‑stage operations can be prone to mechanical and process instability. Delays here would leave HRE reliance skewed back toward Malaysia.
    • Third‑party feedstock strategy: While processing external material adds resilience, it also brings variability in feed composition, which can challenge plant optimization if not carefully sequenced.

    Overall, Lynas is structurally critical for both NdPr and HRE availability outside China, yet its integrated chain remains sensitive to regulatory outcomes in Malaysia and execution risk across multiple expansion fronts.

    MP Materials: From Concentrate Exporter to Integrated US Magnet Supplier

    MP Materials operates the Mountain Pass mine in California, historically one of the world’s major light rare earth sources. The company has been transitioning from a concentrate‑focused model with shipments to China toward a fully integrated US supply chain encompassing mining, separation, and magnet manufacturing.

    Global landscape of leading rare earth mining and processing regions in 2026.
    Global landscape of leading rare earth mining and processing regions in 2026.

    Production Evolution and Strategic Significance

    By 2024/25, Mountain Pass had achieved a record output of roughly 45,000 tonnes REO in concentrate form, representing around 15% of global demand according to sectoral analysis. In 2026, the strategic pivot is toward refined oxides and magnets:

    • Stage II: High‑purity separated oxides, including announced heavy rare earth capability of around 200 tonnes per year of Dy/Tb once ramp‑up is complete.
    • Stage III: NdFeB magnet manufacturing targeting an initial 1,000 tonnes per year and a longer‑term goal of up to 10,000 tonnes by around 2028, enabled in part through a magnet facility backed by the US DoD.

    The company has also publicly stated that exports of concentrate to China ceased from the third quarter of 2025, with material retained for domestic processing. This move is strategically aligned with US policy priorities and positions MP as a cornerstone for domestic defense and EV motor supply chains.

    Operational Continuity and Structural Constraints

    Mountain Pass benefits from operating entirely within the US, removing cross‑border permitting and customs uncertainties that characterize multi‑jurisdictional chains. US regulatory frameworks are stringent but relatively predictable, and DoD participation adds stability around project funding horizons.

    At the same time, several operational risk factors stand out:

    • Ore profile: The deposit is heavily skewed to light rare earths, particularly cerium and lanthanum, with lower proportions of HREs. The announced 200 tonnes per year Dy/Tb capacity is strategically important but inherently limited by geology, which constrains how far MP can go in solving broader global HRE tightness on its own.
    • Water and environmental constraints: Mountain Pass is in a water‑stressed desert environment. Process water management, tailings stewardship, and regulatory scrutiny under California and federal rules are ongoing operational considerations that can affect throughput and expansion plans.
    • Stage II and III ramp‑up: Transitioning from concentrate to separated oxides and magnets introduces new technical and organizational complexity. Commissioning integrated chemical and metallurgical circuits has historically been a frequent stumbling block in the rare earth sector.
    • Labor and technical skills: The combination of mining, chemical processing, and advanced magnet manufacturing requires a specialized workforce, at a time when engineering and skilled labor shortages have been widely reported across North American industrial projects.

    DoD awards totalling over US$400 million since 2020, plus an additional heavy rare earth plant loan of around US$150 million, reduce financial uncertainty around Stage II and III development. Yet this same defense linkage exposes the project to US federal budget dynamics and policy shifts. Any future change in strategic priorities could alter the level of official support, which in turn would influence expansion pace and product mix.

    Saudi JV and Global Positioning

    In partnership with Saudi Arabia’s Maaden, MP Materials is advancing a joint venture intended to create a rare earth hub in the Kingdom, with HRE production targeted from around 2028. Current reporting places the project in pre‑construction following a 2025 final investment decision, with mine build activities expected to begin in the same period.

    For operational continuity, this JV has a dual character. It offers diversification away from North America and East Asia, locating capacity in a country that is actively pursuing industrialization under its Vision 2030 strategy. At the same time, the asset is likely to be exposed to desalinated water supply, desert logistics, and broader regional geopolitical tensions, including those linked to conflicts in neighboring countries and the volatility of hydrocarbon‑driven fiscal cycles. These factors create potential for supply interruptions that are different in nature from those faced at Mountain Pass, but no less material.

    Arafura Resources’ Nolans Project: High‑Impact Future Supply with Near‑Term Schedule Risk

    Arafura’s Nolans project in Australia’s Northern Territory is designed as an integrated mine and on‑site refinery focused on NdPr oxide. Public plans point to commercial start around 2028, with a full ramp‑up to approximately 4,440 tonnes per year of NdPr oxide expected between 2030 and 2032.

    From a supply‑chain risk perspective, Nolans’ main contribution is temporal: it aims to fill the mid‑to‑late‑decade NdPr deficit as demand from EVs, wind, and industrial motors continues to outpace present non‑Chinese capacity. Local refining is explicitly designed to bypass China for value‑added steps, strengthening supply assurance for customers requiring ex‑China compliance for sensitive applications.

    A modern rare earth mining operation illustrating the scale and complexity of extraction.
    A modern rare earth mining operation illustrating the scale and complexity of extraction.

    However, the project also illustrates standard development‑phase fragility. External reporting points to delays relative to initial schedules, driven by the complexity of building a full hydrometallurgical and separation plant in a remote, arid region. Logistics for reagents, water, and product shipment are challenging, and cost inflation has been a recurrent theme across Australian resources projects in the mid‑2020s. There is also an overlay of indigenous land and permitting processes specific to the Northern Territory, which can extend timelines if not carefully managed.

    If delivered broadly in line with current expectations, Nolans would become a key NdPr pillar for the early 2030s, partially relieving pressure on Lynas and MP, particularly if demand growth tracks higher‑end scenarios. Until construction is demonstrably de‑risked, though, its contribution remains more of a forward‑looking buffer than a secured component of the 2026–2030 baseline.

    Supporting and Emerging Supply Nodes: Diversification with Limited Near‑Term Volume

    Beyond the two main incumbents and Nolans, a range of smaller or earlier‑stage projects contribute to diversification, though often with modest tonnages or later start dates.

    Lynas USA Texas Facility and Kalgoorlie Expansion

    Lynas’ Texas heavy rare earth facility, constructed with substantial DoD support, is scheduled to ramp during 2026. It will be supplied by feedstock from Mt Weld, via Kalgoorlie and/or Malaysia. Strategically, this plant is designed to provide US‑based HRE separation for defense and critical industrial uses, reducing reliance on Malaysian processing for certain elements.

    From an operational risk standpoint, the Texas facility is still in the construction and commissioning phase. That introduces typical greenfield uncertainties: contractor performance, supply availability for critical equipment, and potential changes in US environmental permitting expectations, particularly regarding handling of radioactive residues. Any delay here would preserve reliance on Malaysia for longer, although the existence of multiple Lynas processing sites does offer some flexibility in how feedstocks are routed.

    Northern Minerals’ Browns Range and Other HRE‑Focused Assets

    Northern Minerals’ Browns Range project in Western Australia is one of the few Western operations explicitly focused on HREs such as Dy and Tb. Pilot operations have produced an estimated 500 tonnes per year of Dy/Tb‑rich concentrate, highlighting its potential strategic value for high‑performance magnet applications. However, current volumes are small relative to global requirements, and the project has faced repeated financing challenges and the inherent complexity of moving from pilot to full‑scale production.

    Iluka Resources’ Eneabba refinery, which processes monazite and other mineral sands‑derived feedstocks, is another important HRE‑capable asset. First REO output is targeted for 2026, with initial capacities in the hundreds of tonnes per year according to sector estimates, though detailed breakdowns remain limited. The key operational issue here lies in waste and by‑product management, given the presence of uranium and thorium in some monazite streams, and the need to integrate feed from multiple external mines that are optimized primarily for zircon and titanium minerals rather than rare earths.

    North American and Brazilian Projects: Round Top, Bahia, and Magnet Makers

    USA Rare Earth’s Round Top project in Texas is often cited for its HRE‑rich resource and its potential to supply both REOs and other critical materials. Current plans refer to an output around 2,000 tonnes REO from 2028 onwards, but the project remains subject to permitting, financing, and engineering milestones. Its location within the US is positive from a geopolitical standpoint, yet also subjects the project to the same environmental and community‑consultation structures that have elongated timelines for other mining developments.

    Energy Fuels’ Bahia project in Brazil, focused on monazite‑bearing heavy mineral sands, is expected to contribute HRE‑containing feedstock from around 2026 at an initial scale reported to be in the low hundreds of tonnes REO equivalent per year. While this provides jurisdictional diversification, it introduces another set of environmental and legal dynamics. Brazilian litigation around mining, indigenous rights, and land use is an ongoing factor to watch, alongside the reliability of export logistics from Brazilian ports to processing facilities in the US.

    The rare earth supply chain from extraction to advanced materials.
    The rare earth supply chain from extraction to advanced materials.

    On the magnet side, Noveon Magnetics in Texas represents an early example of domestic NdFeB magnet capacity in the US, with around 1,000 tonnes per year targeted for 2026 and DoD involvement to encourage recycling and closed‑loop supply. Noveon relies on upstream oxide availability from entities like Lynas and MP or recycled scrap, so its operational continuity is to some extent downstream of the mining and separation reliability discussed earlier.

    Multi‑Metal Projects: Alkane Dubbo and Similar Assets

    Alkane Resources’ Dubbo project in New South Wales is a multi‑metal venture, with a flow sheet designed to produce REOs alongside zirconium and niobium products. Plans call for around 4,000 tonnes REO from 2028, but final investment decision timing has been repeatedly pushed back. Multi‑commodity character can provide resilience once operational, since revenue is diversified across several critical materials, yet it complicates project financing and adds technical depth to commissioning and process optimization.

    Systemic Supply Chain Risks Through 2030

    When the ecosystem is viewed as a whole, a few structural realities become clear. First, non‑Chinese rare earth supply in 2026 remains highly concentrated in two incumbents. Combined, Lynas and MP Materials are estimated to provide around 100,000 tonnes REO equivalent of non‑Chinese capacity (including concentrate), covering roughly a quarter to a third of global demand. Despite this, sector assessments point to a continuing NdPr shortfall on the order of 10,000 tonnes, and an even tighter environment for key HREs such as Dy and Tb.

    Second, a significant portion of this volume relies on maritime transport between Australia, Malaysia, the US, and, prospectively, Saudi Arabia and Brazil. Disruptions in any of the major shipping arteries – whether through conflict, sanctions, piracy, or infrastructure accidents – would quickly manifest as delays in feedstock deliveries to separation plants and magnet facilities. The requirement to handle, store, and ship slightly radioactive material adds another layer of complexity to contingency planning.

    Third, environmental and social regulation is emerging as a central gatekeeper of operational continuity. Thorium‑bearing waste streams in Malaysia, water stewardship in California and Saudi Arabia, indigenous land rights in Australia and Brazil, and US federal and state permitting all represent non‑geological constraints determining how quickly capacity can be brought online and sustained. In several cases, project schedules have already been adjusted materially due to these factors.

    Fourth, policy‑driven funding – particularly from the US DoD – is now embedded in the business models of a number of key assets. This provides stability and demand assurance but introduces a policy‑cycle dependency: future administrations or budget environments may recalibrate priorities around domestic mining versus recycling, stockpiling, or allied‑nation sourcing.

    Signals to Watch for Supply Chain Stability

    Several observable developments over the coming few years will shape how robust the non‑Chinese rare earth supply chain becomes:

    • Lynas regulatory milestones in Malaysia: License renewals, waste disposal agreements, and any changes in treatment of thorium‑bearing residues will directly influence HRE availability and total NdPr output.
    • MP Stage II/III commissioning performance: Evidence of stable high‑purity oxide production and consistent magnet output at Mountain Pass and associated facilities will indicate that the integrated US pathway is functionally delivering on its design.
    • Nolans and Eneabba construction progress: Movement from site preparation to mechanical completion at these projects will materially alter the mid‑decade NdPr and HRE balance if executed close to planned timelines.
    • Geopolitical and maritime developments: Stability in the Red Sea, Straits of Malacca, and key Pacific routes will remain integral to the practical flow of ore and oxides between the main production hubs.
    • Evolution of recycling and substitution technologies: While still emerging, any large‑scale deployment of NdFeB recycling or partial substitution in lower‑spec applications would reduce pressure on primary supply and alter the risk landscape.

    After several years of monitoring this space, a consistent picture emerges: progress is real, with Lynas and MP Materials anchoring a gradually diversifying ecosystem, yet the system remains structurally exposed. Non‑Chinese rare earth supply in 2026–2030 is less a broad, redundant network and more a concentrated set of critical nodes, each carrying characteristic operational, regulatory, and geopolitical risks that require ongoing scrutiny.

  • Top 12 defense‑critical applications most exposed to gallium and rare earths

    Top 12 Defense‑Critical Applications Most Exposed to Gallium and Rare Earths

    Defense programs now live or die on access to a handful of obscure materials. Gallium and rare earth elements (REEs) sit at the center of this problem. China currently dominates roughly 98% of global REE processing and close to 89-98% of primary gallium production, while the United States relies on imports for essentially all of its separated rare earth oxides and high-purity gallium. When Beijing imposed export controls on gallium and germanium in 2023, prices jumped and lead times lengthened fast enough to register inside radar and missile programs within months.

    This briefing ranks the top 12 defense‑critical applications most exposed to gallium and rare earths, based on three lenses: kilograms of material per platform, concentration of supply in foreign entities of concern, and ease (or not) of substituting alternative technologies. The emphasis is on real operational exposure: radar arrays that can’t be fully populated, sonar systems waiting on permanent magnets, or guidance kits stranded in inventory because a single high‑purity oxide didn’t clear export licensing.

    We draw on USGS data, recent U.S. Department of Defense critical minerals strategies, disclosed platform material inventories, and on‑the‑ground updates from projects such as Rio Tinto’s gallium recovery initiative in Quebec, US Critical Materials’ Sheep Creek rare earth project in Montana, and recycling plays from Geomega, Vulcan Elements, and ReElement. Each entry lays out the role of gallium and REEs, the specific bottleneck, and the realistic resilience pathways between now and the late 2020s.

    What emerges is a risk map that looks very different from traditional “high‑value platform” lists. Radars and naval systems dominate the top tier, while some legacy airframes and soldier systems rank higher than many expect once tonnage and replacement difficulty are properly accounted for.

    1. F‑35 Lightning II AESA Radar and Mission Systems

    F‑35 Lightning II AESA Radar and Mission Systems – trailer / artwork
    F‑35 Lightning II AESA Radar and Mission Systems – trailer / artwork

    The F‑35 is the single most exposed U.S. platform to gallium and rare earth disruptions when tonnage, complexity, and strategic dependence are combined. Each aircraft is estimated to embed roughly 418 kg of rare earths across its radar, electric motors, actuators, and sensors, with 50-100 kg tied directly to the AN/APG‑81 active electronically scanned array (AESA) and associated mission systems. Gallium nitride (GaN) and gallium arsenide (GaAs) devices in the transmit/receive (T/R) modules underpin the jet’s long‑range, multi‑mode radar performance.

    Strategically, the F‑35 fleet is the backbone of allied airpower from Europe to the Indo‑Pacific. GaN allows much higher power density and efficiency than previous gallium arsenide or silicon technologies, enabling simultaneous air‑to‑air, air‑to‑ground and electronic attack functions. On the rare earth side, neodymium‑iron‑boron (NdFeB) magnets with dysprosium and terbium additives sit in electric actuators, pumps, and generators, where high‑temperature stability is non‑negotiable for stealth operations.

    The bottleneck is twofold: high‑purity gallium for GaN wafers and heavy rare earths (dysprosium, terbium) for high‑coercivity magnets. The U.S. has no primary gallium mining and very limited refining capacity; nearly all high‑purity gallium still originates in, or passes through, China. For heavies, China’s stranglehold on processing remains above 90%. DoD program offices have already reported radar module shortages in the 20% range during the first year of gallium export controls, forcing re‑sequencing of upgrade lots and stressing repair pipelines.

    Mitigation is underway but back‑loaded. Rio Tinto’s Quebec tailings‑based gallium recovery and domestic REE projects such as Sheep Creek could cover a slice of demand after 2026-2027, and recycling firms are experimenting with magnet and T/R module recovery from scrapped systems. For now, the verdict is simple: the F‑35 remains the highest‑exposure platform in the inventory, and any extended gallium or heavy REE disruption would propagate almost immediately into sortie generation and coalition readiness.

    2. Arleigh Burke DDG‑51 Aegis SPY‑6 Radar and Combat System

    Arleigh Burke DDG‑51 Aegis SPY‑6 Radar and Combat System – trailer / artwork
    Arleigh Burke DDG‑51 Aegis SPY‑6 Radar and Combat System – trailer / artwork

    If the F‑35 is the most visible gallium‑dependent asset, the SPY‑6 radar family on Arleigh Burke destroyers is the quiet tonnage heavyweight. A single Flight III DDG carries on the order of 2,600 kg of rare earth content tied to radar, power systems, and electric drives, with large surface‑mounted GaN T/R modules providing the backbone of 360‑degree air and missile defense. Peak power demands, particularly for ballistic missile and hypersonic tracking, push gallium device requirements into ranges where substitution is technically and operationally painful.

    Naval radars and combat systems stack REE exposures differently from aircraft. Beyond NdFeB magnets, systems such as SPY‑6 draw heavily on yttrium, gadolinium, and erbium for laser components, signal conditioning, and specialized alloys. The U.S. imported roughly 93% of its yttrium compounds from China in recent years, and the processing chain for gadolinium and erbium is similarly concentrated. Each destroyer is, in effect, a multi‑tonne bet on continued access to Chinese‑processed REEs and gallium.

    Programmatically, any radar production or upgrade delay ripples across ship delivery schedules, Aegis baseline rollouts, and regional missile defense postures. The combination of high unit value, long lead times, and limited alternative platforms means even modest material disruptions matter. On the supply‑side, proposed gallium recovery from alumina and zinc tailings in North America could cover a single‑digit percentage of global needs mid‑decade, while REE recycling initiatives (such as Geomega’s planned Montreal facility) may offer cost‑effective magnet feedstock but won’t immediately solve heavy rare earths for SPY‑6.

    Verdict: Arleigh Burke destroyers, and by extension Aegis‑equipped allies, form the naval epicenter of gallium and REE risk. Stockpiles for radar‑grade gallium and heavy REEs, longer‑horizon offtake agreements, and multiyear contracts with emerging recyclers are already becoming non‑negotiable for maintaining build and modernization schedules into the 2030s.

    3. Virginia‑Class Submarine Sonar and Combat Systems

    Virginia‑Class Submarine Sonar and Combat Systems – trailer / artwork
    Virginia‑Class Submarine Sonar and Combat Systems – trailer / artwork

    Submarine sonar suites quietly outrank most air and land systems once total rare earth tonnage is counted. A Virginia‑class attack submarine can embed around 4,600 kg of rare earth content across its main sonar array, towed arrays, quiet drive systems, and auxiliary motors. Low‑noise, high‑torque permanent magnet motors draw heavily on neodymium and dysprosium, while sonar arrays depend on specialized REE alloys (including scandium, ytterbium, and yttrium) and gallium‑based low‑noise amplifiers for long‑range, high‑fidelity detection.

    Strategically, these submarines are central to undersea dominance, covert strike options, and intelligence collection in contested waters. Sonar performance is not a “nice to have”; it underpins survivability against increasingly capable adversary ASW networks. The combination of acoustic stealth and sophisticated processing electronics means gallium and REEs touch almost every key system that differentiates a modern SSN from an older fast‑attack boat.

    Bottlenecks center on three materials: high‑purity gallium for RF and mixed‑signal electronics, dysprosium for high‑coercivity magnets in propulsion components, and scandium for select high‑performance alloys (for which the U.S. currently has essentially no primary production or refining). These are not materials that can be swapped out without deep redesigns and performance penalties. Program offices have already seen Block V schedules come under pressure from materials constraints more generally; if gallium or heavy rare earth availability tightens further, submarine builds are among the least flexible programs to re‑schedule.

    Verdict: Virginia‑class submarines sit in the top‑three exposure tier because they combine multi‑tonne REE dependence with ultra‑long program timelines and minimal substitution room. Any credible resilience plan must tie undersea programs directly into long‑term contracts with emerging domestic REE processors and recyclers, rather than treating them as generic “priority customers” in a tight market.

    4. Tomahawk and Long‑Range Cruise Missile Guidance Systems

    Tomahawk and Long‑Range Cruise Missile Guidance Systems – trailer / artwork
    Tomahawk and Long‑Range Cruise Missile Guidance Systems – trailer / artwork

    Long‑range cruise missiles like the Tomahawk Block V translate mineral supply issues directly into munitions stockpile math. Each missile only embeds tens of kilograms of rare earths and grams‑level gallium, but the exposure scales with volume: inventories run in the thousands, and surge scenarios demand rapid replacement. REE content concentrates in samarium‑cobalt and NdFeB magnets for actuators and control surfaces, as well as in navigation and seeker components. Gallium‑based RF chips support terrain‑following radar, data links, and precision guidance under jamming.

    In strategic terms, Tomahawks and similar systems provide stand‑off strike options that don’t require penetrating contested airspace with manned platforms. They’re also the bridge capability while hypersonic programs mature. Recent conflicts have shown how quickly precision munitions inventories can be drawn down; REE and gallium supply now constrains how fast those stocks can be rebuilt even if the industrial base has assembly capacity.

    The bottleneck is high‑purity heavy REEs (dysprosium, terbium) for magnets that must survive extreme temperature swings and vibration without demagnetizing, and RF‑grade gallium for microwave components. Regulatory and export frictions compound the problem: even small volumes of specialty oxides and wafers face long lead times when export licenses tighten. Domestic magnet manufacturing is still nascent, and while several U.S. projects aim to produce military‑grade NdFeB within a few years, samarium‑cobalt and heavy REE supply chains remain significantly exposed to Chinese processing.

    Verdict: Cruise missiles rank high on exposure because they combine critical operational roles, high consumption rates, and concentrated material bottlenecks in guidance and control sections. Program managers who assume “small system equals low risk” are already finding that a handful of grams of constrained materials can hold up entire production lots.

    5. JDAM and Other Precision Guidance Kits

    JDAM and Other Precision Guidance Kits – trailer / artwork
    JDAM and Other Precision Guidance Kits – trailer / artwork

    Guidance kits such as the Joint Direct Attack Munition (JDAM) and laser‑guided bomb add‑ons turn large inventories of unguided munitions into precision weapons. From a materials perspective, their exposure profile looks very different from Tomahawk‑class missiles: each kit carries a smaller rare earth and gallium footprint (on the order of a few kilograms of REEs and sub‑kilogram gallium content), but annual unit volumes can reach into the hundreds of thousands in high‑tempo periods.

    Strategically, JDAM‑type kits are the workhorses of modern air campaigns. Yttrium‑ and ytterbium‑doped fiber lasers, REE‑based phosphors, and gallium‑based semiconductors sit inside the seeker heads and guidance electronics, enabling terminal accuracy that keeps collateral damage and sortie counts down. When these materials tighten, the stress doesn’t necessarily appear as a total production halt; instead, it can manifest as lower yields, degraded performance bins, or reduced availability of the most capable variants (for example, all‑weather or moving‑target configurations).

    The bottleneck here is primarily in yttrium and associated REEs for laser and sensor systems, paired with mid‑grade gallium components manufactured on mature process nodes. The U.S. is heavily reliant on Chinese‑origin yttrium, and although alternative sources exist on paper, qualifying new suppliers for high‑reliability guidance electronics is a multi‑year exercise. As Ukraine and other theaters have absorbed large numbers of precision kits, procurement officers have begun to confront the reality that materials supply, not only explosives and casings, sets the ceiling for sustainable output.

    Verdict: Guidance kits rank mid‑pack on per‑unit exposure but high on aggregate risk because of their extraordinary consumption rates. They’re an early indicator sector: when JDAM‑class programs start flagging material issues, it’s usually a sign that higher‑value platforms will feel pressure next.

    6. F‑35 Electro‑Optical Targeting and Sensor Fusion Suite

    Staying with the F‑35 but shifting from radar to optics, the Electro‑Optical Targeting System (EOTS) and distributed aperture sensors are another major node of REE and gallium exposure. These systems integrate infrared search and track (IRST), laser designation, and high‑resolution imaging into the jet’s sensor fusion backbone. Gallium arsenide and related compounds underpin mid‑wave infrared detectors and focal plane arrays, while REE‑doped lasers and phosphors (involving elements such as terbium, europium, and yttrium) enable precise target designation and low‑signature emissions.

    Strategically, these sensors are central to the F‑35’s value proposition in contested environments. They offer passive targeting options when radar emissions are risky, and they feed the common operating picture that other platforms increasingly rely on. Unlike some legacy pods that can be swapped or downgraded, the EOTS and associated apertures are tightly integrated into the airframe and mission software, making any redesign to avoid constrained materials extremely complex.

    Bottlenecks mirror radar in some respects-high‑purity gallium compounds and heavy REEs-but optical systems add another layer of complexity: their performance is highly sensitive to materials quality, defect densities, and subtle process changes. That makes rapid supplier changes much harder. Program offices have already had to pace some sensor upgrade roadmaps to align with secure material sourcing, rather than pure engineering readiness. Meanwhile, potential domestic REE projects that could deliver terbium and dysprosium at scale are several years away from full qualification for such sensitive applications.

    Verdict: The F‑35’s electro‑optical suite is less of a tonnage giant than its radar and power systems, but its reliance on ultra‑high‑spec gallium compounds and heavy REEs pushes it into the top half of this ranking. Any serious effort to harden the F‑35 supply chain needs to treat EOTS and apertures as co‑equal to AESA modules in material planning.

    7. Predator/Reaper‑Class UAV Radars and ISR Payloads

    Predator/Reaper‑Class UAV Radars and ISR Payloads – trailer / artwork
    Predator/Reaper‑Class UAV Radars and ISR Payloads – trailer / artwork

    Uncrewed systems like the MQ‑9 Reaper and its successors present a different risk profile: lower unit value than manned fighters, but rapidly expanding fleets and sensor payloads. Synthetic aperture radar (SAR) and ground moving target indicator (GMTI) systems such as the Lynx radar are built increasingly around GaN T/R modules and rely on high‑precision NdFeB magnets in gimbal drives and stabilization systems. A typical ISR‑configured UAV might carry 20–50 kg of REEs across radar, electro‑optical systems, and electric actuators, alongside modest but non‑trivial gallium content in RF front ends and datalink amplifiers.

    From a strategic perspective, these aircraft underpin persistent ISR, pattern‑of‑life analysis, and long‑dwell strike options in theaters where deploying manned assets is politically or operationally constrained. As concepts of operation shift toward larger uncrewed fleets and, in some cases, swarming systems, the aggregate demand for gallium‑ and REE‑bearing sensors is poised to rise sharply, even if per‑airframe content doesn’t match a fifth‑generation fighter.

    The bottleneck here is mostly on the radar and high‑throughput communication side: GaN production at defense‑grade quality is concentrated among a small number of foundries, which in turn depend on Chinese‑linked gallium supply chains. There’s also emerging pressure on actuator and gimbal magnets as total fleet counts climb. While UAV platforms might be more amenable to performance trade‑offs or tiered capability configurations, export‑controlled ISR payloads can’t simply pivot to commercial‑grade materials without compromising mission profiles.

    Verdict: Predator/Reaper‑class platforms sit in the middle of the ranking but are the growth vector to watch. As more roles migrate to uncrewed systems, gallium and REE demand will follow, pushing these platforms from “secondary” to “core” consumers in supply negotiations.

    8. Virginia‑Class and Other Nuclear Submarine Propulsion Motors

    Virginia‑Class and Other Nuclear Submarine Propulsion Motors – trailer / artwork
    Virginia‑Class and Other Nuclear Submarine Propulsion Motors – trailer / artwork

    Submarine propulsion deserves a dedicated entry separate from sonar because the risk profile is subtly different. Modern quiet propulsion systems increasingly rely on large permanent magnet motors using neodymium‑iron‑boron with significant dysprosium content for high‑temperature stability. Individual motors can incorporate thousands of kilograms of rare earth magnets once stator and rotor assemblies, auxiliary drives, and pump systems are accounted for. Gallium also appears in high‑efficiency power electronics modules that modulate and control these motors.

    Strategically, propulsion dictates acoustic signature, endurance, and overall survivability for nuclear submarines. Transitioning to high‑efficiency permanent magnet motors has delivered major gains in performance and noise reduction compared to legacy induction designs, but it has also locked these platforms into one of the most constrained corners of the rare earth market. Heavy REEs like dysprosium are critical to maintain magnet performance at elevated temperatures; without them, designers must either accept larger motors, lower performance, or more complex cooling systems.

    The bottleneck is stark: China dominates the mining and processing of heavy rare earths used in high‑coercivity magnets. Alternative chemistries and motor architectures are under active development, but any wholesale shift for submarine propulsion would involve a major redesign and re‑qualification effort stretching over many years. Recycling firms targeting NdFeB magnet recovery from end‑of‑life industrial equipment and vehicles can help supplement supply, but the purity, coercivity, and traceability requirements for naval propulsion magnets are at the high end of the spectrum.

    Verdict: Propulsion systems place Virginia‑class and other nuclear subs near the top of the REE risk table from a pure tonnage and substitution standpoint. Even if sonar and combat systems are prioritized for the first wave of resilient material sourcing, propulsion magnets will need dedicated strategies and long‑term contracts if future submarine availability is to be protected.

    9. High‑Energy Laser (HEL) and Directed‑Energy Weapon Systems

    High‑Energy Laser (HEL) and Directed‑Energy Weapon Systems – trailer / artwork
    High‑Energy Laser (HEL) and Directed‑Energy Weapon Systems – trailer / artwork

    Directed‑energy systems might still be emerging in terms of deployed numbers, but their materials footprint is already significant. Army, Navy, and Air Force high‑energy laser demonstrators in the 50–300 kW range typically rely on ytterbium‑ and neodymium‑doped fiber or slab lasers, drawing heavily on REEs such as ytterbium, neodymium, and yttrium, along with gallium‑based pump diodes and control electronics. A single high‑power HEL system can embed over 100 kg of REEs once power conditioning, beam control, and cooling subsystems are included.

    Strategically, these systems are attractive precisely because they promise low cost‑per‑shot against drones, rockets, and, eventually, cruise missiles. That “unlimited ammo” narrative often glosses over the fact that the upfront material inputs are both specialized and geopolitically exposed. As programs like DE M‑SHORAD and ship‑mounted lasers move from prototypes to larger low‑rate production, demand for specific REE grades and gallium‑based diodes will grow quickly from a low baseline.

    The bottleneck landscape here mixes old and new problems. On the REE side, ytterbium and yttrium supply is tightly linked to the broader Chinese‑centric rare earth processing system; they’re typically by‑products of larger light‑REE operations, making targeted ramp‑ups difficult. On the gallium side, HEL systems often need diodes with very high reliability and narrow wavelength characteristics, limiting the number of qualified suppliers. Because directed‑energy programs are still consolidating architectures, there’s an opportunity to design for material resilience, but that window will narrow rapidly once particular designs are locked in for serial production.

    Verdict: High‑energy laser systems are not yet the largest absolute consumers of gallium and REEs, but they’re climbing the ranking as they transition from science projects to operational capabilities. Their exposure today is a leading indicator of how future point‑defense and counter‑drone architectures will amplify critical mineral demand.

    10. Enhanced Night Vision and Soldier‑Borne Imaging Systems

    Enhanced Night Vision and Soldier‑Borne Imaging Systems – trailer / artwork
    Enhanced Night Vision and Soldier‑Borne Imaging Systems – trailer / artwork

    At the other end of the scale from submarines and ships, soldier‑level systems like Enhanced Night Vision Goggles (ENVG‑B) and integrated visual augmentation devices embed small amounts of gallium and REEs per unit but at extremely high unit volumes. These devices often use gadolinium‑based scintillators, europium‑ and terbium‑doped phosphors, and gallium‑based semiconductor sensors (such as gallium arsenide or gallium phosphide) in image intensifier tubes and thermal imagers.

    Strategically, these systems define night‑fighting capability and situational awareness for ground forces. As militaries move toward fused thermal/optical displays and augmented‑reality overlays, the sophistication-and material complexity—of soldier‑borne optics rises. While a single goggle might only contain grams of gallium and REEs, equipping hundreds of thousands of soldiers translates into multi‑tonne aggregate demand. Moreover, these devices sit at the intersection of military and commercial imaging supply chains, which already compete for sensor and phosphor capacity.

    The bottleneck lies in specialty REE compounds for phosphors and scintillators, which rely on high‑purity europium, terbium, and gadolinium refined through Chinese‑dominated chains, paired with gallium‑based sensor wafers from a relatively small number of global fabs. Because soldier systems have somewhat more flexibility in form factor and performance than, say, fighter radar modules, there is room for partial substitution or tiered capabilities across units. However, experiments with alternative phosphor chemistries and non‑gallium sensor technologies are still early, and any significant degradation in performance would have clear tactical consequences.

    Verdict: Night vision and soldier‑borne sensors rank lower on per‑unit exposure but high on political and operational sensitivity. Any noticeable degradation in availability or performance would be highly visible across the force, making them important candidates for early recycling pilots and diversified sourcing of phosphor and sensor materials.

    11. Secure Military SATCOM and Jam‑Resistant RF Links

    Secure Military SATCOM and Jam‑Resistant RF Links – trailer / artwork
    Secure Military SATCOM and Jam‑Resistant RF Links – trailer / artwork

    Secure beyond‑line‑of‑sight communications—whether through systems like MUOS, advanced tactical SATCOM terminals, or protected waveform radios—depend heavily on high‑performance RF front ends. Gallium nitride and gallium arsenide power amplifiers sit at the heart of these terminals, while REE‑based components such as garnet circulators, lutetium‑containing filters, and magnetically biased isolators ensure stable, jam‑resistant links under contested conditions.

    Strategically, these links are the glue for command, control, communications, computers, intelligence, surveillance, and reconnaissance (C4ISR) architectures. As adversaries invest in electronic warfare and anti‑satellite capabilities, the premium on high‑linearity, high‑power RF chains—and thus on gallium devices and specialized REE components—only increases. The shift toward proliferated low‑Earth orbit constellations doesn’t remove this dependency; it multiplies the number of terminals that need high‑spec RF hardware.

    The bottlenecks mirror those in radar to some degree: high‑purity gallium supply and a narrow supplier base for defense‑grade GaN/GaAs MMICs. But SATCOM adds unique pressure on certain REEs, including lutetium and terbium in niche filter and isolator applications where performance windows are tight and alternatives limited. Many of these components are sourced through long, opaque supply chains that weave through commercial telecom vendors, making traceability and rapid qualification of alternative material sources challenging.

    Verdict: Secure SATCOM doesn’t rival F‑35s or destroyers in raw tonnage, but the systemic impact of disruptions pushes it into the top‑tier exposure set. A handful of gallium wafer lots or REE‑based RF components can become the pacing factor for fielding jam‑resistant communications across entire theaters.

    12. F‑16 and Other Legacy Fighter Engine and Control Actuation

    F‑16 and Other Legacy Fighter Engine and Control Actuation – trailer / artwork
    F‑16 and Other Legacy Fighter Engine and Control Actuation – trailer / artwork

    Legacy platforms like the F‑16 are often treated as “lower risk” in modernization debates, but their sustainment stories say otherwise. Engine control systems, actuators, and auxiliary power units in these aircraft make extensive use of samarium‑cobalt and NdFeB magnets with dysprosium additives, along with gallium‑based sensors and control electronics in full authority digital engine control (FADEC) units. Per aircraft, REE content can reach into the tens of kilograms in aggregate once actuators, generators, and radar components are included.

    Strategically, these fighters remain the backbone of many allied air forces and are heavily represented in export and security assistance programs. The surprise is not that they use critical materials; it’s that their long production history often masks how dependent ongoing sustainment has become on modern gallium/REE‑bearing subsystems introduced through upgrades. As new F‑16 variants and retrofit packages adopt AESA radars and more advanced mission computers, their exposure profile increasingly resembles newer platforms, even if airframes date back decades.

    The bottleneck is twofold: ensuring continuity of supply for high‑temperature magnets used in engines and actuators, and maintaining access to gallium‑based electronics for upgraded radars and avionics. Unlike newer programs, legacy fleets often lack fully mapped, end‑to‑end visibility into their material supply chains, making it harder to prioritize which components to re‑design or dual‑source. Engine overhauls and radar retrofit schedules have already experienced delays that trace back, at least in part, to constrained availability of certain magnet and semiconductor components.

    Verdict: F‑16s and other legacy fighters close out this top‑12 list not because their exposure is trivial, but because they offer slightly more flexibility in pacing upgrades and cannibalizing retired airframes. Even so, sustained pressure on gallium and heavy REE markets will increasingly force explicit tradeoffs between keeping legacy fleets modernized and feeding next‑generation platforms.

    Strategic Supply‑Chain Takeaways

    Viewed together, these twelve applications reveal a consistent pattern: a relatively small set of gallium and rare earth processing nodes underpins capabilities that span the entire kill chain, from early warning and ISR to precision strike and last‑mile soldier systems. Rough estimates suggest that U.S. defense programs alone are exposed to several billion dollars per year in cumulative spend tied directly to REEs and gallium, with the highest concentration in radar, sonar, propulsion, and secure communications.

    History offers a useful comparison. During the Cold War, supply risk debates focused on chrome, cobalt, and platinum‑group metals for armor and jet engines. Those materials still matter, but the current cycle is different in two important ways: first, gallium and REEs sit deeper inside complex, high‑tech components that can’t be easily substituted or stockpiled in finished form; second, processing is far more geographically concentrated today than nickel or copper ever were. The result is a tighter coupling between geopolitical friction and day‑to‑day readiness metrics like radar availability, sortie rates, and submarine deployment cycles.

    Mitigation pathways fall into three broad buckets. Near term, stockpiling high‑purity oxides, metals, and even key intermediates (such as magnet alloy powders and GaN wafers) can buffer 6–18 months of disruption, particularly for top‑tier applications like F‑35 radar modules and SPY‑6 arrays. Medium term, domestic projects targeting REE separation, magnet manufacturing, and gallium recovery from bauxite or zinc tailings can meaningfully reduce dependence if they’re tied to firm offtake commitments and realistic timelines. Longer term, recycling and design‑for‑recovery—through initiatives led by firms like Geomega, Vulcan Elements, and ReElement—offer the only scalable way to decouple defense capabilities from continuously rising primary extraction.

    Two failure modes are worth keeping in view. The first is over‑reliance on optimistic project announcements without factoring in permitting, qualification, and cost curves; this can create a false sense of security in program planning. The second is treating each platform in isolation, rather than recognizing that F‑35s, destroyers, submarines, and soldier systems compete for overlapping material pools. As export controls and geopolitical competition evolve through the late 2020s, the programs that fare best will be those that move early to secure diversified, transparent supply for the specific gallium and REE chemistries that matter most to their readiness.

  • Review: insurance, trade‑credit, and financing terms for high‑risk materials flows

    Review: insurance, trade‑credit, and financing terms for high‑risk materials flows

    Insurance, trade-credit, and structured financing terms now play a decisive role in whether rare earths, battery metals, and precious metals actually move from pit to plant to end-user. In high-risk materials flows-where geopolitical exposure, single-asset dependencies, and concentrated buyers or sellers already strain continuity-financial conditions often magnify or cushion physical shocks. Over successive assessment cycles at Materials Dispatch, this financial layer has emerged as a core determinant of operational resilience, not a peripheral detail handled at contract close.

    Executive Overview

    The current landscape of rare earths, strategic metals (such as lithium, cobalt, nickel, tungsten, titanium) and precious metals (gold, silver, platinum, palladium) is shaped by three interacting risk fields: physical supply constraints, regulatory and geopolitical shifts, and the structure of insurance and financing arrangements that sit on top of each shipment or project. The physical side is relatively well understood: concentrated production in regions such as the Democratic Republic of Congo (DRC) for cobalt, China for rare earths and graphite, South Africa and Russia for platinum group metals, and Indonesia for nickel. The financial side is more opaque, yet fieldwork across traders, miners, and lenders shows that insurance and trade-credit decisions often determine which flows continue under stress and which seize up.

    Across multiple metals chains examined in 2023-2024, three recurring patterns stood out. First, credit and political risk insurance frequently act as amplifiers: if coverage is withdrawn or terms are tightened at the same time as a physical disruption, liquidity evaporates precisely when it is most needed. Second, when coverage is thoughtfully structured and maintained, it can mute shocks by allowing banks to keep pre-financing cargoes or supporting buyers with longer tenors, even while ports, borders, or counterparties are under strain. Third, there is a growing divergence between projects and counterparties with access to robust risk-transfer structures and those that remain dependent on balance sheets and unsecured trade relationships.

    • Insurance and trade-credit terms have become core operational variables in rare earth, cobalt, nickel, and PGM flows, not just financial afterthoughts.
    • Coverage decisions by a relatively small group of global insurers and export credit agencies can trigger step-changes in trade continuity for entire corridors.
    • Non-payment, political risk, and business interruption covers often determine whether miners and traders can maintain covenant compliance during logistics or regulatory shocks.
    • Risk inflection points frequently emerge around changes in sanctions regimes, environmental regulation, or power reliability, where insurers reassess portfolios.
    • Signals worth monitoring include capacity shifts in export credit programs, insurer appetite for DRC and Russia-linked exposures, and any broad tightening of limits on Chinese counterparties.

    Defining High-Risk Materials Flows and Financial Amplifiers

    High-risk flows in this context are not simply those with price volatility. In the field, the operations most exposed to financial amplification effects typically combine three traits: concentration (a small number of mines, smelters, or refiners supplying the bulk of global demand), jurisdictional or sanctions risk, and highly specialized end-use demand where substitutions are slow or technically constrained. Cobalt hydroxide shipped from the DRC to Chinese refiners, palladium exported from Russia and South Africa to autocatalyst manufacturers, and neodymium-praseodymium (NdPr) oxides moving from Chinese, Australian, or US producers into magnet makers are familiar examples.

    In these chains, physical shocks often appear first as production or logistics issues: a pit wall failure at a single cobalt mine, new export paperwork requirements for rare earth oxides, load-shedding that interrupts smelting in South Africa, or sanctions that complicate payments to Russian entities. On their own, such events can be managed with inventory buffers, alternative routes, or temporary shutdowns. The picture changes sharply once lenders and insurers respond. Underwriters can shorten tenors, reduce insured limits, raise deductibles, or exclude specific jurisdictions. Banks, in turn, mark up risk weights on trade finance lines or pause new facilities.

    The result, seen repeatedly in trader and miner files reviewed over the past few years, is that a 10-20% disruption in physical supply can lead to a far larger contraction in tradeable volumes once the financial layer responds. Pre-payment structures critical to keeping production flowing in capital-constrained jurisdictions rely on confidence that insurers and banks will continue to stand behind counterparties. Once this confidence is questioned, working capital available to the chain shrinks rapidly, and operational continuity becomes much harder to maintain.

    Insurance Structures from Project Stage to Steady-State Operations

    Project-Level Risk Transfer for Rare Earth and Battery Metal Mines

    At the development stage, several rare earth and battery metal projects examined in North America and Australia have explored or implemented insurance-backed structures that effectively monetize reserves or future production. The core idea is straightforward: an insurer or syndicate underwrites a portion of the future production or revenue stream against specific risks-price, political disruption, or counterparty non-performance—allowing the project to raise debt or quasi-equity against that insured stream.

    In one North American rare earth project reviewed during 2024, the operator used an insurance wrap linked to independently certified reserves to support discussions with banks that had limited rare earth appetite on an unsecured basis. The underwriting process required detailed scrutiny of resource estimates, metallurgy, permitting status, and jurisdictional risk. Operationally, the most time-consuming elements were not the premium negotiation but the alignment of technical reports (such as NI 43‑101 style disclosures) with the insurance policy language. Once in place, the structure gave lenders additional comfort that, if export or pricing conditions deteriorated within defined parameters, the project’s repayment capacity would not collapse entirely.

    Similar approaches have been seen in platinum group metal (PGM) and gold operations exposed to intermittent power supply or labor unrest. Business interruption covers, structured around production outages rather than physical damage alone, have provided a buffer where smelters and concentrators in South Africa faced extended load-shedding. The key operational friction point in those cases has been the calibration of waiting periods and loss definitions: short outages rarely trigger claims, so mines must still absorb a portion of volatility directly. Longer disruptions, however, can be partially offset by insurance proceeds that maintain debt service and payroll, limiting forced shutdowns.

    Political and Non-Payment Risk in Commodity Trading

    Once production is flowing, the focus shifts from asset risk to counterparty and political risk. Non-payment and non-performance policies tailored to commodity traders have become central to flows out of high-risk jurisdictions. In underwriting files for DRC cobalt, for example, insurers routinely scrutinize not only the balance sheets of trading entities but also the quality of their offtake contracts, inspection arrangements at loading ports, and diversification of buyer portfolios in China, Korea, and Europe.

    High‑risk materials supply chains are shaped by how insurance, trade credit, and financing terms absorb or amplify shocks.
    High‑risk materials supply chains are shaped by how insurance, trade credit, and financing terms absorb or amplify shocks.

    Typical policies examined in this segment combine coverage for failure to deliver (e.g., a mine or exporter that cannot ship due to legal, political, or physical disruption) with protection against buyer non-payment. Political risk riders often extend to currency inconvertibility, expropriation, and war or civil disturbance. When well-structured and continuously maintained, these covers allow traders to finance pre-payments to mines that lack access to bank funding directly. Banks financing those traders, in turn, look closely at the wording of assignment clauses, the credit rating of the insurer, and any sanctions or compliance carve-outs.

    Russia-related PGM and nickel flows have become a particularly sensitive test case. Following the introduction of sanctions and payment restrictions, several banks reduced or exited direct exposure to Russian mining entities. In the cases reviewed, traders that maintained flows often did so under heightened reliance on political risk insurance, additional due diligence on routing and ultimate beneficiaries, and tighter internal concentration limits. Where insurers signaled reduced appetite, even well-secured physical streams faced curtailed financing capacity, forcing material to seek alternative paths or remain stranded.

    Trade Credit Insurance and Receivables Risk Across the Value Chain

    Trade credit insurance (TCI) sits on the demand side of the chain, covering the risk that a buyer of metals or intermediates fails to pay invoices. In strategic metals, this is not an abstract concern: cathode active material producers, alloy makers, and magnet manufacturers often run large working capital balances as they bridge between upstream miners and downstream original equipment manufacturers (OEMs). When a major OEM delays payment or faces liquidity pressure, the impact can cascade quickly.

    Across cases reviewed in battery metals and precious metals, TCI policies commonly cover a high percentage of eligible invoices against insolvency, protracted default, and occasionally political events affecting payment. Policies may be structured on a whole-turnover basis (covering a portfolio of buyers) or as single-risk covers for particularly large or risky counterparties. Insurers provide credit limits for each buyer, which effectively cap how much unsecured exposure a supplier is prepared to hold.

    For a silver producer supplying industrial users in electronics and solar, for instance, non-cancellable credit limits from a reputable insurer can support longer payment terms for key customers in Asia or Europe. This, in turn, can smooth sales volumes and production planning. In evaluations of such arrangements, two operational benefits stood out: reduced volatility in cash collections during sector downturns, and improved ability to allocate scarce production to customers with insured capacity rather than those offering only short-term premium pricing.

    However, TCI can also constrain trade during periods of heightened geopolitical or sector-specific stress. In 2023-2024, several insurers reassessed exposure to certain sectors and regions. Anecdotally, limits related to entities in higher-risk jurisdictions were tightened, and in some cases, coverage for new buyers was declined even where commercial interest existed. For miners and refiners with concentrated customer bases—common in niche alloys or magnet materials—such tightening can create a hard boundary on achievable sales volumes, irrespective of market demand.

    Insurance wraps and trade credit structures sit alongside equity and debt in financing high‑risk mining projects.
    Insurance wraps and trade credit structures sit alongside equity and debt in financing high‑risk mining projects.

    Financing Terms, Bank Behavior, and Capital Relief

    Banks financing mining, trading, and processing operations in high-risk metals consistently view insurance coverage as a lever to manage regulatory capital and internal risk appetite. From a risk-weighted asset (RWA) perspective, a receivable or pre-payment backed by an A-rated insurer is treated very differently from one exposed solely to a single-asset producer in a fragile jurisdiction. This differential often translates into larger borrowing bases, longer tenors, or more stable availability under borrowing base facilities.

    Export credit agencies (ECAs) add another layer. In precious and strategic metals, ECAs in the United States, Europe, and parts of Asia have supported mining equipment exports, smelting projects, and long-term offtake arrangements, particularly where flows align with national critical minerals strategies. In several transactions reviewed, ECA-backed insurance or guarantees on buyer payment risk allowed upstream projects to secure financing that would have been difficult on a purely commercial basis. From an operational continuity perspective, such backing often anchors long-term offtake relationships, giving mines and refineries clearer visibility on volumes and counterparty behavior over many years.

    The interplay between bank advance rates, insurance coverage, and collateral structures appears repeatedly in deal documentation. Where trade credit insurance covers sales to a diversified set of buyers, banks are more inclined to finance receivables and inventory at higher advance ratios. Where political risk insurance and non-payment cover wrap large pre-payments, traders can extend financing to mines that would otherwise sell material on a strict shipped-against-cash basis. Each of these structures increases the system’s ability to keep material moving when isolated shocks occur. Conversely, when insurers withdraw or narrow coverage, banks usually react quickly, pulling back availability and forcing sudden de-leveraging.

    Critical Findings and Risk Inflection Points

    Across rare earth, battery metal, and precious metal chains evaluated, several structural realities emerged that are central to any operational continuity assessment.

    1. Financial and physical risk are tightly coupled. In practice, very few disruptions remain “purely physical.” When a new export licensing regime slows rare earth shipments, or when an election cycle introduces uncertainty in a cobalt-producing country, the immediate concern on the ground may be port queues or local unrest. Within weeks, however, insurers revisit exposure assumptions, banks reassess lines, and trade-credit limits are recalibrated. The availability and price of working capital often change faster than physical production, creating a second-wave effect that can be more severe than the initial disruption.

    2. Concentrated insurance markets create systemic nodes. A relatively small group of global insurers, reinsurers, and ECAs provide the bulk of specialized cover for metals flows. Internal underwriting decisions at a handful of institutions can effectively reprice or restrict risk for an entire corridor or commodity. This is particularly noticeable in DRC-related cobalt flows and Russia-linked PGM shipments, where underwriting guidelines on sanctions and political risk directly influence bank willingness to finance cargoes.

    3. Project-stage risk transfer influences which deposits enter production. Developers able to secure insurance-backed monetization of reserves or long-term offtake risk typically find a broader range of financing options, particularly for capital-intensive processing plants such as hydrometallurgical refineries or separation facilities. Those reliant on equity alone or unsecured debt face longer lead times and greater vulnerability to market cycles. In strategic metals where policy frameworks encourage domestic or allied supply (for example, under critical minerals initiatives in the US, EU, Japan, and others), insurance-supported structures can tilt the competitive balance between projects.

    4. Trade credit insurance shapes customer portfolios. In both battery metals and precious metals, suppliers increasingly segment customers into those backed by robust insured limits and those that remain effectively uninsured. Under stress, allocation decisions often favor insured exposures, as these provide a clearer path to maintaining borrowing bases and avoiding sudden receivables shocks. For downstream manufacturers dependent on niche metals, this dynamic can mean that access to insurance, rather than price alone, influences which suppliers and volumes remain available during tight markets.

    5. Regulatory and ESG shifts are emerging risk triggers. Environmental regulations, sanctions, and supply-chain transparency requirements increasingly influence insurer appetite. New disclosure rules on forced labor, carbon intensity, or traceability can trigger portfolio reviews. In tungsten, cobalt, and nickel audits examined recently, underwriters have paid close attention to independent ESG assessments and chain-of-custody certifications. Where reports raise concerns, coverage has been narrowed or declined, even when traditional credit metrics looked adequate. This introduces a new category of inflection point: regulatory or ESG findings can translate into immediate changes in available credit insurance and political risk cover.

    Signals to Monitor for Ongoing Operational Continuity

    From an operational continuity standpoint, insurance and financing terms are no longer stable background conditions; they are dynamic variables that react to both macro and asset-specific developments. Several signals warrant ongoing attention when evaluating high-risk materials flows.

    Insurance and trade‑credit structures can either mute or amplify supply shocks in strategic metals trade.
    Insurance and trade‑credit structures can either mute or amplify supply shocks in strategic metals trade.

    First, changes in insurer appetite for specific jurisdictions or metals segments often precede visible trade disruptions. Internal decrees limiting new exposure to a given country, or raising minimum pricing for certain classes of risk, may not be public but can usually be inferred from feedback during policy renewals and discussions with brokers. Repeated adjustments in deductibles, tenor limits, or buyer limits in a narrow time window often indicate that a corridor is moving into a higher-risk category.

    Second, ECA policy updates related to critical minerals provide early clues about which flows are likely to receive enhanced support. Where agencies publish priority lists or guidance documents highlighting specific metals or value-chain stages—such as processing or recycling facilities—lenders and insurers frequently align structures accordingly. In previous reviews of rare earth and lithium projects, ECA interest has often correlated with an ability to secure longer-dated, lower-risk financing tranches linked to export or offtake commitments.

    Third, regulatory changes in major consuming blocs, particularly around sanctions, supply-chain due diligence, and environmental performance, rapidly feed into underwriting. The introduction or tightening of sanctions can lead to near-immediate reassessment of Russia-linked, Iran-linked, or other sensitive exposures, directly impacting PGM and certain base metal flows. Similarly, new due diligence requirements for battery supply chains in Europe or North America influence how easily insurers can gain comfort with cobalt, lithium, nickel, and manganese sourced from higher-risk jurisdictions.

    Finally, the structure of pre-payment and offtake agreements at mine and smelter level serves as a revealing diagnostic. Long-term contracts that integrate political risk insurance, trade-credit cover, and clear step-in or assignment rights for lenders typically indicate that counterparties have invested in making the flow resilient to shocks. Short-term, un-insured or lightly documented arrangements, even when economically attractive, tend to prove fragile under stress, especially where counterparties are thinly capitalized or exposed to volatile jurisdictions.

    Conclusion: Financial Structures as Core Operational Infrastructure

    Viewed through an operational continuity lens, insurance, trade-credit, and financing terms in high-risk materials flows function much like physical infrastructure. They can either provide redundant pathways, buffers, and fail-safes, or they can represent single points of failure that magnify minor disruptions into full-blown supply crises. Site visits, contract reviews, and discussions with brokers and lenders across rare earth, cobalt, nickel, tungsten, and PGM chains consistently underline that the resilience of a given mine, smelter, or trading corridor cannot be understood without mapping its financial risk-transfer architecture.

    For analysts evaluating strategic metals supply chains, the key task is less about predicting specific price paths and more about understanding how insurance and financing structures will respond to foreseeable shocks. Whether the trigger is a new export restriction, a sanctions package, a power crisis, or an ESG controversy, continuity increasingly depends on whether risk has been shared with credible third parties in ways that banks, regulators, and counterparties accept. Facilities and flows that have built such structures into their operating model tend to display a different shock profile than those that rely solely on bilateral trust and balance sheet strength.

    In that sense, insurance and trade-credit arrangements have become part of the strategic core of high-risk materials operations. They influence which projects proceed, which routes dominate, which counterparties remain viable under stress, and ultimately how resilient the broader energy transition and advanced manufacturing ecosystems can be when exposed to inevitable supply-side shocks.