Minerals Financing Pivot: State-Backed Capital, Price Floors and the New Critical Minerals Playbook
Résumé Exécutif
Critical minerals finance is undergoing a structural pivot: from dispersed, market-led project lending to a tightly orchestrated regime of state-backed capital, price floors, and strategic offtakes. In the span of roughly a year, the United States, European Union and multilateral lenders have rolled out a suite of tools-10‑figure credit lines (EXIM’s $10 billion Project Vault), blended-finance consortia (the $1.8 billion Orion Critical Mineral Consortium) and hard price guarantees (the U.S. Department of Defense’s $110/kg NdPr floor for MP Materials)-that effectively move critical minerals from a commodity space into an instrument of industrial policy.
For procurement directors, traders and supply chain strategists, the immediate consequences are threefold: first, price discovery for several strategic materials is being partially socialised through state-backed floors and strategic stockpiles; second, access to long-tenor, concessional finance is increasingly conditioned on ESG, local value-add and geopolitical alignment; and third, the demand signal itself is being reshaped by AI-driven power buildouts and evolving battery chemistries. The key watch-points now are the implementation of the new FORGE framework on coordinated price references, the sustainability of U.S. price-floor arrangements in the face of cheaper Chinese supply, and how fast EU and multilateral facilities can move projects from feasibility to bankable status.
Couverture & Attention
The minerals financing pivot is not yet framed as such in mainstream media, but it is increasingly visible across three clusters of coverage: official government and development finance announcements, specialised policy and energy-transition analysis, and a set of adjacent technology stories that reveal how capital is being reallocated to strategic infrastructure.
On the official side, U.S. government channels and development finance institutions have become primary narrators. The U.S. State Department’s communiqué on the February 2026 critical minerals ministerial in Washington, D.C. introduces FORGE (Forum on Resource Geostrategic Engagement) as the successor to the Mineral Security Partnership, signalling a shift toward coordinated “reference prices” and preferential trade for critical minerals. The U.S. Export-Import Bank (EXIM) and U.S. International Development Finance Corporation (DFC) have issued a stream of press releases detailing large-ticket deals such as Project Vault and financing for Serra Verde’s rare earth expansion in Brazil. The European Investment Bank (EIB) similarly uses its Global Gateway communications to highlight early-stage technical assistance for graphite and lithium projects in Africa.
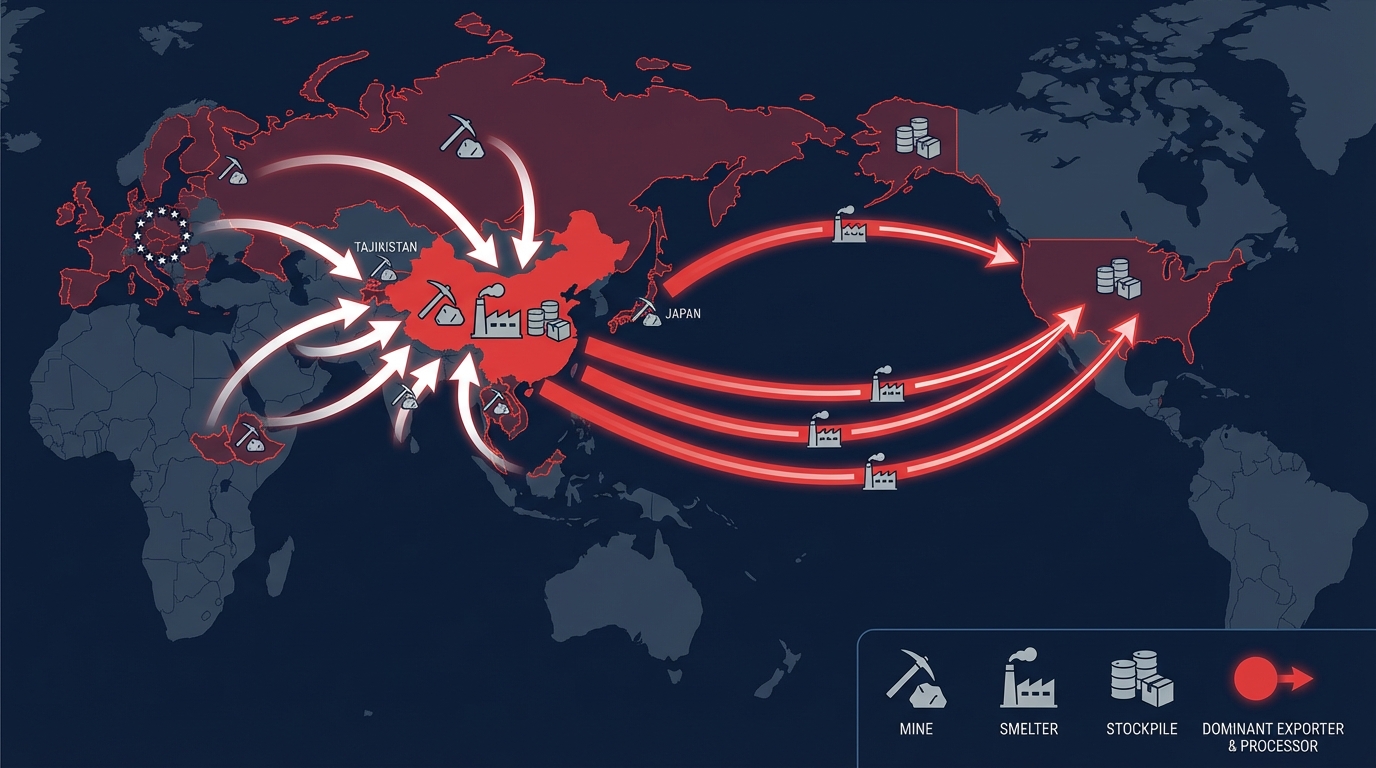
Specialised think-tank and industry analysis-such as work by the Center for Strategic and International Studies (CSIS), S&P Global and sector-focused consultancies—adds a more critical lens. CSIS underlines the depth of U.S. import dependence across dozens of critical minerals and tracks China’s overwhelming role in processing (around 61% of mined rare earth supply and 91% of processing capacity, and roughly 70% average refining share for 19 of 20 key strategic minerals), framing the new U.S. executive order on processed critical minerals as an attempt to close a structural vulnerability. Market analytics from platforms like S&P Global and Project Blue emphasise persistent premiums for non-Chinese rare earth material and the bottlenecks in bringing alternative supply online.
Adjacent technology and energy outlets offer a complementary vantage point. A Numerama report describes how the boom in artificial intelligence is pushing U.S. tech majors to build their own off‑grid gas power plants to secure data centre electricity, raising questions about energy security and climate trade-offs. A MIT Technology Review roundtable positions 2026 as an inflection year for sodium‑ion batteries, citing lower cost and safer chemistries and touching on the implications for lithium supply chains. TechCrunch coverage of the White House push for AI firms to shoulder any electricity rate hikes documents how Microsoft, OpenAI, Anthropic and Google are committing to on‑site generation and battery investments. While these pieces do not discuss mineral finance per se, they expose the same dynamic: governments and regulators are nudging private capital to internalise the cost of strategic inputs (power, storage, critical materials) rather than relying solely on public balance sheets.
Coverage in general business and consumer media remains thin and episodic. When it appears, it often focuses on headline numbers (“$10 billion for Project Vault”, “up to $1.6 billion for USA Rare Earth”) or on political theatre around tariffs and trade, without unpacking the longer-term shift in how critical minerals are being priced, financed and governed.
Sentiment & Divergence (presse spécialisée vs. données officielles)
Official communications by the U.S. administration, DFC, EXIM and EIB are uniformly upbeat, framing the new financing architecture as “unprecedented leadership” and a necessary response to China’s dominance. DFC’s CEO describes securing critical minerals as “a paramount matter of U.S. strategic interest and economic prosperity” and casts the Orion Critical Mineral Consortium as a vehicle to “establish a robust pipeline of secure critical mineral investments.” The EIB’s leadership, for its part, stresses mutual benefits for Africa and Europe, situating early-stage project support within the EU’s Global Gateway strategy.
By contrast, specialised analysis and some trade press adopt a more cautious tone. Commentators drawing on the MP Materials-DoD deal note that the 10‑year price floor of $110/kg for NdPr oxide currently more than doubles prevailing Chinese market prices (below $60/kg, according to MP Materials and contemporaneous market data). This raises the prospect of long-term subsidy dependence and questions about how politically durable such arrangements will be if Chinese prices remain structurally lower. Policy analysis from organisations like CSIS and Columbia University underscores that government-set floors in thinly traded markets are largely untested and could distort investment signals if not carefully calibrated.
There is also a divergence in how risk is framed. Official U.S. and EU messaging tends to present these financing tools as straightforward resilience-building measures. Analysts and some NGOs, however, highlight distributional and geopolitical risks: the potential for new forms of resource dependence (just with different lead states), the risk that price coordination under FORGE could be perceived as cartel-like behaviour by excluded producers, and the possibility that generous Western financing accelerates resource extraction in governance‑challenged jurisdictions without commensurate gains in local value-add.
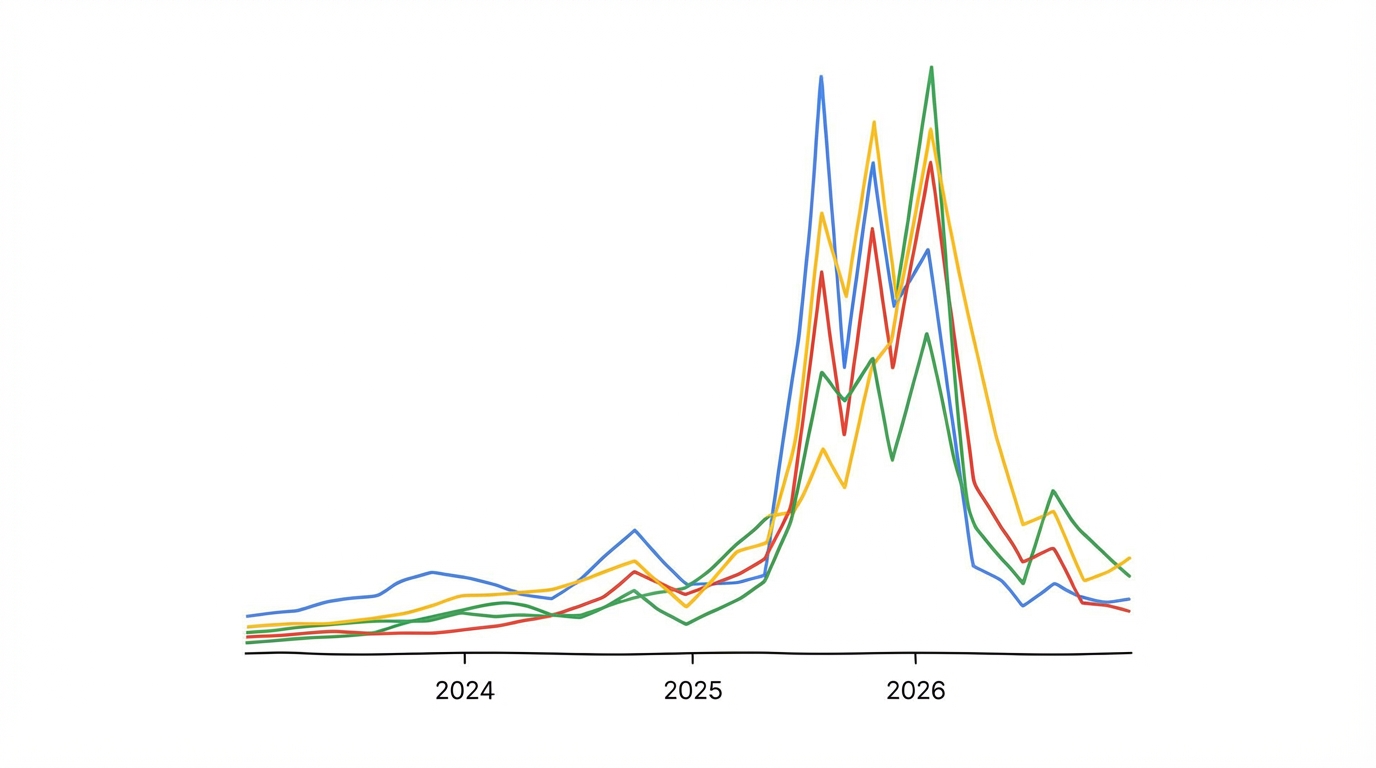
Sentiment around China is another key fault line. U.S. and European official sources cite China’s export restrictions and technology controls as justification for reshoring and friend‑shoring. External research notes that Chinese export controls introduced in April 2025 on seven heavy rare earths—later expanded in November 2025 to five more elements—have coincided with sharp price spikes: dysprosium up 168%, terbium 195% and yttrium 598% compared with April 2025 levels, according to synthesis by CSIS, China-Briefing and S&P Global. Yet some analysts warn that assuming continued Chinese escalation could lead to overbuild, stranded Western assets and a backlash from producers in the Global South who seek balanced engagement with both blocs.
Signaux Thématiques / Glissements Narratifs
Several deep narrative shifts are visible across the current wave of announcements and analysis. Together, they define what Materials Dispatch refers to as the “minerals financing pivot.”
1. De la sécurité d’approvisionnement à la formation administrée des prix
Early critical minerals policy focused on securing tonnes in the ground and long-term offtakes. The new wave of instruments explicitly targets price formation itself. The FORGE ministerial in February 2026 signalled an ambition to “establish reference prices for critical minerals at each stage of production, pricing that reflects real-world, fair-market value,” according to the U.S. Vice President’s framing reported by policy briefings. The MP Materials-DoD agreement goes further, contractually locking in a 10‑year NdPr oxide floor at $110/kg and an offtake commitment covering 100% of output from a future NdFeB magnet facility in Texas. These arrangements effectively underwrite cash flows and alter global benchmark expectations, especially for non‑Chinese supply.
2. Du financement de projets isolés aux portefeuilles et réserves stratégiques
Instead of backing individual mines on a case-by-case basis, governments and development financiers are building portfolios and stockpiles. EXIM’s Project Vault authorises a $10 billion direct loan to finance a strategic reserve of minerals such as cobalt and lithium, complemented by an estimated $2 billion in private capital from traders and industrial users (including Mercuria, Hartree, Traxys and suppliers to Clarios), according to EXIM’s February 2026 release. DFC’s $600 million investment into the $1.8 billion Orion Critical Mineral Consortium is deliberately structured to seed a pipeline of near‑term projects across eligible jurisdictions rather than a single flagship asset. This portfolio approach diversifies technical and political risk and creates leverage for standardising ESG and offtake terms across multiple projects.
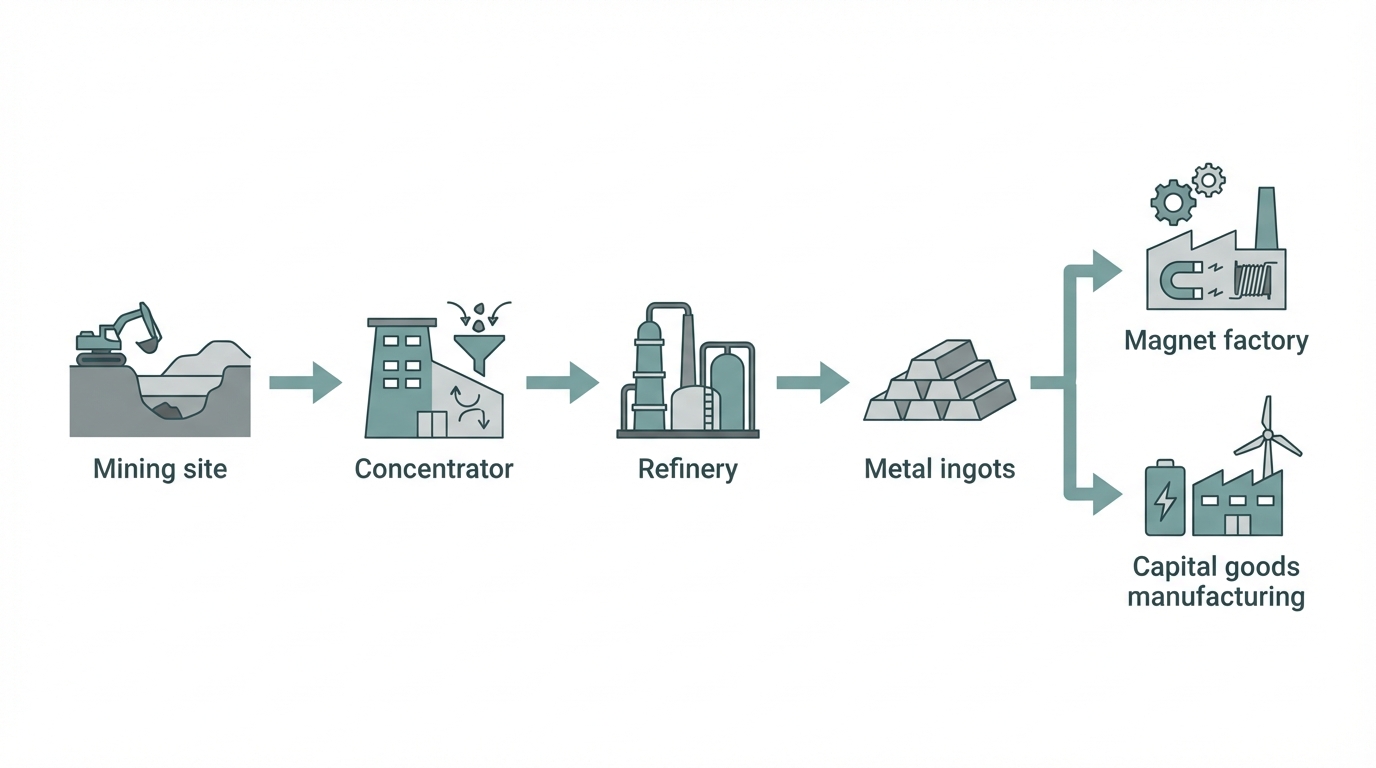
3. De la mine à la chaîne de valeur complète “mine‑to‑magnet”
The Trump administration’s January 2026 executive order on processed critical minerals emphasises that “mining a mineral domestically does not safeguard the national security of the United States if the United States remains dependent on a foreign country for the processing of that mineral.” Reflecting this logic, recent deals increasingly span from extraction to refining and component manufacturing. USA Rare Earth’s announced letter of intent with the U.S. government would unlock about $1.6 billion in CHIPS Program-related funding (including $277 million in federal support and a $1.3 billion senior secured loan), plus a separate $1.5 billion private investment in public equity (PIPE), aimed at building a vertically integrated heavy rare earth value chain. MP Materials’ planned $1.25 billion magnet facility in Texas (supplemented by $200 million in state incentives) is designed to close the loop from mined concentrate in the U.S. to finished NdFeB magnets for EVs and defense systems.
4. Du financement pur au “capital conditionnel” lié à l’ESG et à la souveraineté
EU and multilateral initiatives are making access to capital contingent on both sustainability performance and strategic alignment. The EU’s Critical Raw Materials Act sets 2030 benchmarks of sourcing at least 10% of annual consumption from domestic extraction, 40% from EU-based processing and 25% from recycling, while limiting dependence on any single third country to 65% of imports. The EIB’s technical assistance grants of €2 million each to EcoGraf (graphite in Tanzania) and Andrada Mining (lithium in Namibia) are explicitly framed as tools to make projects “investment-ready” under Global Gateway, embedding expectations around water use, land disturbance and biodiversity (aligned with GRI 14: Mining Sector, effective January 2026). In parallel, mandatory climate and sustainability reporting under ISSB standards and the EU’s CSRD is raising the cost of financing opaque or high-impact projects, indirectly steering capital toward assets that can demonstrate robust ESG performance and transparent governance.
5. De la croissance “EV‑centric” à une demande tirée par l’IA et les nouvelles chimies batteries
Coverage around the mineral-finance nexus is increasingly shaped by two cross‑cutting demand shifts. First, AI and data centre expansion are becoming major incremental drivers of electricity, and by extension of copper, aluminium and grid‑scale storage demand. Numerama and TechCrunch document how U.S. tech giants are building dedicated power plants and committing to absorb distribution tariff hikes, often backed by new battery assets—dynamic that ties directly into Project Vault’s focus on cobalt and lithium and DFC’s support for storage-relevant minerals. Second, the MIT Technology Review roundtable on sodium‑ion batteries highlights how alternative chemistries could ease the tightest constraints on lithium and cobalt, but at the cost of introducing new sensitivities around sodium, manganese and other inputs. Market data compiled by Trading Economics show lithium carbonate at around CNY 161,750 per tonne in February 2026 (roughly 113.5% higher year‑on‑year) amid high daily volatility of about 6.4%, reinforcing the case for diversified chemistries and multi‑metal portfolios in creditors’ strategies.
Contexte Externe (complémentaire)
This section synthesises key external developments shaping the minerals financing pivot, based on official releases and third‑party research explicitly cited below.
Architecture U.S. : EXIM, DFC, DoD et l’exécutif
Executive Order & FORGE. On 15 January 2026, the U.S. administration signed the executive order “Adjusting Imports of Processed Critical Minerals and Their Derivative Products into the United States,” directing the Commerce Secretary and USTR to pursue bilateral agreements and consider price floors on processed critical minerals (White House, 2026). In February 2026, a critical minerals ministerial in Washington brought together representatives from 54 countries plus the EU and launched the Forum on Resource Geostrategic Engagement (FORGE) as successor to the Mineral Security Partnership (U.S. State Department, 2026). FORGE discussions explicitly covered coordinated floor-pricing concepts and a preferential trade zone for allied mineral supply.
Project Vault (EXIM). In early February 2026, EXIM approved a $10 billion direct loan facility under “Project Vault” to finance a strategic stockpile of critical minerals, including cobalt and lithium, to be stored and managed in partnership with private sector firms such as Clarios, GE Vernova, Western Digital and Boeing. The total capitalisation is expected to reach around $12 billion when approximately $2 billion in private co‑financing from commodity traders and industrials is included (EXIM, 2026). The structure leverages EXIM’s long-tenor export credit capabilities to secure multi‑year supply for U.S. industrials while providing offtake visibility to mines and processors in partner countries.
DFC and Orion CMC. The U.S. International Development Finance Corporation has emerged as a central actor. In January 2026, it closed a $600 million commitment into the Orion Critical Mineral Consortium, a $1.8 billion fund backed by Orion and Abu Dhabi’s ADQ, with a target of up to $5 billion to finance near‑term critical mineral projects in DFC-eligible jurisdictions (DFC, 2026). DFC states that it has now deployed more than $4.5 billion across six critical minerals deals over the past year, including support for Serra Verde’s rare earths expansion in Brazil (a $565 million package with an option for a minority U.S. government equity stake) and a tungsten project in Kazakhstan where EXIM has issued a $900 million letter of intent and DFC a $700 million LOI for Northern Katpar and Upper Kairakty deposits (Cove Kaz/DFC, 2026).
Defense Production & MP Materials. Within the U.S. defense establishment, Title III of the Defense Production Act (DPA) has been mobilised to fund a spectrum of strategic minerals, from gallium and scandium to tungsten. An infographic published by the U.S. Department of Defense notes $550.4 million in FY 2025 awards for “Strategic & Critical Materials” alongside $364 million for “Kinetic Capabilities.” The July 2025 MP Materials-DoD deal is emblematic: it combines a $150 million loan and $400 million in preferred equity, a decade-long NdPr price floor at $110/kg, and a 100% offtake commitment for magnets from the planned U.S. facility (MP Materials, 2025).
Commercial & geopolitical partnerships. U.S.-backed deals increasingly pair commercial actors in resource-rich countries with U.S. capital and offtake. In December 2025, Gécamines (DRC) and Mercuria announced a copper/cobalt joint venture with DFC support, including sale of roughly 100,000 tonnes of copper to U.S. customers in 2026 and a further 50,000 tonnes planned for Saudi and Emirati buyers (Mercuria/DFC, 2025). For tungsten, Cove Kaz and Kazakhstan’s Tau‑Ken Samruk have executed definitive agreements for deposits holding an estimated 1.4 million tonnes of WO3, with planned output of 12,000 tonnes per year—around 15% of projected global supply (Cove Kaz, 2026).
Stratégie européenne : CRM Act, EIB Global Gateway
On the European side, the Critical Raw Materials Act (CRMA) formalises 2030 benchmarks of 10% of annual EU consumption from domestic extraction, 40% from EU-based processing and 25% from recycling, while capping dependence on any single third country to 65% of imports (European Commission, 2023). The regulation also hard‑wires ESG considerations—including water usage, land disturbance and biodiversity—into materiality assessments for mining and processing, aligning with the GRI 14 mining sector standard effective January 2026.
To operationalise these targets, EIB Global is deploying Global Gateway as a vehicle for strategic minerals. In February 2026, it signed cooperation agreements with EcoGraf (graphite, Tanzania) and Andrada Mining (lithium, Namibia), each receiving €2 million in technical assistance to move projects from feasibility to bankability (EIB, 2026). The EU’s Commissioner for International Partnerships framed these as part of a broader push to build “secure and sustainable supply chains by investing early in projects that create value locally,” underscoring the conditional nature of support on both sustainability and local beneficiation.
Multilatéraux, Afrique et la nouvelle course aux capitaux
The World Bank signalled a five‑fold increase in minerals and metals financing over the next five years, announced at the 2026 Mining Indaba, with an explicit focus on domestic value addition and beneficiation in African producer states. Analyses by Power Shift Africa note that this is positioned as a tool to help close Africa’s estimated $170 billion annual infrastructure and energy gap, but warn that conditionalities and governance standards will determine whether such capital translates into resilient local economies or reinforces extractive dependencies.
Contexte chinois : contrôles d’exportation et technologie
China’s evolving export controls and technology restrictions are the primary backdrop for Western financing moves. Research aggregated by CSIS, the International Energy Agency and others underscores that China controls the majority of global rare earth mining and an even higher share of processing capacity. Export controls rolled out from April 2025 onwards have tightened access to heavy rare earths and associated technology, contributing to sharp price spikes for selected elements. In parallel, China’s December 2023 restrictions on the export of rare earth extraction and separation technologies have limited Western firms’ ability to rapidly replicate Chinese processing capabilities, even where capital is available.
Marchés : lithium, cobalt et structure des prix
Lithium markets remain volatile. Trading Economics data suggest lithium carbonate prices around CNY 161,750 per tonne in February 2026, more than doubling year‑on‑year, with intraday swings averaging 6.41%. While a supply glut from projects sanctioned before 2025 has temporarily eased tightness, multiple analyses anticipate an inflection from the second half of 2026 as demand continues to grow around 12% annually through 2030, aided by factors such as Chinese VAT rebate changes and restrictions on concentrate exports from Zimbabwe.
Cobalt spot prices on the London Metal Exchange stand at roughly $56,267 per tonne as of late February 2026 (LME, 2026), but large long-term offtake deals—such as those linked to Project Vault and DRC‑anchored JVs—are increasingly priced off bilateral formulas rather than transparent benchmarks. For rare earths, S&P Global and Project Blue report persistent premiums for non‑Chinese supply where performance, qualification and continuity are critical, particularly in NdPr‑based magnets and heavy rare earths, a trend likely to be reinforced by Western price floors and stockpiling.
Risques / Implications / Watchlist
Pour les directeurs achats & desks matières premières
1. Dual price structures and opaque reference levels. With instruments like the MP Materials NdPr floor and prospective FORGE reference prices, buyers should prepare for a bifurcated pricing environment: one set of prices for state-backed, ESG‑compliant, “trusted” supply and another for broader market material, especially from China. This will complicate benchmarking and hedging. Procurement teams will need to adjust contract frameworks to accommodate floor‑and‑collar structures, conditional rebates and strategic stockpile draw‑down clauses.
2. Competition for subsidised offtake. Government-backed deals often come with priority offtake rights for domestic or allied industries, as seen in MP Materials’ 10‑year magnet offtake to the U.S. defense ecosystem and Gécamines/Mercuria’s committed shipments to U.S. customers. Non‑favoured buyers risk being squeezed to residual volumes or shorter‑term contracts, especially in tungsten, rare earths and cobalt. Early, long‑dated commitments and participation in strategic stockpile tender processes will become differentiators.
3. Volatility around policy shifts and legal challenges. The February 2026 U.S. Supreme Court decision striking down certain IEEPA‑based tariffs illustrates the fragility of some trade instruments. While the administration pivots to other authorities (such as Section 122 with capped and time‑limited tariffs and potential Section 301 investigations), procurement strategies built on assumed tariff differentials may need rapid revision. Contracts should incorporate policy‑change clauses and flexible sourcing options.
Pour les stratèges supply chain & opérations industrielles
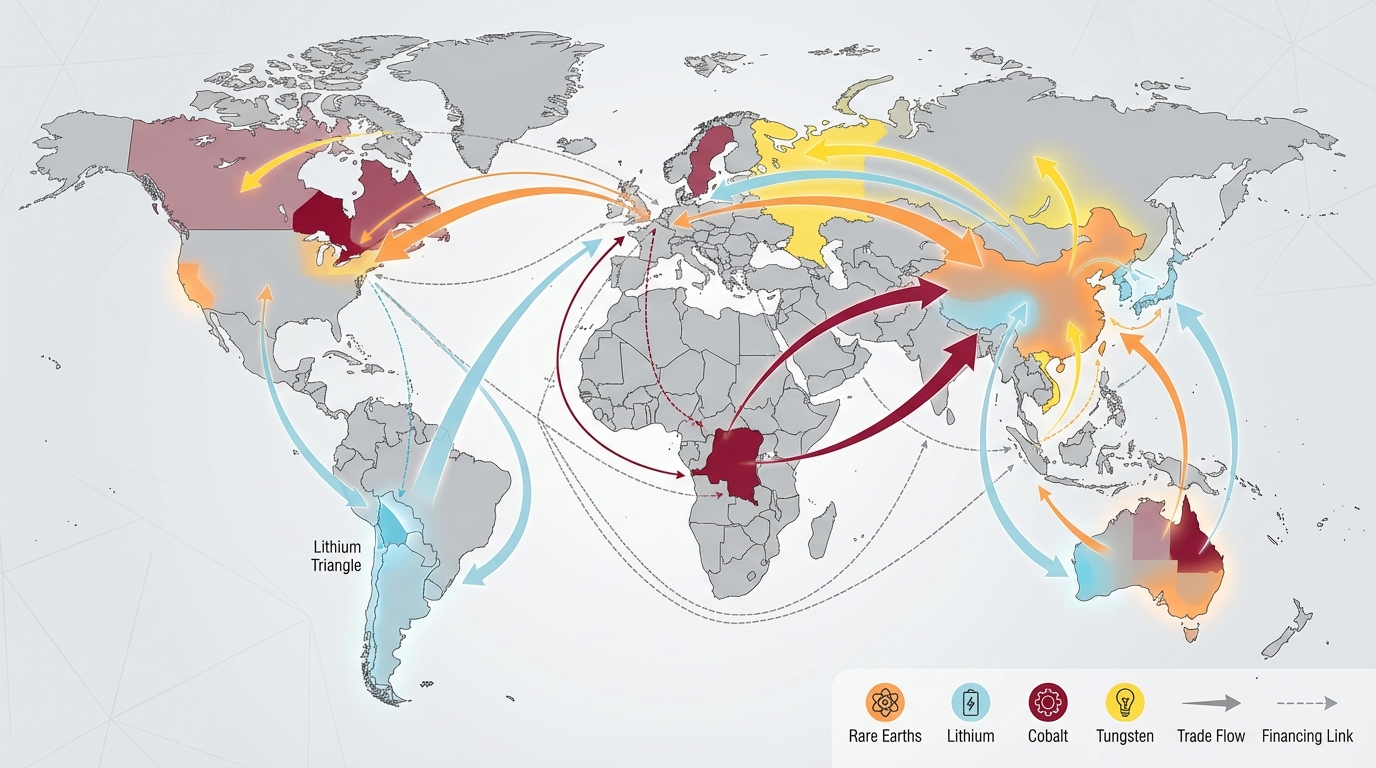
1. Re‑routing of value chains. The financing map points to new corridors: Kazakhstan for tungsten, Brazil for rare earths, Tanzania and Namibia for graphite and lithium, and DRC for copper/cobalt under U.S.- and EU‑backed structures. Supply chain teams should map exposure not just to countries but to financing regimes—state-backed versus market-only—and stress‑test logistics, permitting and political‑risk assumptions under each.
2. Integration of energy and minerals planning. The convergence of AI‑driven power demand, grid storage buildout and critical minerals finance suggests that plant‑level planning for energy and materials can no longer be separated. The trend of tech companies building captive power generation and storage, as reported by Numerama and TechCrunch, foreshadows similar moves by downstream industrial users to co‑invest in upstream mineral projects or strategic reserves. Cross‑functional teams will need to align power procurement, metals sourcing and capital allocation decisions.
3. Technology path dependency. Commitments to specific battery chemistries or magnet technologies must now factor not only performance and cost but also eligibility for subsidised finance and offtake guarantees. For example, heavy reliance on lithium‑ion chemistries may benefit from Project Vault and related facilities, but emerging sodium‑ion options could offer supply security advantages where access to lithium is constrained. Diversifying technology bets and qualifying multiple suppliers across chemistries will help mitigate lock‑in risk.
Pour les responsables conformité, ESG & reporting
1. ESG as a gatekeeper for capital. With ISSB standards, CSRD, GRI 14 and growing enforcement against greenwashing, access to EIB, DFC, World Bank or EXIM financing increasingly depends on robust, auditable ESG performance. Compliance officers should anticipate lender‑driven demands for enhanced traceability, nature‑related risk assessment (aligned with TNFD, which already counts more than 730 adopters representing $22 trillion in assets) and third‑party assurance on climate and biodiversity claims.
2. New disclosure exposures. Participation in strategic stockpile schemes or price‑floor arrangements may trigger additional disclosure obligations, including around state‑aid, related‑party transactions and long‑term government guarantees. Reporting teams must coordinate closely with legal and treasury functions to ensure accurate portrayal of contingent liabilities and support mechanisms in financial statements and sustainability reports.
3. Community and governance risks in producer states. As capital accelerates into projects in the DRC, Tanzania, Namibia, Kazakhstan and others, scrutiny of community consent, labour conditions and environmental impact will intensify. Barclays estimates that nature-related risks could reduce mining earnings by up to 25% over five years; failure to manage these risks may also jeopardise eligibility for concessional finance. Strong local stakeholder engagement and alignment with emerging best practice (e.g., ICMM standards, IFC Performance Standards) will be essential.
Pour les analystes géopolitiques & décideurs publics
1. Emergence of a “minerals Bretton Woods”? FORGE’s ambition to coordinate reference prices and preferential trade conditions, combined with U.S., EU and multilateral financing, points toward a quasi‑institutional order for critical minerals. Analysts should watch for whether this coalesces into binding rules or remains a loose coalition, and how excluded actors—particularly China and some emerging producers—respond, including via counter‑financing or alternative trade blocs.
2. Deep‑sea and frontier mining as policy swing factors. Research from the Stimson Center suggests that moves toward coordinated price floors and guaranteed offtakes may increase the attractiveness of deep‑sea mining and other frontier sources of cobalt, nickel and rare earths. The current U.S. administration’s openness to lowering entry barriers for seabed mineral development introduces an additional vector of geopolitical and environmental contention. Policy choices in this space will materially affect long‑term supply, ESG debates and the credibility of Western sustainability claims.
3. Durability of allied financing commitments. Bilateral reciprocal tariff deals and investment pledges—such as reported commitments from South Korea and the EU to channel hundreds of billions into U.S.-aligned industrial projects—may be vulnerable in the absence of stable U.S. tariff authority and amid domestic political shifts. A change in administration in any major partner, or judicial constraints on executive trade tools, could weaken the underpinnings of current financing frameworks. Scenario analysis should consider partial unwinding of these commitments and its impact on project bankability.
Notes Méthodologiques & Niveaux de Confiance
This brief synthesises coverage from specialised technology, energy and policy outlets together with official communications from U.S. and EU institutions, development finance bodies and multilateral organisations. It is complemented by research from think tanks and market data providers on prices, trade flows and regulatory developments. The aim is to distil directional signals rather than provide a comprehensive database of projects.
Niveaux de confiance sur les constats centraux
- Élevé – There is a structural increase in state-backed financing and risk‑sharing mechanisms for critical minerals, including price floors, strategic stockpiles and long‑tenor export credit. Justification: Corroborated by multiple official announcements (EXIM Project Vault, DFC–Orion, MP Materials–DoD, EIB Global Gateway) and consistent policy framing in the U.S. executive order and EU CRM Act.
- Élevé – China’s dominance in processing and recent export/technology controls are key drivers of Western financing initiatives. Justification: Quantified import dependence and Chinese market share reported by CSIS, IEA and EU documents, with explicit linkage in U.S. and EU policy statements.
- Modéré – Coordinated reference prices under FORGE will materially reshape global benchmarks for certain minerals. Justification: Political intent is clearly stated in the critical minerals ministerial framing, but operational details and enforcement mechanisms remain undefined.
- Modéré – Price floors such as the $110/kg NdPr guarantee for MP Materials will prove difficult to sustain politically if Chinese prices remain structurally lower. Justification: Clear price differential versus current Chinese levels; long‑term political tolerance for above‑market support is uncertain and depends on future security dynamics.
- Modéré – The minerals financing pivot will accelerate investment into projects in Africa and Central Asia, but local value‑add and governance outcomes will be uneven. Justification: Financing deals are real and sizeable (e.g., DFC, EIB, World Bank commitments), whereas governance quality and enforcement capacity vary widely and monitoring remains limited.
- Faible à modéré – Emerging demand drivers from AI/data centres and sodium‑ion batteries will significantly alter the composition of critical mineral demand by 2030. Justification: Early but compelling signals in technology press and expert roundtables; however, adoption curves and regulatory frameworks are still in flux.
Readers should so treat the minerals financing pivot as a firmly established policy direction, but one whose precise market impacts will depend on implementation details, political durability and the interplay with technology shifts and Chinese policy responses.