Yttrium 2025: The Overlooked Element Heading for a Supply Crisis
Executive context: Yttrium has long sat in the shadow of neodymium, dysprosium, and terbium in rare earth discussions. That era is over. The combination of China’s April 2025 export controls and structurally thin non‑Chinese capacity has turned yttrium from a specialty oxide into a single‑point failure for jet engine coatings, industrial gas turbines, and advanced semiconductor equipment. The critical question is no longer “Is yttrium strategic?” but “Where are the real failure modes in the yttrium oxide supply chain, and how fast can industry re‑route around them?”
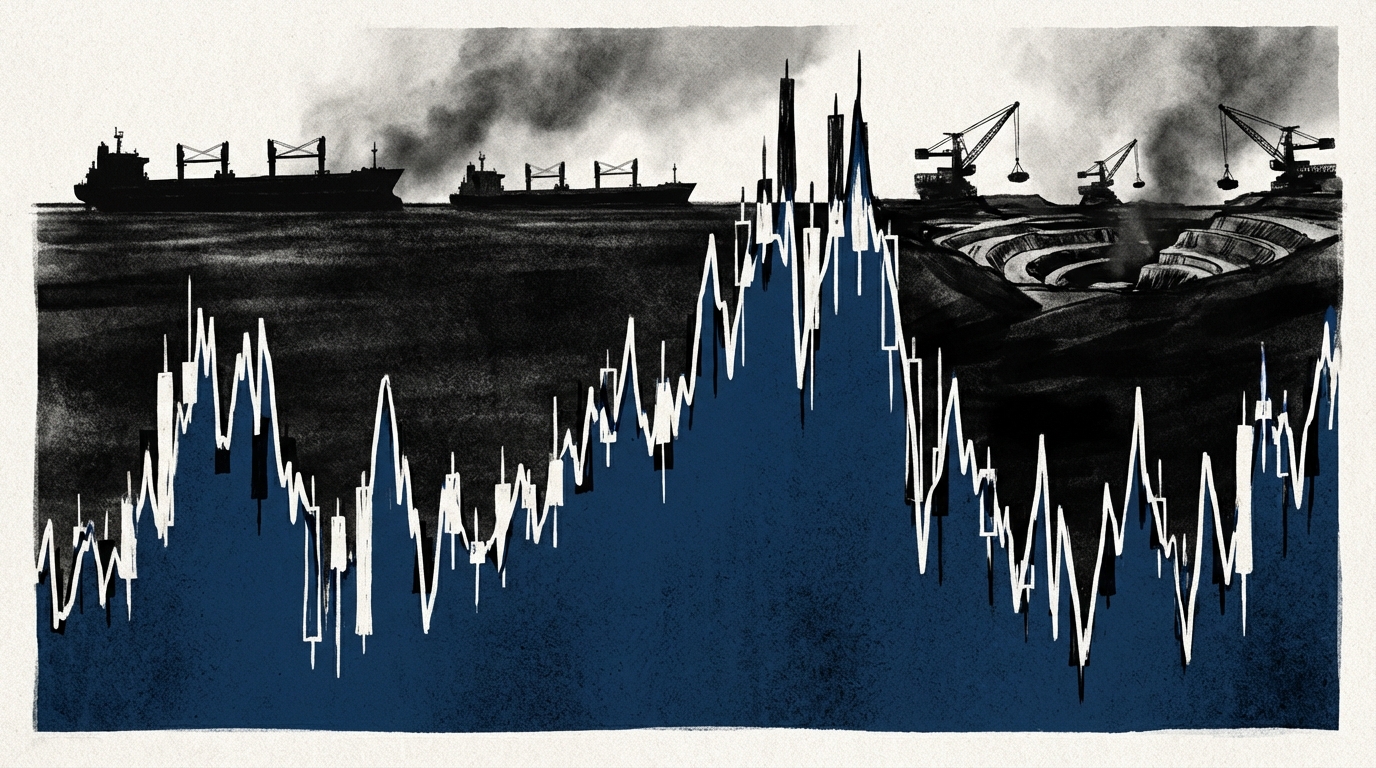
Market data from 2025-2026 show the shift with unusual clarity. Reported European yttrium oxide prices have surged by several thousand percent since early 2025, while Chinese domestic prices remain at a tiny fraction of those levels, creating a dual‑price system separated by export controls rather than production cost. Chinese customs statistics cited in industry analysis indicate that US imports of yttrium products fell from 333 tonnes in the eight months before the April 2025 measures to only 17 tonnes in the eight months after-a collapse of about 95%. That is not a marginal adjustment; it is a structural cutoff.
Materials Dispatch’s assessment is straightforward: the current yttrium squeeze is fundamentally a process and infrastructure problem, amplified by geopolitics. Ore exists outside China, but separation circuits, oxide refining capacity, and qualified downstream powders for aerospace and semiconductors remain overwhelmingly Chinese. This article tracks how that concentration interacts with dual‑use controls, what it means for industrial operations, and where the real constraints lie over the 2025-2028 horizon.
1. Why Yttrium Matters: From Peripheral Rare Earth to Critical Material
Yttrium is commonly grouped among the heavy rare earth elements (HREEs), although chemically it behaves as a lighter element in some systems. Its criticality comes not from bulk volume but from its role in enabling high‑temperature, high‑reliability performance. It is a textbook example of a “small tonnage, huge consequence” material.
Key yttrium applications with limited substitution flexibility include:
- Thermal barrier coatings (TBCs) for aerospace and industrial gas turbines, typically in the form of yttria‑stabilized zirconia (YSZ) and related compositions.
- Plasma‑facing coatings and chamber components in semiconductor manufacturing equipment, where yttria provides erosion resistance and low contaminant generation.
- High‑performance ceramics and refractories, including yttrium aluminum garnet (YAG) and other yttrium‑bearing phases.
- Laser crystals and phosphors, including YAG-based lasers and Y-Eu phosphors for lighting and displays, where performance and color rendering specifications tie directly to yttrium content.
In each of these, yttrium performs a structural or stabilizing role; it is not a pigment or cosmetic additive. Removing it often means redesigning the entire system-engine hot section alloys and coating stacks, semiconductor chamber materials, or optical architectures—then requalifying under aerospace or semiconductor standards that are inherently slow and conservative.
This is why the current episode is more than a price spike. Yttrium has effectively become an enabling infrastructure material: small in volume, but deeply embedded in the physical stack of critical industrial systems.
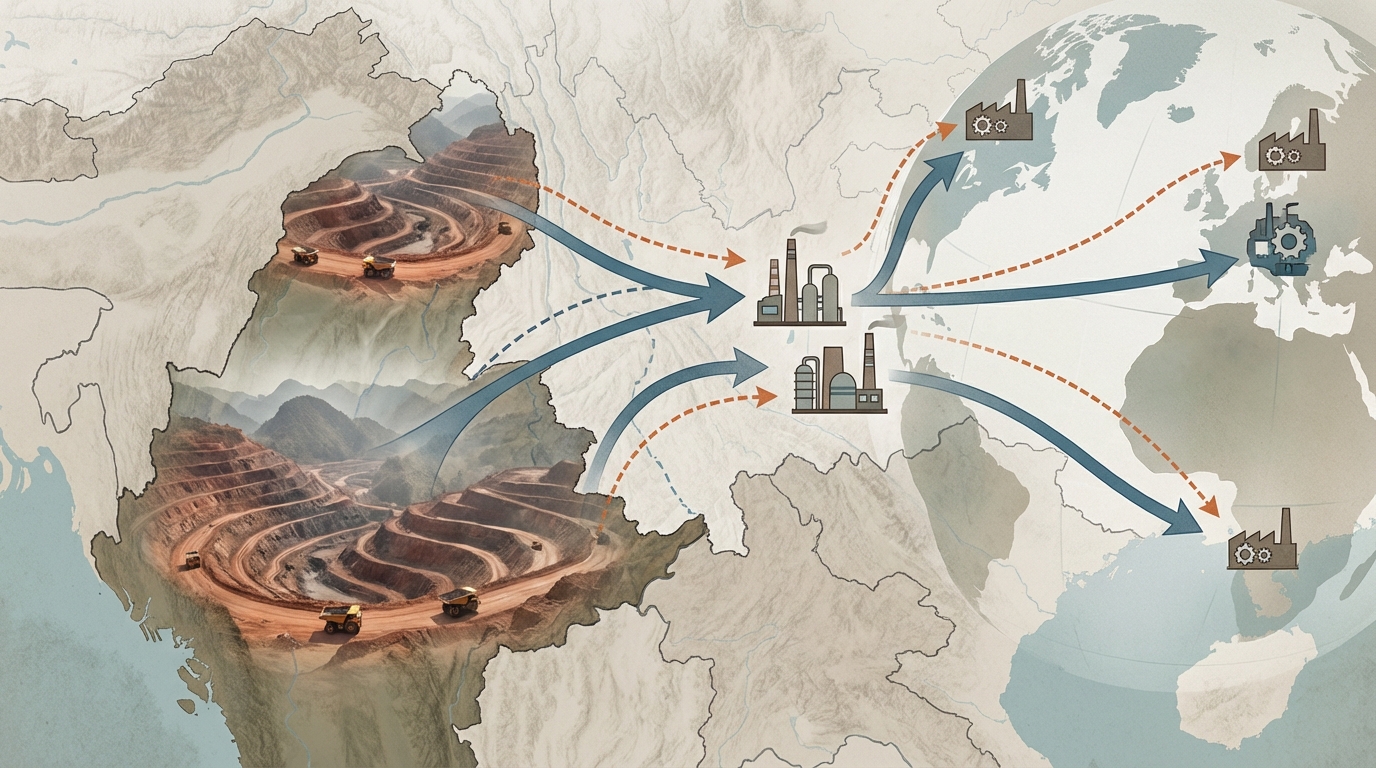
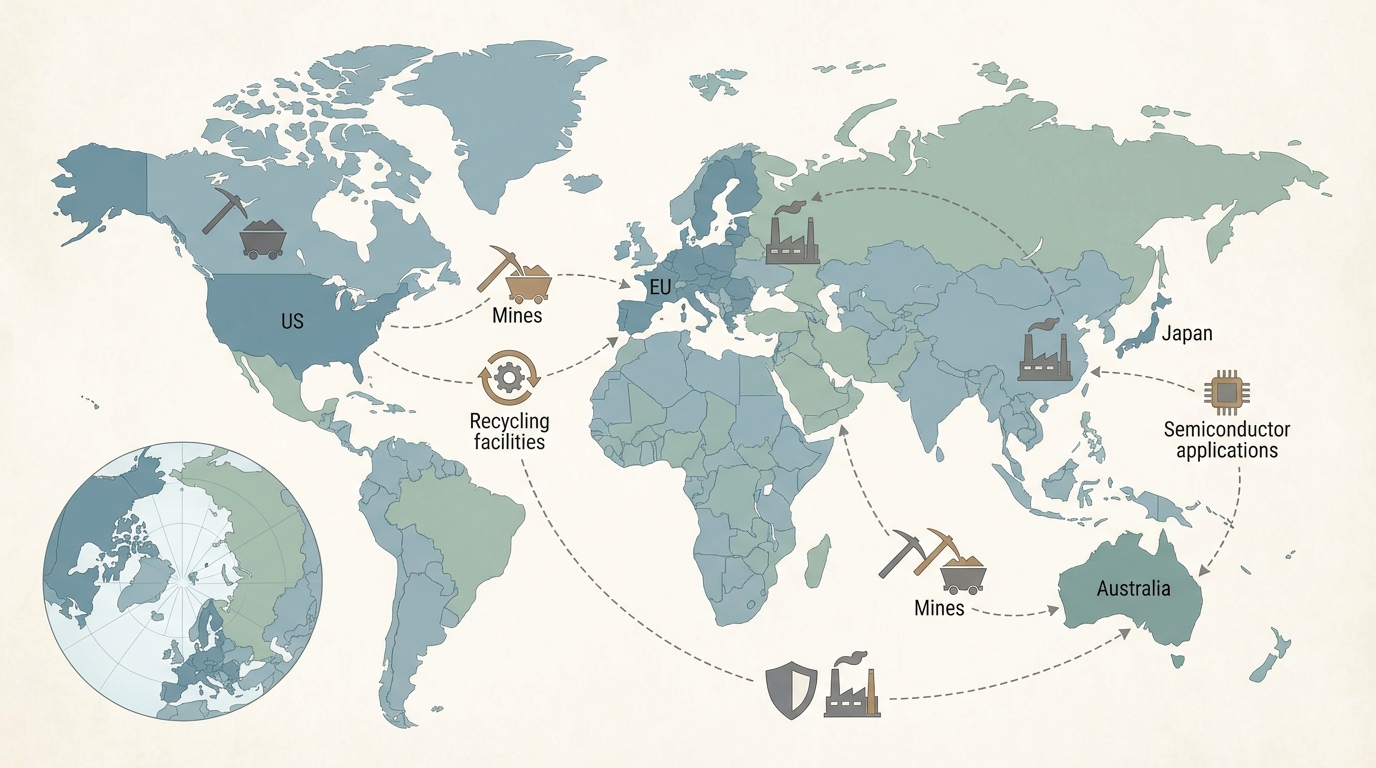
2. Upstream Reality: Where Yttrium Comes From and Why It Is Hard to Scale
Yttrium rarely appears as a stand‑alone ore. It is typically recovered as a by‑product from rare earth mineral systems, particularly ion‑adsorption clays and xenotime/monazite concentrates. This co‑production nature is a core structural constraint: yttrium output is tied to broader rare earth mining decisions and cannot easily be ramped independently.
2.1 Feedstock Sources: Ion‑Adsorption Clays, Xenotime, and Monazite
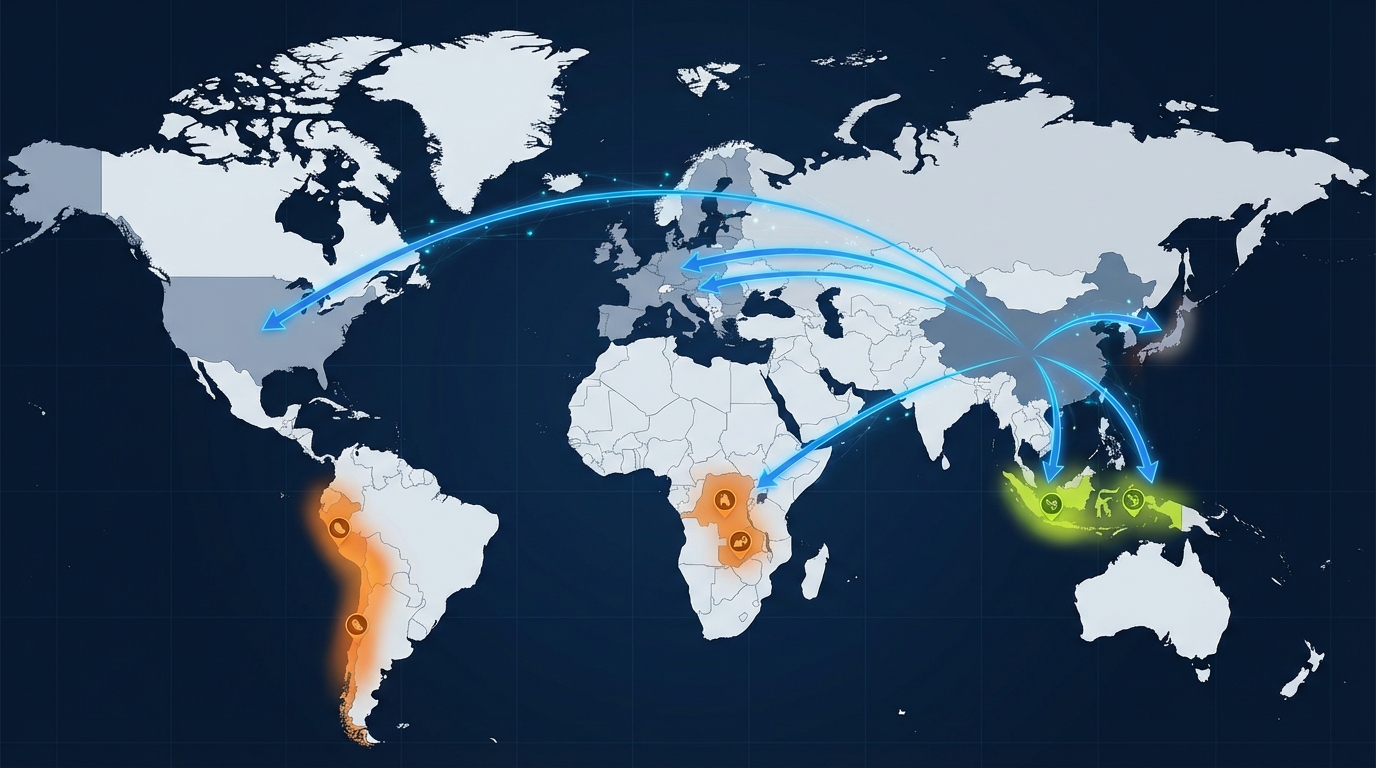
The largest historical source of yttrium has been the ion‑adsorption clay deposits of southern China. In these weathered granites, rare earth elements—including yttrium and other HREEs—are loosely bound to clay minerals and can be desorbed by ammonium sulfate or similar leach solutions. The ore grades are modest, but mining and leaching can be conducted via relatively low‑capex methods such as in‑situ leaching or shallow open pits.
Outside China, potential yttrium feedstock comes from:
- Xenotime concentrates associated with heavy mineral sands, often recovered alongside zircon and ilmenite.
- Monazite concentrates, usually as a by‑product from heavy mineral sands processing or historical tailings.
- Ionic clays in other jurisdictions (for example, in parts of Southeast Asia, South America, and Africa), where exploration has identified similar weathered granitic systems.
Each of these pathways carries specific execution constraints. Xenotime and monazite are often thorium‑ and uranium‑bearing, triggering radiological permitting and waste management requirements that extend project timelines and increase capex for tailings management, encapsulation, and monitoring. Ionic clay projects outside China frequently face community and environmental concerns due to past negative experiences with poorly managed in‑situ leaching.
2.2 Separation and Refining: The Real Bottleneck
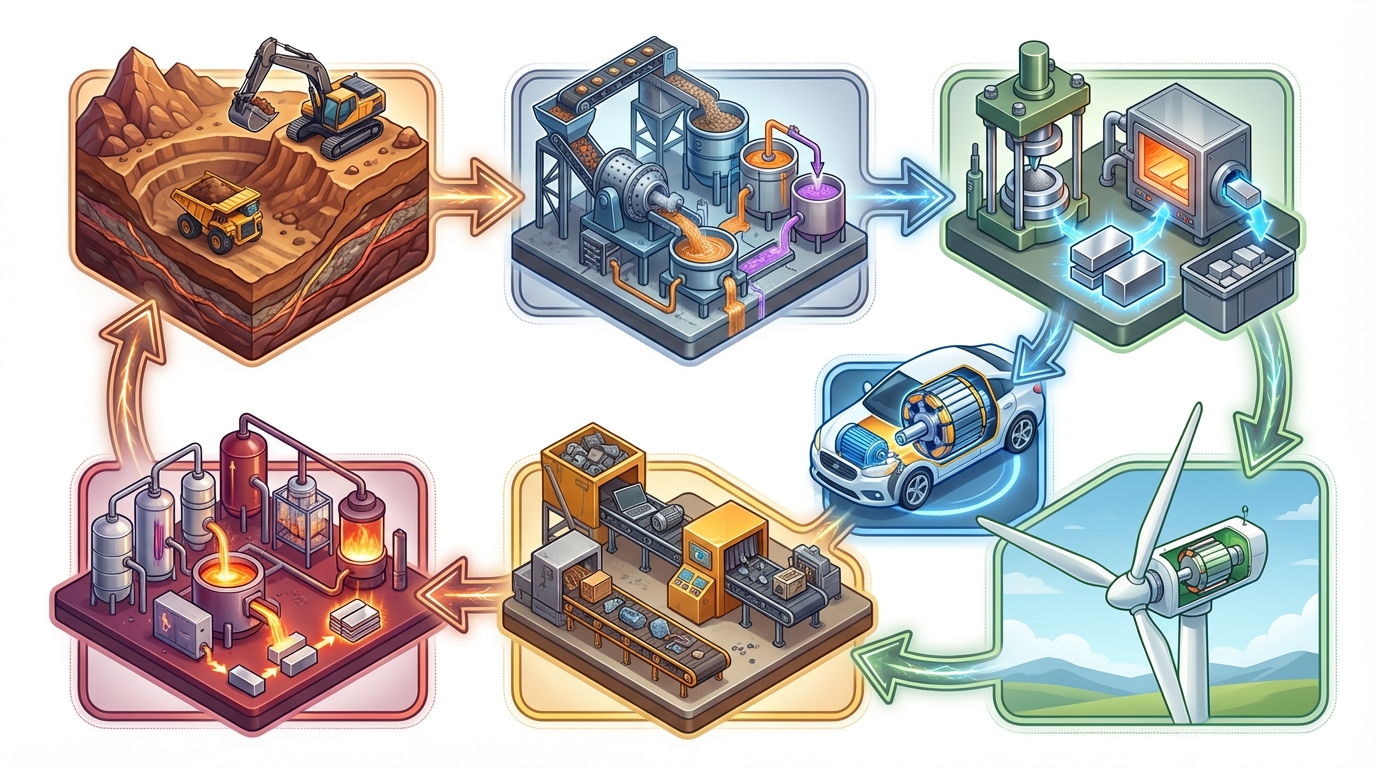
Even where feedstock is available, the transition from ore to ytrrium oxide (Y2O3) is technically complex. The standard flow sheet involves:
- Leaching and impurity removal to produce a mixed rare earth solution.
- Solvent extraction (SX) in multi‑stage mixer–settler banks or pulsed columns to separate light, medium, and heavy rare earth fractions.
- Further SX refinement in heavy rare earth circuits to isolate yttrium from neighboring elements such as dysprosium, holmium, erbium, and ytterbium.
- Precipitation, calcination, and milling to generate high‑purity yttrium oxide powders.
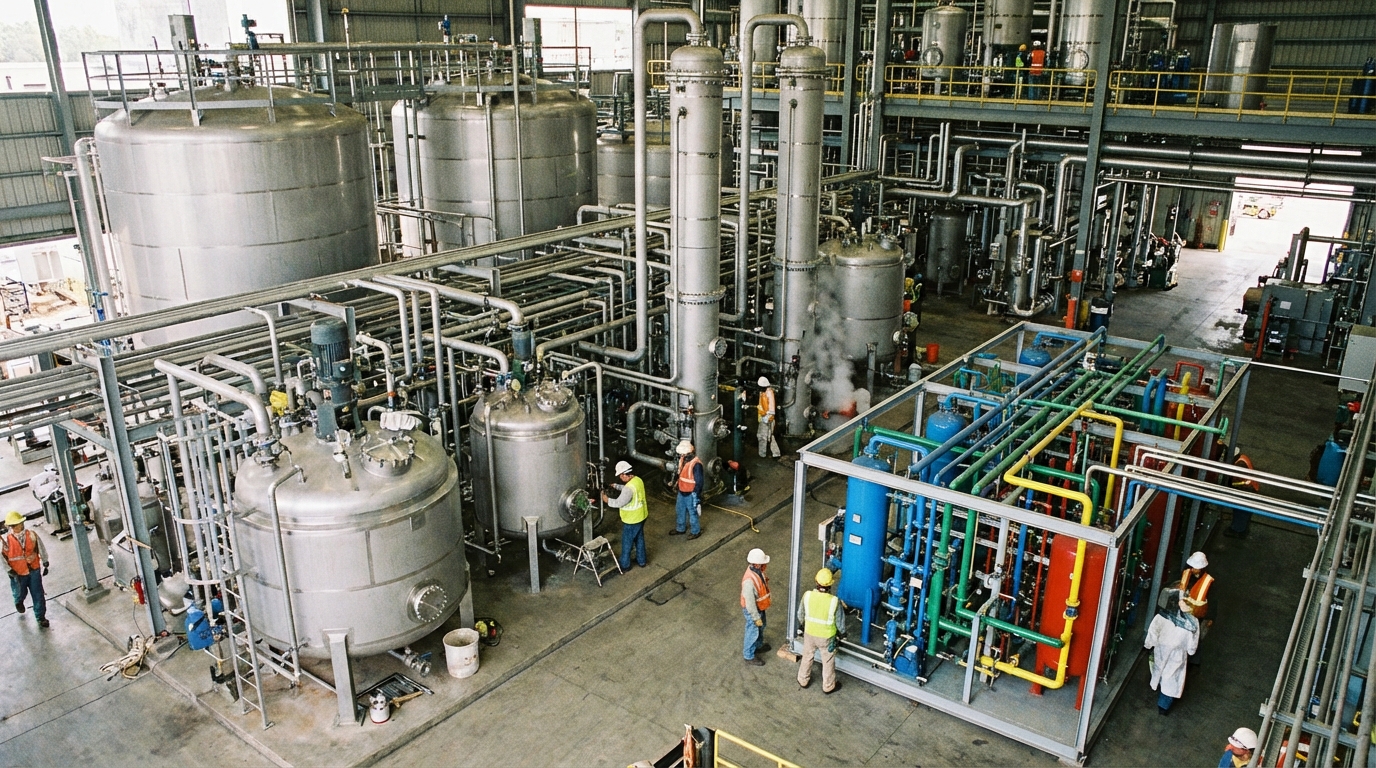
The SX part is capital‑ and operations‑intensive. Heavy rare earth separation typically requires very long SX trains with hundreds of stages, consuming significant organic solvent volumes and energy for pumping and agitation. Waste streams include ammonium, nitrate, sulfate, and organic residues that have to meet stringent discharge standards under modern environmental regulations.
China has invested over decades in this SX infrastructure, building integrated rare earth hubs with shared reagent logistics, waste treatment, and technical expertise. Outside China, only a small number of facilities have comparable heavy rare earth separation capability, and fewer still have experience optimizing circuits around yttrium recovery at high purity and consistent batch characteristics.
This is the core structural point: yttrium scarcity today is far more a midstream processing issue than a geological one. Ore bodies exist, but the hydrometallurgical circuits to turn them into aerospace‑ and semiconductor‑grade yttrium oxide are thinly distributed and slow to build under current permitting and financing frameworks.
3. The Shock Event: China’s April 2025 Export Controls
In April 2025, China introduced export controls covering several rare earths, with yttrium among the most tightly constrained. Public and industry reporting indicates two key control levers: quantitative export limits and dual‑use licensing requirements aimed at sensitive end uses, especially in aerospace and defense supply chains.
3.1 Price Dislocation and Dual Markets
Post‑control pricing behaviour demonstrates that the constraint is real, not rhetorical. European spot prices for yttrium oxide have been reported as increasing by more than fortyfold since early 2025, reaching levels on the order of a few hundred euros per kilogram. In contrast, domestic Chinese prices quoted in industry channels remain an order of magnitude lower, around single‑digit US dollars per kilogram.
The outcome is effectively a dual‑market structure:
- A low‑price, constrained domestic market inside China, where producers continue to sell to local consumers at prices more loosely tied to production cost.
- A high‑price, rationed external market, where limited export‑eligible volumes clear into Europe, Japan, Korea, and other jurisdictions at premiums driven by fear of further restrictions, not incremental OPEX.
Industry sources note that even after a broader US–China trade détente was announced in late 2025, yttrium prices outside China continued to climb. This persistence indicates that market participants interpret the controls as structural and strategically motivated, rather than as a short‑term bargaining tool.
3.2 Volume Collapse and the “De Facto Embargo” Effect
Price tells only half the story; volume data completes the picture. Chinese customs statistics cited in trade and policy analysis show that US imports of yttrium products fell from 333 tonnes in the eight months prior to the April 2025 controls to only 17 tonnes over the subsequent eight months—roughly a collapse from more than 40 tonnes per month to barely above 2 tonnes per month.

Beyond direct China–US flows, traders report that suppliers in other jurisdictions are hesitant to redirect yttrium toward US customers, concerned that visible support for US defense‑linked supply chains could trigger Chinese retaliation against their own China‑bound shipments. That chilling effect creates a de facto embargo layer on top of the formal restrictions, further tightening the yttrium oxide supply chain.
In practical terms, this means that nominally “open” supply from third countries is constrained by geopolitical risk calculations, not only by geology or processing capacity. For yttrium, diplomacy is now an operational parameter.
4. Sectoral Pressure Points: Where Yttrium Shortage Hurts First
4.1 Aerospace and Gas Turbines: Yttria‑Stabilized Zirconia as a Single‑Point Failure
Modern high‑bypass jet engines and industrial gas turbines rely on thermal barrier coatings to insulate nickel‑ and cobalt‑based superalloy blades from combustion temperatures well above alloy melting points. The workhorse material is yttria‑stabilized zirconia (YSZ), where a controlled yttrium oxide content stabilizes a tetragonal or cubic zirconia phase, conferring low thermal conductivity, high strain tolerance, and resistance to sintering at service temperatures.
The coating stack is typically applied by electron beam physical vapor deposition (EB‑PVD) or air plasma spray (APS), using yttria‑bearing ceramic feedstock powders or ingots. These feedstocks require tight control of yttrium content, phase distribution, and impurity levels (e.g., Si, Fe, alkali metals) to ensure lifetimes under thermomechanical cycling that align with engine overhaul intervals.
Reports from North American coatings firms in late 2025 describe concrete impacts:
- At least two aerospace coating manufacturers temporarily idled YSZ production lines because contracted yttrium oxide deliveries failed to arrive.
- One supplier reportedly exhausted yttrium oxide inventory entirely, halting sales of specific coating products.
- Rationing practices emerged, prioritizing engine OEMs and Tier‑1 integrators while deferring or refusing orders from smaller maintenance, repair, and overhaul (MRO) shops.
This comes at a time when airframe and engine manufacturers are under pressure to ramp output to clear large post‑pandemic order backlogs. Every uncoated turbine blade or vane becomes a bottleneck in that ramp. In this context, yttrium is not just another cost line item; it is a gating factor for engine delivery schedules.
4.2 Semiconductor Manufacturing: Yttria in the Fab
In semiconductor fabrication, yttrium enters mainly through yttria coatings and components used in plasma etch and deposition tools, as well as through certain high‑k or passivation materials. Yttria-coated chamber parts reduce particle generation and resist chemical erosion under aggressive plasma chemistries, prolonging maintenance intervals and improving process stability.
Fab and equipment executives quoted in industry coverage have characterized the seriousness of current yttrium constraints as “nine out of ten” on a criticality scale. One US‑based semiconductor CEO noted that shortages were already lengthening lead times for tool refurbishment, raising costs, and reducing equipment uptime, even if full line shutdowns had not yet occurred.
Alternative ceramic materials (such as certain alumina or rare‑earth‑free composites) exist for some chamber components, but they typically degrade faster or generate more particles under advanced plasma conditions. Switching materials requires requalification of process windows, particle performance, and contamination risk—often a multi‑quarter exercise for advanced nodes. In other words, even where technical substitutes exist, time‑to‑implement is the governing constraint.
4.3 Other Yttrium Applications: Flexible vs. Inflexible Demand
Beyond aerospace and semiconductors, yttrium appears in phosphors, LEDs, lasers, and performance ceramics. These sectors vary widely in their ability to flex demand:
- Lighting and display phosphors: Some scope exists to shift formulations toward alternative host lattices or phosphor mixes, especially as LED and display architectures evolve. Demand here is so relatively elastic.
- Laser crystals (YAG and related): High‑precision industrial and defense lasers rely heavily on yttrium‑based hosts. Qualification cycles are strict, and substitution is limited, making this segment less flexible.
- Advanced structural ceramics: Applications such as cutting tools, sealing components, and biomedical implants often use yttrium to stabilize zirconia or modify microstructures. Engineering teams may redesign using different compositions over time, but near‑term elasticity is constrained by certification and field performance requirements.
In practice, the least time‑critical and most cost‑sensitive yttrium applications are absorbing the first wave of demand reduction, freeing limited supply for aerospace and semiconductor uses. That triage buys time, but it does not eliminate the structural deficit in high‑specification segments.
5. Midstream Chokepoints: Inside the Yttrium Oxide Supply Chain
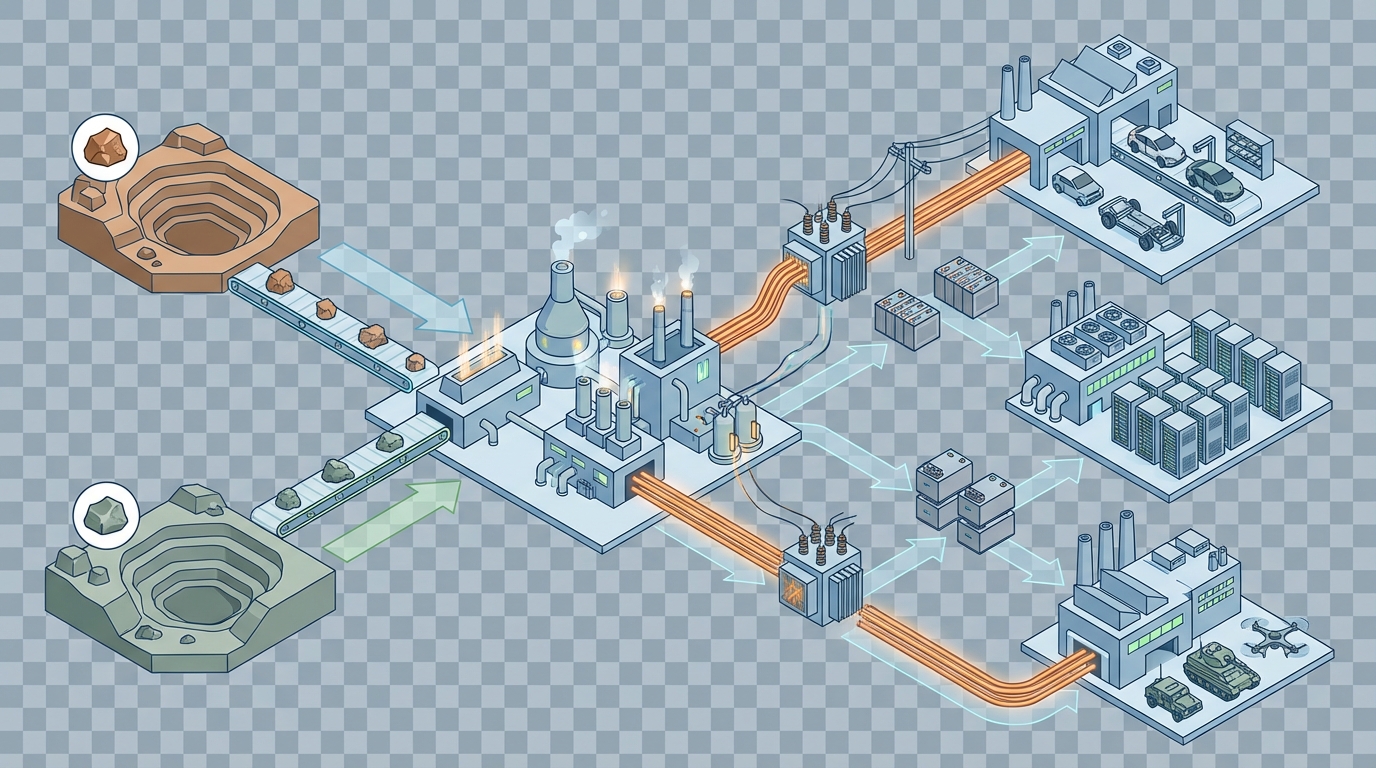
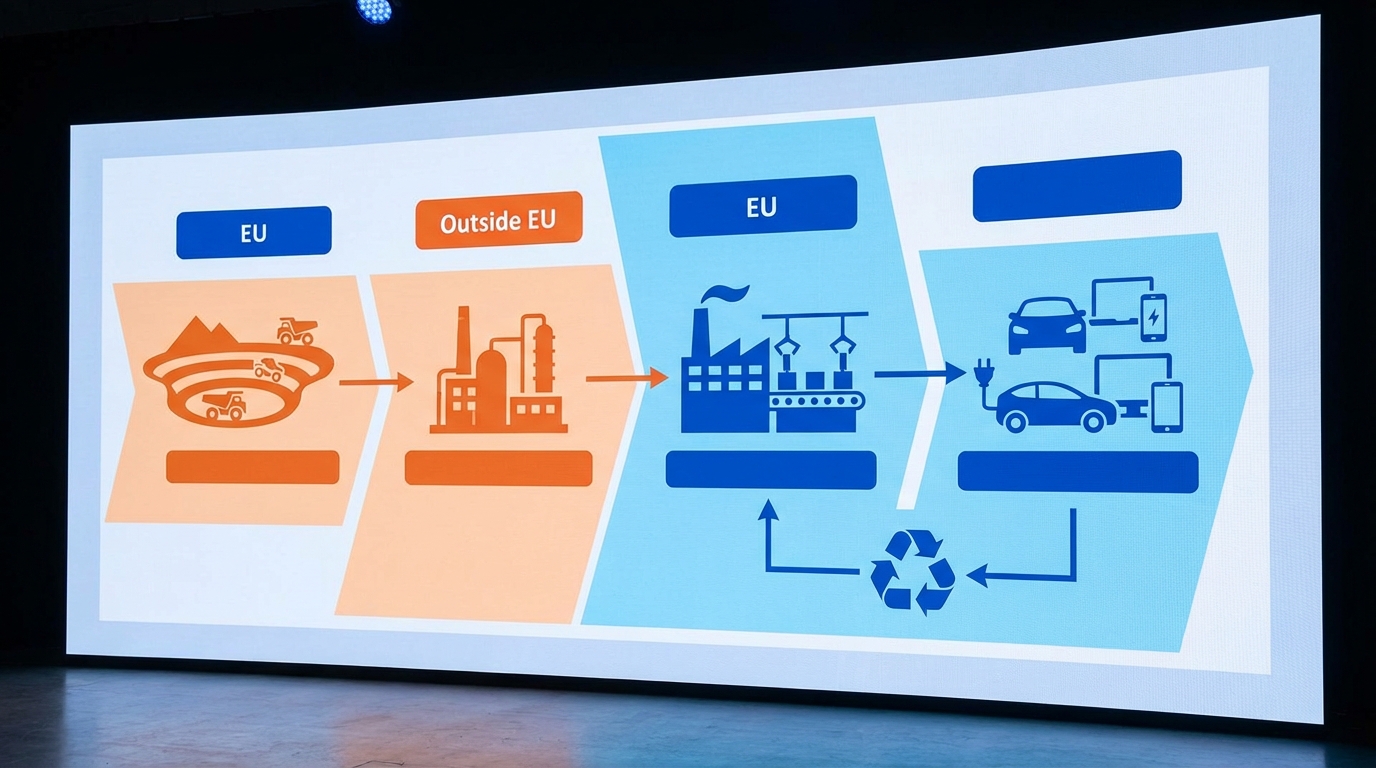
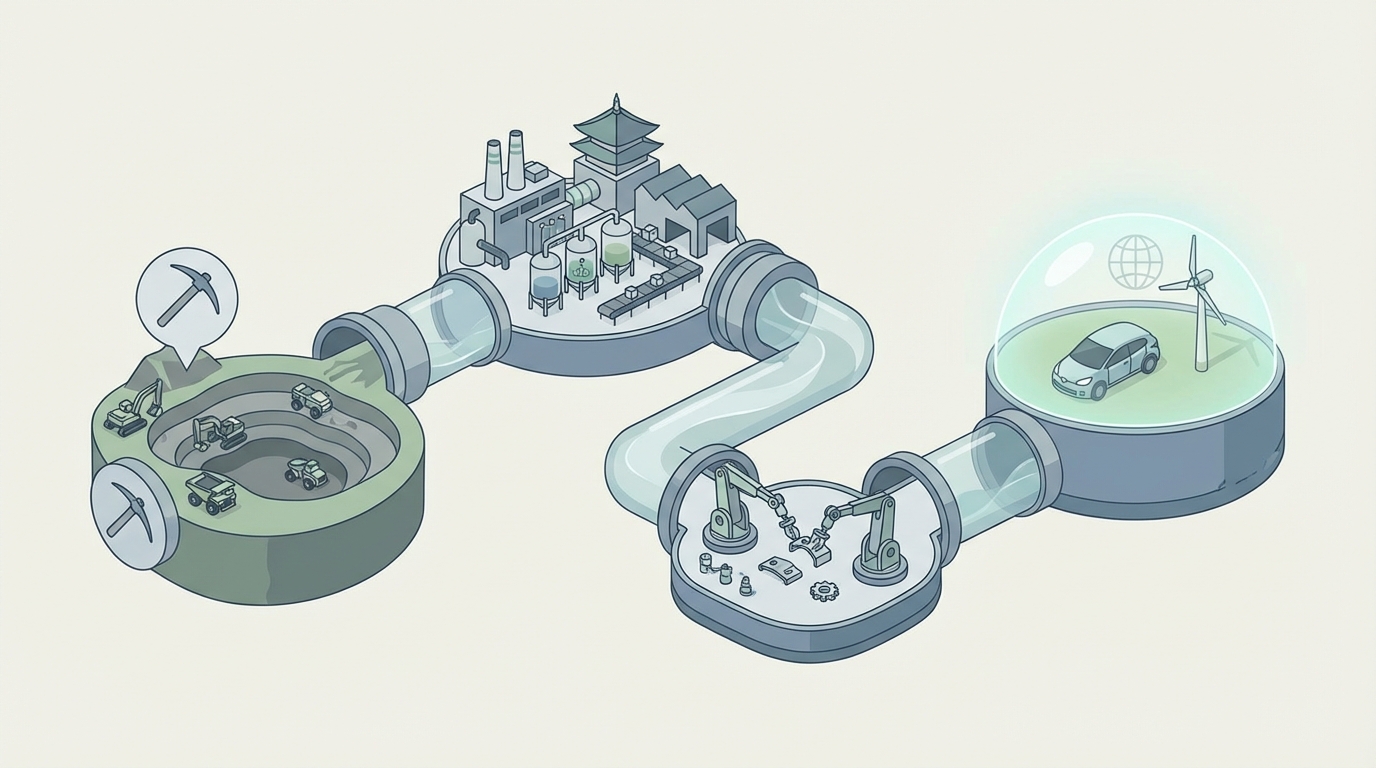
Understanding where yttrium supply chains actually fail requires dissecting the midstream. The generic chain runs:

- Mine or in‑situ leach operation → crude rare earth solution or concentrate
- Separation plant → individual rare earth oxides (including yttrium oxide)
- Chemical processor → engineered powders, granulates, or compounds tailored to specific applications
- Component producer → coatings, ceramics, lasers, chamber parts, and so on
In many critical yttrium applications, the real bottleneck is not just oxide itself, but application‑ready powder with tightly controlled properties.
5.1 From Mixed Rare Earths to Yttrium Oxide
At the separation plant level, yttrium is one product among many. Facilities that handle mixed rare earth feedstock allocate SX capacity across light, medium, and heavy rare earth cascades. Yttrium volumes are typically small compared with neodymium–praseodymium streams, but the capital tied up in heavy rare earth cascades is significant.
When regulatory or market pressures hit, operators often focus on elements with the highest aggregate revenue contribution. Historically, this has meant prioritizing magnet materials (Nd, Pr, Dy, Tb) more than yttrium. Under a constrained export regime, the combination of export licensing risk and lower headline revenue per tonne can result in yttrium circuits being throttled or mothballed for external customers, even if they continue to operate for domestic demand.
5.2 From Oxide to Engineered Powders and Coating Feedstocks
Aerospace coatings and semiconductor chambers rarely consume generic 99.9% yttrium oxide. They require:
- Specific particle size distributions, often sub‑micron or tightly controlled multi‑modal blends, to ensure predictable flow in thermal spray or PVD processes.
- Ultra‑low impurity levels—for example, alkali metal, silicon, and iron contents controlled to tens of ppm or below—to prevent dielectric breakdown, phase instability, or defect generation.
- Consistent phase composition to stabilize targeted crystal structures (e.g., fully controlled cubic or tetragonal content in YSZ).
These characteristics are created at specialized ceramic powder plants using milling, spray‑drying, calcination, and sometimes plasma spheroidization. Process control is intensive; deviations cause coating performance drift and can trigger costly requalification campaigns with aerospace regulators or fab customers.
Several of these powder plants have historically relied on stable, predictable yttrium oxide imports from China. The 2025 controls broke that assumption. Even when alternative oxide sources exist, aligning their impurity profiles and particle morphology with existing powders is non‑trivial. This is why, in practice, the yttrium oxide supply chain tightening translates into both physical shortage and extensive process engineering work at the midstream level.
6. Industry Responses: Substitution, Recycling, and New Projects
With near‑term Chinese supply constrained and non‑Chinese midstream capacity limited, actors across the value chain are pursuing three broad avenues: material substitution, recycling and scrap recovery, and development of new primary supply. Each path carries technical, regulatory, and timing constraints that define its realistic impact on the yttrium supply shortage.
6.1 Substitution and Redesign: How Much Yttrium Can Be Engineered Out?
In aerospace coatings, research teams are exploring alternative stabilizers and coating architectures—such as rare‑earth zirconates or multilayer systems that reduce yttrium content per coated part. Some turbine OEMs had already been testing such materials for higher turbine inlet temperatures or longer lifetimes; the supply shock has added a security‑of‑supply driver to what was previously a performance‑driven R&D program.
The challenge is that qualification cycles in aviation are measured in years, not quarters. Introducing new TBC chemistries typically involves rig testing, engine endurance trials, and extensive materials characterization under conditions that simulate decades of service. Regulators, leasing companies, and airlines all have a stake in these decisions. This implies that, even with accelerated programs, meaningful yttrium demand reduction in commercial engines is more of a medium‑term 2027+ phenomenon than a 2025–2026 relief valve.
In semiconductor tools, some component suppliers are redesigning parts to use alternative ceramics in less critical locations, or to reduce yttria thickness where erosion rates allow. However, core plasma‑exposed components at advanced logic and memory nodes remain strongly tied to yttria performance. Here again, substitution is possible but bounded, and extensive process requalification is a controlling factor.
6.2 Recycling and Process Scrap Recovery
Recycling is an under‑developed, but increasingly discussed, response. Two primary streams offer realistic yttrium recovery potential:
- Thermal barrier coating scrap: Spent blades and vanes removed from service often retain substantial coating material. Mechanical stripping and chemical leaching processes can, in principle, recover YSZ for reprocessing into new powder or oxide feedstock.
- Manufacturing scrap: Off‑spec powders, overspray from coating operations, and scrap ceramic components from semiconductor equipment manufacturing represent relatively high‑grade secondary sources.
Technically, hydrometallurgical routes can dissolve YSZ and precipitate yttrium and zirconium separately. The bottlenecks are logistics (collecting and sorting scrap at scale), contamination control (avoiding cross‑metal contamination from blades and fixtures), and the economics of small‑scale, high‑purity chemical processing.
As yttrium prices in ex‑China markets climbed to many multiples of historical levels, recycling economics have become materially more attractive, especially when framed as an industrial resilience measure rather than a purely cost‑saving exercise. However, the infrastructure for high‑purity yttrium recycling is nascent, and regulatory frameworks for handling coated aerospace scrap add additional layers of complexity.
6.3 New Non‑Chinese Supply Projects: Timelines and Constraints
A number of exploration and development projects have positioned themselves as alternative sources of heavy rare earths, including yttrium, in jurisdictions such as Australia, North America, and parts of Africa. Many of these involve ionic clay analogs or heavy mineral sands with xenotime and monazite.

From a technical execution perspective, several structural constraints shape their contribution to the yttrium oxide supply chain:
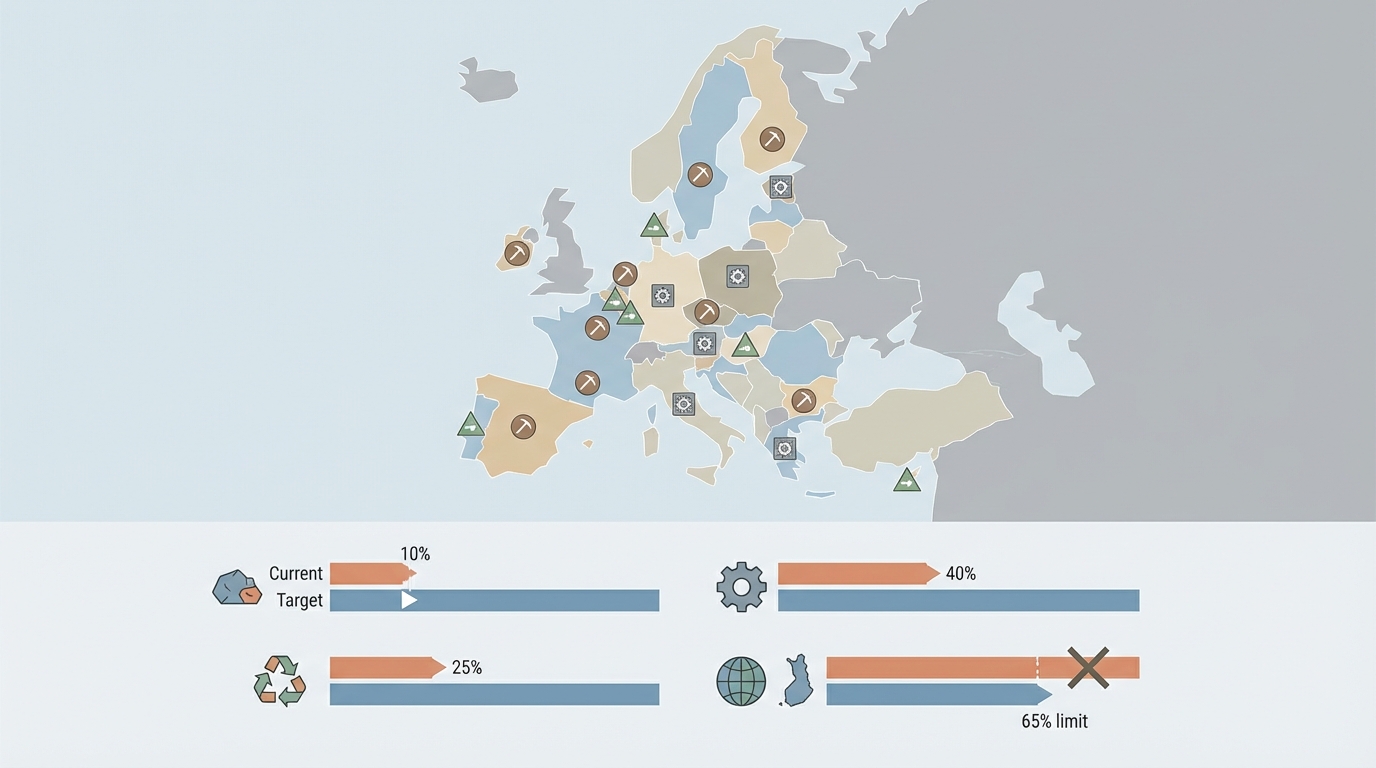
- Permitting and ESG compliance: Ionic clay and monazite projects face scrutiny around leaching chemistry, water use, and radioactive by‑products. Permitting timelines can stretch over many years, especially where communities recall legacy rare earth operations with poor environmental performance.
- Capex drivers: Building a heavy rare earth SX plant is capital‑intensive not only for tanks, mixer–settlers, and columns, but also for solvent storage, fire safety systems, and wastewater treatment infrastructure. The heavier the rare earth fraction, the more stages and solvent inventory are typically required per unit throughput.
- Throughput vs. product mix: Many projects are designed primarily around magnet materials (Nd, Pr, Dy, Tb). Yttrium may appear in feasibility studies as a secondary revenue contributor. Tuning circuits to increase yttrium recovery sometimes implies trade‑offs with other elements or higher unit OPEX.
Industry forecasts circulated in late 2025 suggest that meaningful alternative heavy rare earth supply, including yttrium, will not reach the market at scale before 2027. Until then, the system remains fundamentally tight, with minor disruptions or permitting delays capable of extending the supply‑demand imbalance.
6.4 Industrial Resilience and Financing Logic
Heavy rare earth projects, including yttrium‑rich ones, have historically struggled to secure financing because small tonnages and opaque pricing made long‑term cashflows hard to model. The 2025–2026 shock has reframed that calculus for a subset of end‑users who prioritize operational continuity over commodity price optimization.
Aerospace and semiconductor companies are increasingly structuring long‑term offtake agreements and sometimes participating in project‑level funding not purely as financial plays, but as part of critical operational continuity infrastructure. The logic is closer to securing backup power generation or redundant data centers than to trading a commoditized metal: even small guaranteed tonnages of yttrium oxide from a non‑Chinese source can materially de‑risk production schedules for specific high‑value product lines.
From an execution standpoint, this tends to favor projects that can demonstrate:
- Technically mature flow sheets with pilot‑scale validation, especially for heavy rare earth SX and waste management.
- Clear paths to compliance with EU, US, or equivalent environmental and radiological standards.
- Flexible plant designs that can adjust product mix between yttrium and other heavy rare earths as demand patterns evolve.
These features do not guarantee project success, but they align with the industrial resilience priorities visible in current offtake negotiations.
7. Compliance and Geopolitical Risk Architecture
Yttrium’s status has shifted from niche chemical to controlled dual‑use material in the span of a single policy cycle. This has reshaped compliance workloads across aerospace, defense, and semiconductor supply chains.
Key elements of the new risk architecture include:
- Chinese dual‑use export licensing for yttrium and certain yttrium‑bearing compounds, requiring detailed end‑use declarations and subjecting shipments to extended review timelines and uncertainty.
- US and allied export control regimes that treat advanced turbine coatings, semiconductor tools, and related know‑how as sensitive technologies, triggering “deemed export” considerations when foreign nationals access controlled data.
- Critical raw material designations in the EU, US, and other jurisdictions, which bring both support mechanisms (e.g., permitting acceleration initiatives) and heightened reporting and due diligence expectations.
For procurement and compliance teams, yttrium sourcing now intersects with sanctions screening, supply chain traceability, and human resources policy (for example, vetting access to coating process IP). Lead times are increasingly influenced by paperwork and licensing queues in Beijing, Washington, Brussels, and Tokyo as much as by logistics and plant throughput.
A critical operational insight emerging from 2025–2026 is that yttrium supply risk is asymmetric: a small regulatory change can have outsized impact on a thinly diversified supply chain, whereas ramping new compliant capacity takes many years. This asymmetry is why policy developments around rare earths need to be tracked as closely as physical inventory levels.
8. 2026–2028 Scenarios: What Drives Yttrium Tightness from Here
Projecting yttrium market balances over the next several years is inherently uncertain, but the key structural drivers are clear:
- Aerospace and turbine demand trajectory: Engine OEM backlog, fleet replacement cycles, and industrial turbine installations all determine coating demand. As long as ramp‑up plans remain aggressive, yttrium intensity in these sectors anchors a large inflexible demand block.
- Semiconductor capacity build‑out: New fabs and tool installations, especially at advanced logic and memory nodes, increase demand for yttria components. Cleanroom expansions in several jurisdictions suggest continued upward pressure.
- Policy stability or escalation: Beijing’s stance on yttrium export controls—and any analogous measures by other states—will set the baseline for ex‑China availability. Relaxation could relieve pressure rapidly; further tightening would extend or deepen the supply shortage.
- Timing of new non‑Chinese HREE projects: Commissioning slippage, ramp‑up performance, and qualification of new yttrium oxide streams for aerospace and semiconductor use will determine when diversification efforts translate into real, high‑purity tonnes.
- Success of substitution and recycling efforts: Effective coating redesigns or robust recycling circuits could progressively lower primary yttrium demand per unit of industrial output.
Materials Dispatch’s read of current signals is that even under optimistic assumptions on new projects, the yttrium oxide supply chain will remain structurally tight through at least the mid‑to‑late 2020s for aerospace‑ and semiconductor‑grade material. The system is transitioning from an era of cheap abundance to one of engineered scarcity, where access depends as much on relationships, compliance posture, and willingness to underwrite new capacity as on spot market purchasing power.
Conclusion: Yttrium as a Test Case for Critical Materials Strategy
Yttrium has quietly become the element that exposes whether critical material strategies are built on detailed process understanding or on headline lists of “rare earths.” Its supply chain tightening is not a black swan; it is the predictable outcome of decades of processing concentration, limited attention to heavy rare earth midstream capacity, and a geopolitical environment that increasingly weaponizes dual‑use materials.
The decisive technical realities are clear. Yttrium’s role in TBCs and semiconductor chambers anchors a block of demand that cannot be displaced rapidly without redesigning core industrial systems. Upstream ore availability is not the binding constraint; specialized separation and powder‑processing infrastructure is. Compliance overhead and geopolitical signaling now influence yttrium delivery schedules as much as shipping logistics.
For Materials Dispatch, yttrium is an early test case of how quickly industrial systems can reconfigure around critical materials once policy shocks arrive. Ongoing monitoring of Chinese export regulations, permitting and ramp‑up progress at non‑Chinese HREE projects, and qualification timelines for alternative coatings and recycling flows will be the weak signals that define whether this remains a multi‑year squeeze or evolves into a longer‑lasting structural regime.
Note on Materials Dispatch methodology Materials Dispatch integrates regulatory text monitoring (including Chinese MOFCOM announcements and allied export control updates), trade and customs data for rare earth flows, and technical end‑use specifications from aerospace, semiconductor, and advanced ceramics standards. This combination enables early identification of when policy moves will intersect with specific process requirements to create genuine supply chain failure points.