Author: Anna K

  • Australia’s Critical Minerals Reserve Breaks the Chinese Offtake Model

    Australia’s Critical Minerals Reserve Breaks the Chinese Offtake Model

    **Australia is coupling a price‑banded national critical minerals reserve with sovereign equity in projects like Arafura’s Nolans and the VHM-Shenghe break at Goschen, reshaping how rare earths, gallium, and antimony are financed, processed, and contracted outside China.**

    Australia Breaks the Chinese Offtake Model: Critical Minerals Sovereignty as Industrial Infrastructure

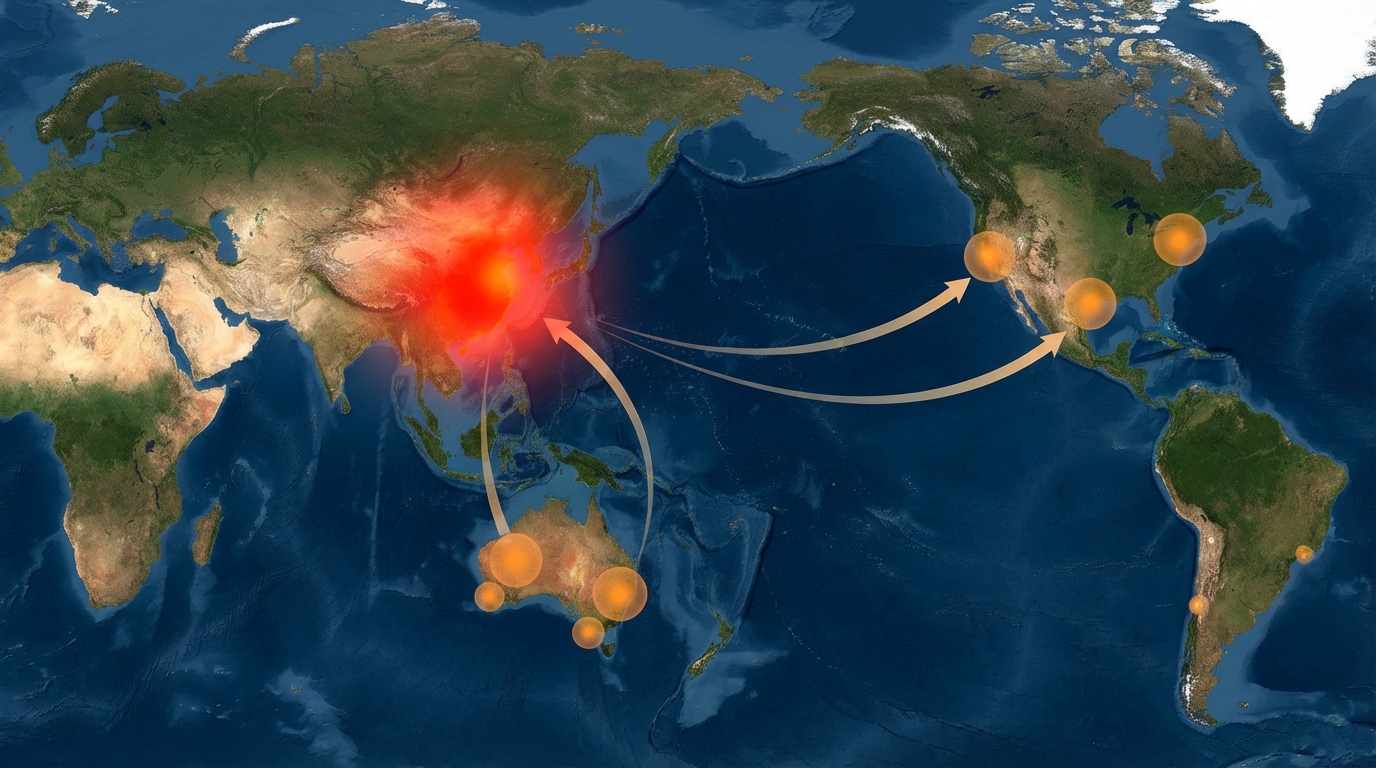
    Australia is moving from being a raw material supplier into building a tightly engineered sovereignty system for critical minerals. The emerging architecture combines three levers: a national reserve for rare earths, gallium, and antimony with guaranteed price bands; the termination of Chinese offtake exposure at assets like VHM’s Goschen project; and sovereign equity via the National Reconstruction Fund’s (NRF) reported $200 million commitment to Arafura Rare Earths’ Nolans project.

    The operational question is straightforward but profound: can a state-backed price floor and ceiling regime, coupled with state equity in processing, deliver reliable, non‑Chinese supply without locking miners and end users into another form of structural dependence? The answer will be determined less by high‑level strategy statements than by the way contracts, plant designs, and logistics are being re‑engineered around this new model.

    For mining companies, refiners, trade policymakers, and supply chain strategists, the critical detail is not that Australia is stockpiling metals. It is that Canberra is deliberately inserting itself into the offtake stack: as buyer of last resort, source of price stabilization, and co‑owner of midstream processing. That combination changes how projects are banked, how plants are configured, and which specification sheets ultimately dominate the non‑Chinese market.

    The Architecture of Australia’s National Critical Minerals Reserve

    Australia’s critical minerals strategy has moved from concept papers to an emerging operational structure in which a national reserve plays a central role. Public statements and policy documents indicate a clear focus on three groups of materials: rare earths (with an emphasis on magnet materials like NdPr), gallium, and antimony. All three are metals where China currently dominates processing and downstream trade, and where export controls or informal quotas have already been deployed as policy tools.

    The reserve concept departs from traditional, passive stockpiling. Instead, it is being framed as an active stabilization mechanism: government entities stand ready to buy when prices fall below a defined floor and to release stock into the market when prices exceed a defined ceiling. In practice, that creates a band around a reference price, within which normal market trading is expected to occur with reduced volatility.

    Administratively, the reserve is being woven into existing critical minerals institutions. The National Reconstruction Fund, with its multi‑billion‑dollar mandate for industrial transformation, is a core funding vehicle. Implementation touches the Critical Minerals Office and the Department of Industry, Science and Resources, which oversee project qualification, ESG criteria, and domestic value‑add thresholds. Rather than simply funding mines, the system targets projects that integrate extraction and refining within Australia or allied jurisdictions.

    From a technical standpoint, this model turns the reserve into a quasi‑industrial customer. It will specify minimum product types and purity levels that can be accepted into the stockpile. For rare earths, that likely means separated oxides (particularly NdPr oxide and potentially didymium blends) rather than mixed concentrates. For gallium, high‑purity metal suitable for semiconductor precursor production. For antimony, refined metal or trioxide meeting alloy and flame‑retardant specifications. That technical granularity matters because it forces upstream projects to design flowsheets and quality control systems around the targeted reserve products.

    Price Floors and Ceilings: How the Band Changes Project Risk

    The price‑band mechanism is the real structural innovation. Traditional mining offtakes often embed discounts to volatile spot benchmarks, leaving projects heavily exposed to cyclical troughs. China’s ability to flood or constrict export volumes in rare earths, gallium, and antimony has historically turned that cyclicality into a strategic weapon. Australia’s reserve seeks to blunt that instrument by offering a transparent, rules‑based band in which sovereign purchases and releases smooth extremes.

    In broad design, the floor is anchored to multi‑year average prices or cost‑based benchmarks, with an allowance for volatility. When market prices fall substantially below that anchor, reserve managers can offer to purchase qualifying material at or near the floor, subject to volume limits and compliance criteria. The ceiling works in mirror fashion: when prices materially overshoot the anchor, material from the reserve can be offered into the market, again under defined conditions, to relieve tightness.

    Technically, this turns the sovereign into a large, rules‑driven counter‑cyclical trader. That role is operationally demanding. It requires:

    • Transparent reference pricing, derived from a mix of exchange data, published assessments, and bilateral contract benchmarks.
    • Robust assays and certification systems to ensure that purchased materials meet reserve specifications, particularly for multi‑element streams such as rare earth oxide mixes.
    • Storage infrastructure for corrosive or reactive materials (e.g., antimony trioxide) that complies with environmental and safety regulations over multi‑year horizons.
    • Mechanisms to rotate stock, reprocess where necessary, and avoid degradation or obsolescence against evolving downstream specifications.

    From the project perspective, the presence of an accessible floor reduces the probability of “price‑floor‑breach” scenarios in loan models and internal risk cases. Life‑of‑mine plans can be calibrated around a narrower downside band. That does not eliminate market risk; it channels it. The trade‑off is clear: upside capture may be moderated when ceilings trigger, but catastrophic downside, especially from politically induced dumping, becomes less likely.

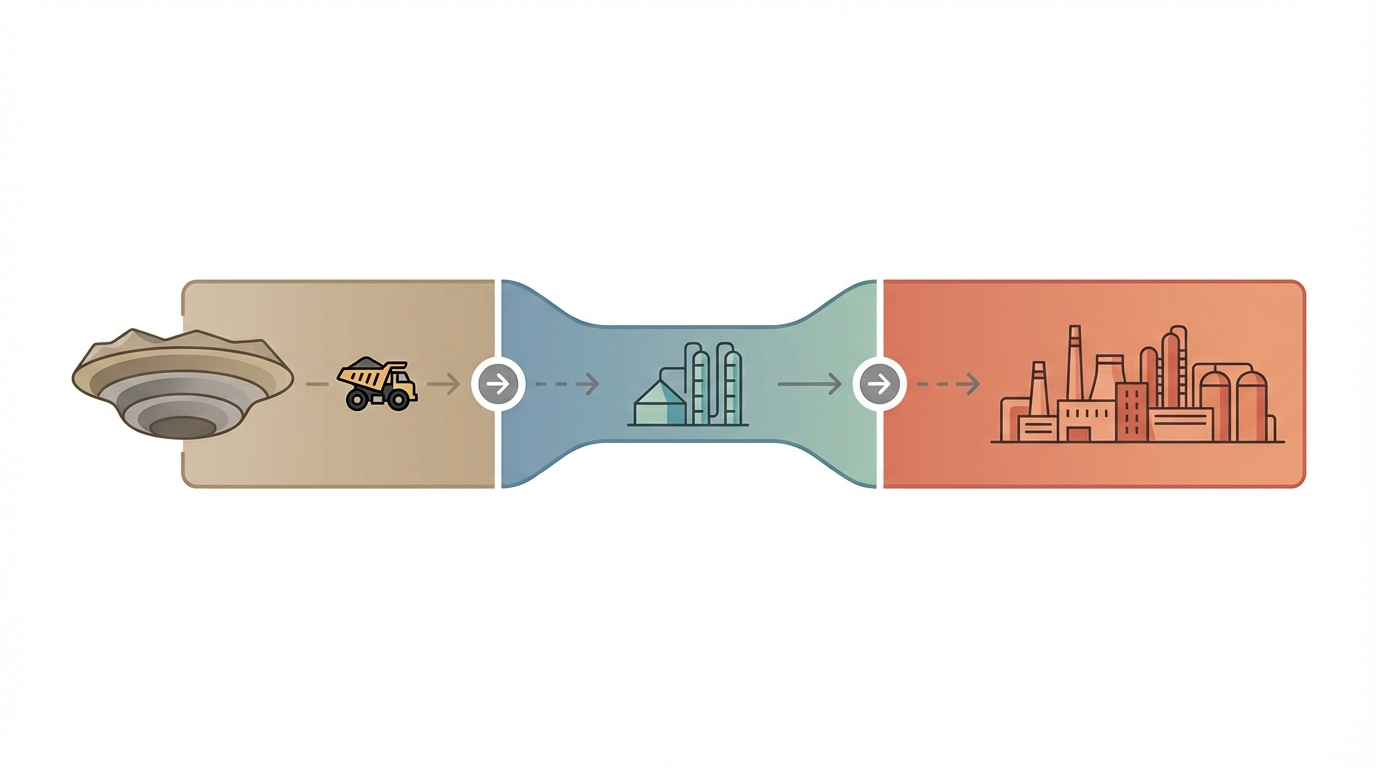
    One of the more subtle implications is on flowsheet selection. With a sovereign reserve paying for material that meets defined oxide or metal specifications-even during market stress-projects have a stronger incentive to build integrated hydrometallurgical and separation capacity domestically, rather than exporting intermediate concentrates for Chinese refineries to upgrade. The price band effectively underwrites the additional OPEX and CAPEX friction that comes with building and running complex SX (solvent extraction), ion exchange, calcination, and reduction circuits in high‑cost jurisdictions.

    Case Study: VHM’s Goschen Project and the Shenghe Offtake Termination

    The VHM-Shenghe episode is the first visible break point where Australia’s sovereignty architecture has collided with the legacy Chinese offtake model. VHM’s Goschen project in Victoria is a multi‑commodity mineral sands and critical minerals development that had previously been advancing under an offtake understanding with China’s Shenghe Resources-a company deeply embedded in the global rare earth refining system.

    The termination of that offtake agreement signalled more than a bilateral commercial dispute. It reflected a deliberate strategic pivot: willingness by an Australian developer to forego the perceived security of a Chinese refinery buyer in favour of alignment with domestic policy and allied demand. For antimony and other critical elements associated with Goschen’s flowsheet, this is a non‑trivial decision. Shenghe’s ecosystem offers large installed processing capacity, established impurity‑tolerant flowsheets, and global marketing channels. Stepping away from that infrastructure forces Goschen’s developers to build or access alternative midstream solutions.

    In practical terms, the termination reshapes the technical and logistical planning envelope for Goschen:

    Processing plant representative of downstream rare-earths and antimony refining.
    Processing plant representative of downstream rare-earths and antimony refining.
    • Product specification path: Instead of targeting specifications optimised for Chinese refineries (which can accommodate certain impurity profiles and deliver further separation in‑country), Goschen must now match the needs of Western refineries or end‑use alloy and magnet producers. That can change the design of beneficiation, leaching, and impurity removal steps.
    • Process selection: If antimony and other critical by‑products are to be sold into a reserve or to allied industrial customers, the plant may need additional roasting, leaching, and refining steps to deliver higher‑purity outputs locally, rather than shipping complex concentrates.
    • Logistics and port strategy: Where a single Chinese offtaker could have taken mixed streams to a few large refineries, a diversified offtake and reserve strategy creates a more complex outbound logistics pattern, with different bagging, containerisation, and certification requirements per product.
    • Permitting and ESG alignment: A shift away from China‑bound concentrates toward refined products made in Australia exposes the project more intensively to domestic scrutiny on emissions, waste, and reagent use, especially for high‑temperature or acid‑intensive circuits.

    The national reserve is not a direct replacement for Shenghe’s role, but it changes the calculus for Goschen’s sponsors and lenders. The presence of a credible sovereign buyer of last resort for certain antimony or rare earth streams can underpin offtake diversification away from a single Chinese counterparty. However, it also introduces policy risk: eligibility criteria, ESG conditions, and price band parameters are subject to political and regulatory evolution over the project life.

    This is where the Goschen case becomes emblematic. It shows that decoupling from Chinese offtakers is not only a geopolitical statement. It is a commitment to re‑engineering the entire value chain—from ore sorting and tailings handling to SX circuit design and port logistics—to be compatible with Western specifications and sovereign buyer frameworks, rather than Chinese refiner requirements.

    Case Study: Arafura’s Nolans Project and the $200 Million National Reconstruction Fund Stake

    If VHM’s Goschen illustrates the break with the old model, Arafura Rare Earths’ Nolans project demonstrates what the new model looks like when sovereign capital steps in. The NRF’s reported $200 million commitment to Nolans is more than a balance‑sheet boost. It effectively binds the project’s midstream to Australia, aligning it with the national reserve, allied offtakers, and domestic industrial policy.

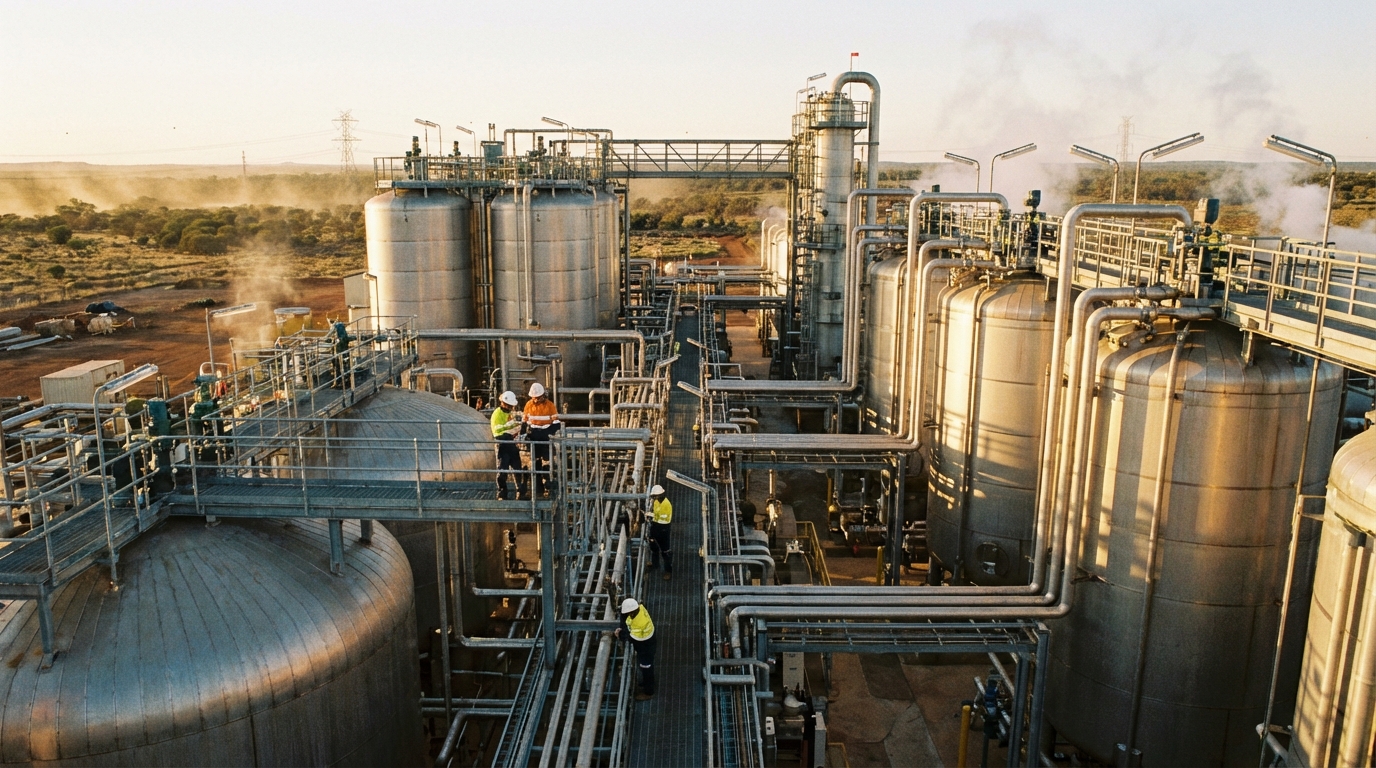
    Nolans, located in the Northern Territory, is designed as an integrated mine‑and‑refinery operation focused on magnet rare earths, particularly neodymium and praseodymium (NdPr). Unlike projects that ship concentrates offshore, its flowsheet encompasses beneficiation, cracking, leaching, impurity removal, solvent extraction separation, and final oxide production. That depth of processing is technically demanding, energy‑intensive, and capital hungry—precisely the type of infrastructure that is difficult to finance on conventional terms when the market is dominated by Chinese refineries with lower operating costs and deeply amortised plants.

    With NRF equity and associated policy backing, Nolans is being positioned as a cornerstone of non‑Chinese NdPr supply. That has several operational consequences:

    • Product quality targets: Nolans is oriented toward high‑purity NdPr oxide suitable for sintered and bonded permanent magnet production. That implies tight control of deleterious elements such as thorium, uranium, and certain transition metals. SX circuit design must achieve high separation factors while maintaining acceptable reagent consumption.
    • Energy and reagent logistics: The integrated flowsheet requires sustained supplies of acid, base, extractants, and power in a remote setting. Grid extensions, on‑site generation (potentially gas‑hybrid or renewable‑hybrid), and dedicated chemical supply chains are all part of the underlying infrastructure challenge.
    • ESG and waste handling: Domestic processing means that all residues, including mildly radioactive tailings and neutralised process liquors, fall under Australian regulatory regimes. That drives design choices around lined tailings storage, zero‑liquid‑discharge or high‑recovery water circuits, and long‑term monitoring obligations.
    • Offtake structure: With sovereign equity involved, offtake negotiations are naturally influenced by policy objectives. Contracts with allied magnet makers or automotive OEMs may need to align with the reserve’s price‑band logic and with broader industrial strategies (for instance, commitments to local magnet manufacturing over time).

    From a resilience perspective, Nolans offers something that Chinese‑centred supply cannot: deep transparency on ore provenance, environmental performance, and labor standards, combined with contractual access to a sovereign‑backed price and volume framework. The trade‑off is higher operating cost and more complex operational risk. Australia’s wager is that for defense, automotive, and grid‑scale applications, end users will value predictable, policy‑aligned supply over the marginal cost advantage of Chinese material.

    Gallium and Antimony: From By‑Products to Strategic Reserve Metals

    Gallium and antimony are often treated as minor by‑products in mining project narratives, but they sit at the core of Australia’s reserve strategy. Both are emblematic of the vulnerabilities exposed by China’s export control and quota playbook.

    Gallium is predominantly recovered as a by‑product of bauxite/alumina and zinc processing. Its strategic value lies in compound semiconductors (GaAs, GaN) for radio‑frequency electronics, power electronics, and optoelectronics. China currently dominates both primary production and high‑purity refining. When Beijing moved to restrict exports of gallium‑related products, it highlighted how dependent advanced semiconductor and defense applications had become on a small number of refineries.

    Australia’s response targets two levers. First, improving by‑product recovery from existing alumina and base metals operations, potentially through retrofit of solvent extraction or electrolytic recovery stages. Second, building high‑purity refining capability to reach semiconductor‑grade gallium (multiple “nines” purity). Both steps are technically non‑trivial: gallium occurs in low concentrations, and upgrading to ultra‑high purity involves repeated refining, tight contamination control, and specialised equipment.

    The reserve gives operators an anchor customer for these upgraded streams. Instead of relying solely on volatile niche demand from a handful of overseas gallium processors, Australian facilities can supply a portion of output into the national stockpile at the agreed floor. That changes the business case for installing and running high‑purity circuits on relatively modest tonnages, where unit costs can otherwise be prohibitive.

    Antimony has a different profile but an equally strategic role. It is used in flame retardants, lead‑acid batteries, certain alloys, and military applications ranging from munitions to specialty solders. Supply has been heavily concentrated in China and, more recently, in Myanmar and a small number of other jurisdictions subject to political instability and regulatory risk.

    Production routes for antimony typically involve mining stibnite (Sb2S3), followed by roasting and smelting to produce metal or trioxide. These steps are energy‑ and emissions‑intensive, generating SO2 and other pollutants that are increasingly difficult to permit in high‑regulation jurisdictions. Australian projects that can co‑produce antimony with gold or other metals—such as those around Victoria—therefore face a familiar challenge: export concentrates to existing Asian smelters, or invest in cleaner domestic processing solutions that comply with strict local standards.

    The reserve’s antimony target is intended to anchor domestic refining. The availability of a sovereign outlet for refined antimony or antimony trioxide at a known floor price strengthens the case for incorporating modern roasting, gas scrubbing, and hydrometallurgical refining onshore. Over time, that can support allied supply chains for munitions, flame retardant manufacturers, and specialized alloy producers who are under pressure to decouple from inputs tied to unstable or non‑aligned jurisdictions.

    How Australia’s Model Compares with US and EU Critical Minerals Approaches

    Australia is not the only jurisdiction seeking to reduce dependence on Chinese critical mineral supply, but its chosen instruments differ in important ways from US and EU approaches. The contrast is less about rhetoric and more about the plumbing of support mechanisms.

    Close-up of high-purity rare-earth and critical-metal samples used in advanced manufacturing.
    Close-up of high-purity rare-earth and critical-metal samples used in advanced manufacturing.

    In the United States, the toolkit has centred on Defense Production Act authorities, the Defense Logistics Agency (DLA) stockpile, and tax or grant support via legislation such as the Inflation Reduction Act. The DLA acquires materials for defense needs, but generally does not operate a formal price‑band regime. Instead, offtake agreements and purchase contracts are used to support specific projects (for example, rare earth operations) at agreed pricing structures, often with emphasis on availability rather than explicit market stabilization.

    The European Union, through the Critical Raw Materials Act and related initiatives, has emphasised accelerated permitting, designation of strategic projects, and co‑funding of processing and recycling infrastructure. EU work on strategic stocks is ongoing, but again, the focus has been more on ensuring the existence of stockpiles and diversified suppliers than on inserting the state as a continuous price‑band operator.

    Australia’s emerging framework can be contrasted along several dimensions:

    Dimension Australia United States European Union
    Core Instrument National reserve with explicit price floor/ceiling band; sovereign equity and debt via NRF DLA stockpile; project‑specific offtakes; grants and loans under DPA/IRA Critical Raw Materials Act; strategic project status; co‑funding of processing and recycling
    State Role in Pricing Active counter‑cyclical buyer and seller within a defined band Contractual support; limited explicit market‑wide price targeting Focus on volumes and capacity; less emphasis on price bands
    Processing Mandate Strong emphasis on domestic or allied midstream refining, linked to NRF support Preference for North American processing but with broader geographic flexibility Priority for EU‑based processing and recycling, with recognition of allied supply
    Key Metals Targeted Rare earths, gallium, antimony, plus broader critical minerals list Rare earths, battery materials (lithium, nickel, cobalt, graphite), others Broad CRM list with specific benchmarks for extraction, processing, recycling
    Decoupling Mechanism Explicit reduction of Chinese offtake exposure; support for alternative offtakes and reserve intake Diversified projects and offtakes; restrictions on Chinese‑linked entities in some segments Supplier diversification; scrutiny of strategic Chinese investments; emphasis on permitting and ESG

    The quotable difference is this: Australia is not just subsidizing capacity; it is attempting to rewrite the reference contract for critical minerals by embedding the state inside the pricing mechanism itself. That approach creates a clearer path for mines like Nolans or Goschen to proceed with domestic processing, but it also concentrates price‑setting risk in Canberra’s hands.

    Operational Trade‑Offs, Failure Modes, and Compliance Risks

    Any system that offers guaranteed price support carries inherent risk of miscalibration. For the Australian reserve, there are three critical failure modes to monitor.

    1. Structural Floor Dependence. If floors are set too generously or remain in place for prolonged periods, mines and refiners can become structurally dependent on sovereign purchases rather than competitive commercial offtakes. That creates a quasi‑permanent subsidy, complicating WTO compliance debates and potentially slowing the development of robust, diversified private demand. It also exposes public finances to extended support for operations that may struggle to achieve global cost competitiveness.

    2. Ceiling‑Induced Opportunity Loss. If ceilings are set too low relative to bull‑market conditions, producers may be constrained in capturing high‑price periods that are important for recouping capital. For rare earths, gallium, and antimony, where price spikes can be short but pronounced in response to geopolitical shocks, the ability to harvest those spikes can materially affect corporate resilience. A misaligned ceiling risks undercutting that flex while still leaving producers exposed to input‑cost inflation.

    3. Specification and ESG Mismatch. The reserve’s acceptance criteria will reflect stringent Australian ESG and quality standards. Projects designed around historical Chinese offtakes may need significant retrofits—additional impurity removal, emissions controls, water‑treatment capacity—to deliver acceptable material. If these retrofits are underestimated, projects may technically qualify for the reserve on paper but struggle in practice to produce sufficient compliant tonnage, undermining both project economics and reserve stocking goals.

    There are also non‑trivial regulatory and trade policy risks. Other producers or trading partners could argue that price‑band interventions constitute trade‑distorting subsidies if they materially influence export prices. Careful design—such as limiting reserve purchases to domestic consumption or allied strategic uses, and ensuring transparent, rules‑based operations—will be central to mitigating these challenges.

    On the operational side, the technical demands of managing physical stockpiles at scale should not be underestimated. Rare earth oxides can absorb moisture and CO2, altering properties over long storage periods if packaging and warehouse conditions are inadequate. Gallium’s low melting point and reactivity require specific containment and handling protocols. Antimony compounds pose toxicity risks and demand robust ventilation and dust‑control in storage facilities. Failures here would translate into quality downgrades, write‑offs, or environmental incidents that could erode public and industrial support for the reserve mechanism.

    Strategic Scenarios and Signals to Watch

    The intersection of the national reserve, the VHM-Shenghe offtake termination, and the NRF‑backed Nolans build‑out creates a new operating environment for critical minerals in Australia. Several structural scenarios are emerging.

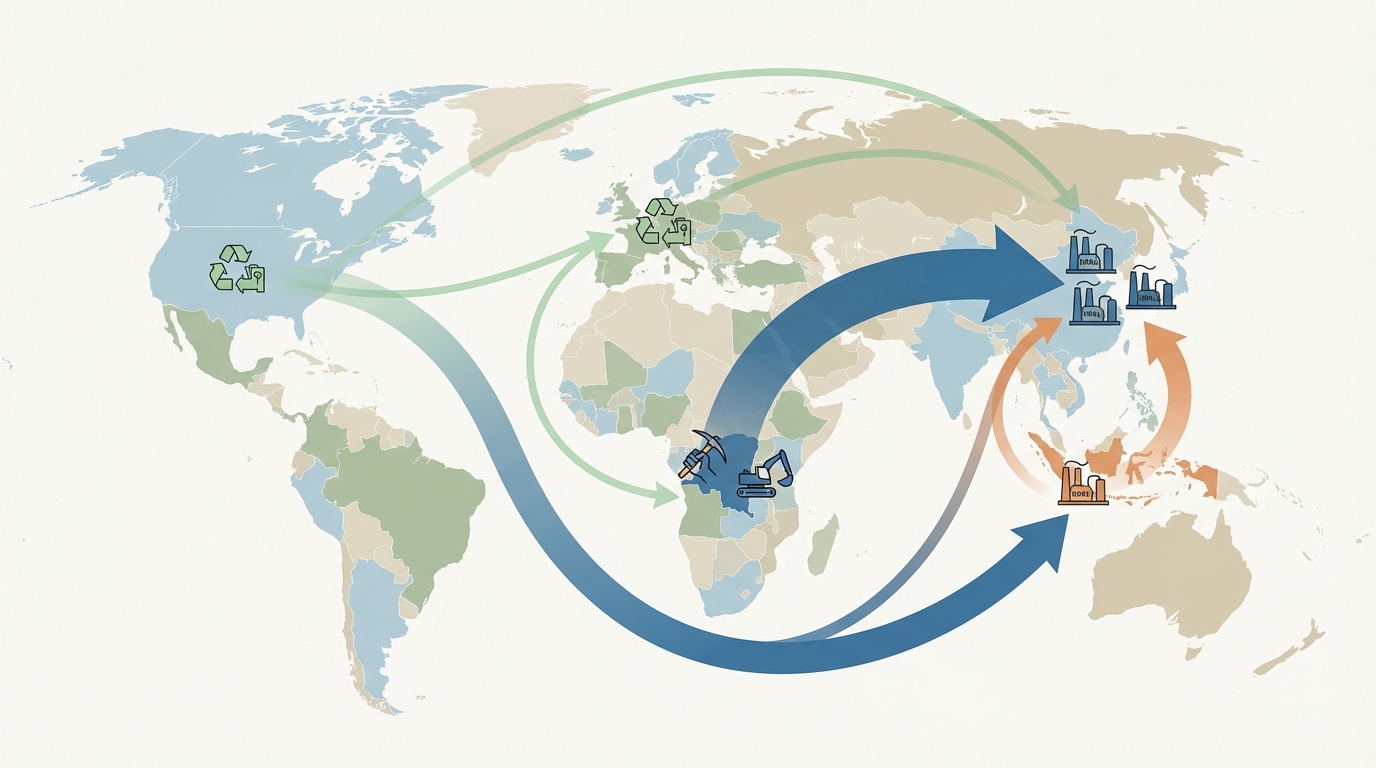
    Consolidation into an Australian‑Centric Supply Hub. In this scenario, Nolans and Goschen succeed in commissioning robust domestic processing, gallium recovery expands at alumina and base‑metal facilities, and antimony refining achieves environmentally compliant scale. The reserve operates as intended, smoothing volatility without crowding out private offtakes. Allied industrial users—particularly in Japan, Korea, Europe, and North America—lock in long‑term contracts linked to the Australian price band, using it as a reference benchmark alternative to Chinese sources.

    Reserve Overreach and Distorted Signals. A more problematic scenario sees price bands routinely triggered, with the reserve absorbing large volumes in downturns and struggling to release them without depressing future prices. Projects lean on the sovereign outlet rather than building out diversified customer bases. Chinese suppliers respond tactically, undercutting the floor for key customers in third countries, leaving Australian material heavily reliant on government support. The model achieves short‑term survival but not true strategic autonomy.

    Partial Decoupling and Dual‑Track Markets. A more nuanced outcome has Australia and its allies establishing a parallel, policy‑aligned market channel with higher transparency and ESG standards, while a China‑centred channel continues to operate at lower costs and higher volatility. Material from projects like Nolans flows predominantly into the allied channel, sometimes at a premium, while parts of the global market remain linked to Chinese refiners’ pricing and offtake practices.

    Across these scenarios, several weak signals deserve close monitoring:

    • The number and scale of further terminations or renegotiations of Chinese‑linked offtakes by Australian critical minerals projects, following the VHM–Shenghe example.
    • The detailed rulebooks governing how price floors and ceilings are set, adjusted, and communicated for rare earths, gallium, and antimony.
    • The specific product specifications (purity, form, packaging) adopted by the reserve for each metal, which will cascade back into mine and refinery design decisions.
    • Announcements of allied industrial offtakes explicitly referencing Australian reserve‑linked pricing or NRF‑backed projects as anchor supply sources.
    • Any early operational or environmental incidents at domestic processing plants handling complex rare earth, gallium, or antimony streams, which could tighten regulatory constraints.

    Conclusion: A New Reference Contract for Critical Minerals

    Australia’s critical minerals strategy is transitioning from policy language to a concrete operating framework centred on three pillars: a price‑banded national reserve, deliberate decoupling from Chinese offtakers as exemplified by the VHM–Shenghe Goschen break, and sovereign equity in midstream processing through moves like the NRF’s $200 million Arafura stake at Nolans. Together, these measures redefine not just where rare earths, gallium, and antimony are mined and refined, but how they are priced, contracted, and stockpiled across the non‑Chinese ecosystem.

    The trade‑off is clear. Australian material backed by this architecture is unlikely to be the absolute lowest‑cost in the market. However, it can offer a different value: transparent provenance, policy‑aligned reliability, and a state‑engineered buffer against the most violent forms of price and volume coercion. For industrial users where failure to secure inputs would disrupt national security or critical infrastructure, that value proposition is non‑trivial.

    Materials Dispatch’s assessment is that Australia is effectively attempting to write a new reference contract for critical minerals supply—one in which the state is not an occasional supporter but a permanent, rule‑bound participant in both pricing and processing. Whether that contract becomes the template for allied jurisdictions, or a uniquely Australian experiment, will hinge on how the first tranche of projects and reserve operations handle the inevitable shocks of the coming decade. Our team is actively monitoring weak signals in offtake renegotiations, reserve rule‑making, and allied procurement standards that will indicate which way this experiment is breaking.

    Note on Materials Dispatch methodology Materials Dispatch integrates close monitoring of official policy releases (such as Australia’s Critical Minerals Strategy), trade and export control bulletins from agencies including MOFCOM and allied regulators, and market data from specialized critical minerals price reporting. This is cross‑checked against the technical requirements of end‑use sectors—from magnet performance specifications to semiconductor purity thresholds—to assess how policy instruments like price‑banded reserves translate into real‑world operational resilience.

  • Albemarle Kemerton Shutdown: Why $4B Western Lithium Refining Failed

    Albemarle Kemerton Shutdown: Why $4B Western Lithium Refining Failed

    **Albemarle’s early‑2026 closure of the Kemerton lithium hydroxide plant in Western Australia, after more than $4 billion of sunk capital, is not a story of weak demand or short‑term price cyclicality. It is a demonstration that Western lithium refining, under current energy, labor, reagent, and scale conditions, sits structurally outside the Chinese cost curve-just as Fastmarkets projects 15-40% lithium demand growth in 2026 driven by AI data‑center energy storage. Policy subsidies have largely targeted concrete and steel, while the physics and industrial organization of Chinese chemical clusters continue to dictate the global cost base.**

    Four Billion Dollars and Nothing to Show for It: What Kemerton Reveals About Western Lithium Refining

    Albemarle’s decision in early 2026 to shut its Kemerton lithium hydroxide plant in Western Australia, after investing more than $4 billion, crystallizes a pattern that has been building for a decade. Major Western attempts to onshore lithium chemical processing repeatedly fail to reach durable competitiveness, even when backed by generous grants, tax credits, and strategic rhetoric.

    This closure did not occur in a demand recession. Fastmarkets’ 2026 outlook points to global lithium demand growth in the order of 15-40% year-on-year, with a significant share of the upside tied to large-scale battery systems for AI data centers and grid balancing. In other words: the market is expanding rapidly, particularly for high-spec lithium hydroxide suited to high-nickel and advanced LFP chemistries.

    Yet even with this demand backdrop, Kemerton could not defend its position on the cost curve against Chinese refiners. The facility was effectively priced out of the market by competitors drawing on cheaper energy, lower labor costs, integrated reagent supply, and above all, much larger and denser processing clusters. The outcome is a stranded asset in Western Australia and a reinforced reliance on Chinese midstream for an increasingly strategic metal.

    The operational question for the lithium value chain is therefore not whether demand will be there-it already is-but why Western plants like Kemerton remain structurally uneconomic and what that implies for supply security, industrial policy, and project design in the rest of this decade.

    Kemerton in Focus: Design, Ambition, and Early Shutdown

    Kemerton was conceived as a flagship Western lithium hydroxide monohydrate (LHM) facility, positioned close to world-class spodumene feedstock in Western Australia. Public disclosures and industry reporting describe a phased development: an initial train nominally designed around 24,000 metric tonnes per year (MT/year) of LHM, with later expansion paths toward roughly 50,000 MT/year. Feed would be sourced from hard-rock concentrate, notably from the Greenbushes operation, and processed via conventional alkaline conversion and crystallization routes.

    Commissioning began in the early 2020s, with ramp-up stretching over several years. By mid‑decade the plant had achieved meaningful output but never reached nameplate capacity at stable, competitive unit costs. Challenges cited in industry discussions included:

    • Energy costs significantly above initial engineering estimates, driven by gas and grid power pricing in Western Australia.
    • Labor intensity higher than benchmark Chinese plants, partly due to workforce expectations in a remote, high-wage jurisdiction and constraints on automation.
    • Reliance on imported or high-logistics-cost reagents, in contrast with Chinese clusters where sulfuric acid, soda ash, and other inputs are often produced on-site or nearby.
    • Difficulty diluting fixed overheads over relatively modest volumes compared with 100,000-200,000 MT/year Chinese refineries.

    By early 2026, Albemarle elected to suspend and then close operations, taking an impairment on the order of $4 billion associated with Kemerton-related assets. The plant moved to care-and-maintenance, with a residual cost just to keep the facility safe and compliant, but with no clear path back to competitive production under the existing operating environment.

    From a technical standpoint, Kemerton did not fail because the chemistry was exotic or unproven. The flowsheet was broadly conventional for hard-rock to hydroxide conversion. The breakdown came where Western projects most often stumble: at the intersection of power tariffs, labor and reagent overhead, and insufficient scale to offset these disadvantages. That is what turns a multi‑billion‑dollar project into a stranded chemical complex even as the underlying commodity remains in secular growth.

    Chinese vs Western Lithium Hydroxide Costs: A Structural Gap, Not a Cycle

    Market benchmarking for 2025–2026 places Chinese lithium hydroxide plants firmly at the low end of the global cost curve, with many operations clustered in integrated chemical hubs in Jiangxi, Sichuan, and other provinces. Western facilities such as Kemerton, even with subsidies, tend to sit in the upper quartile.

    Industry cost breakdowns for representative plants show the gap is not driven by a single factor but by stacked advantages. Chinese plants benefit from lower-cost, more stable industrial energy; cheaper and more flexible labor; vertically integrated or co‑located reagent supply; and, critically, large capacities that spread fixed costs over substantially higher volumes.

    Indicative comparative structures—based on 2025–2026 cost benchmarking for a large Chinese refinery versus Kemerton-type Western facilities—look as follows:

    Cost Component Chinese LHM Hub (Indicative) Western LHM Plant (Kemerton-Type) Observed Relationship Primary Drivers
    Energy Lower absolute power and fuel cost per kg, with baseload coal and hydro Several times higher energy cost per kg, using higher-priced gas and grid power Roughly 2–3× higher unit energy cost in Western plants Industrial power tariffs; fuel mix; lack of integrated captive generation
    Labor Lean crews per 50–100kt train; wage levels aligned with local manufacturing norms Higher headcount per tonne and substantially higher wages Often 4–5× labor cost per kg in Western facilities Wage differentials; roster structures; union agreements; automation gaps
    Reagents Acid, alkali, and auxiliary chemicals often produced in-cluster at low logistics cost Significant proportion imported or trucked over long distances Frequently 1.5–2× reagent cost per kg in Western plants Domestic chemical industry depth; by‑product integration; transport
    Capex Amortization Large single-site capacities (100–200kt/year) and high utilization Smaller trains (20–50kt/year) with slower ramp-up and lower utilization Capex per kg amortized cost several times higher in Western operations Scale economies; learning curves; construction cost base
    Overheads & Compliance Streamlined local permitting once zones are designated for chemicals Extensive environmental, community, and safety compliance overheads Higher fixed overhead per tonne in Western jurisdictions Regulation depth; reporting requirements; ESG expectations

    In the aggregate, industry data referenced in the prior analysis suggest Chinese lithium hydroxide cash costs in the high single to low double digits per kilogram equivalent, with Western plants more than double that level in many cases. The Kemerton experience, where internal cost estimates were reported well above typical Chinese benchmarks, is consistent with this structural pattern.

    Two points are critical. First, this is not simply about wage levels. Energy and reagents alone create a substantial gap. Second, subsidies that touch only initial capital cannot fundamentally alter operating-cost rankings over a plant life measured in decades. A Western refinery built with public support still pays Western power prices, Western wages, and Western reagent logistics for as long as it runs.

    Energy as the Hard Constraint: Power-Intensive Chemistry in High-Tariff Systems

    Lithium hydroxide production from hard-rock feed is highly energy-intensive. Typical flowsheets entail crushing, calcination or conversion, leaching, impurity removal, concentration, and crystallization. Each major unit operation draws on electrical or thermal energy, with industry benchmarks placing total consumption on the order of many tens of kilowatt-hours per kilogram of finished LHM, depending on feed grade and process design.

    Chinese plants often operate with access to low-tariff industrial electricity—frequently coal-based, sometimes supplemented by hydro or other sources. Power prices in major lithium hubs have historically been a fraction of those faced by electro-intensive industries in Western Australia, Europe, or parts of North America. In several documented cases, lithium refiners in China also benefit from preferential tariffs or local support measures as “strategic” industries within provincial plans.

    By contrast, Kemerton operated in a power system where wholesale prices reflected a mix of gas-fired generation, growing renewables penetration, and limited baseload coal. When gas prices spiked, or when renewable variability required peaking generation, delivered electricity costs rose materially. For a facility consuming large, relatively inflexible baseload power, this directly translated into volatility and elevation in unit production costs.

    Decarbonization policies add another layer. Western jurisdictions increasingly couple power prices with carbon costs, grid charges, and renewable support mechanisms. While these align with climate objectives, they act as a surcharge on every kilowatt-hour consumed by a refinery. Chinese provinces have also set decarbonization goals, but in practice coal capacity and supportive industrial tariffs have been maintained or expanded, providing lower and more predictable energy inputs for midstream chemical plants.

    This asymmetry is the crux: lithium hydroxide is an energy-constrained product. Locating electro-intensive refining inside high-tariff, carbon-priced, intermittency-challenged grids creates a baked-in disadvantage versus coal-backed, industry-prioritized grids—even before considering labor or reagents.

    Labor and Reagents: High-Cost Inputs in Fragmented Western Ecosystems

    Labor and chemical reagents are the next pillars of the structural gap. At Kemerton-scale plants, fixed staffing requirements—from control room operators and maintenance crews to environmental, safety, and administrative teams—are substantial. In Western Australia, wage levels, conditions under national employment law, and the need to attract skilled workers to remote locations drive a high labor cost base.

    Industry comparisons cited in prior analyses suggest that for roughly comparable output volumes, Chinese plants have operated with fewer employees and substantially lower average wages, resulting in per‑kilogram labor costs several times lower than at Kemerton-style facilities. Differences in automation, tolerance for manual operations, and workforce rostering all play a role, but the central fact is that refined chemical production has been sited in regions where manufacturing labor is priced accordingly.

    Reagents reinforce this disparity. Lithium hydroxide production relies heavily on acids (often sulfuric), alkalis (such as soda ash or lime), and a suite of process chemicals. Chinese lithium hubs are frequently embedded within or adjacent to extensive chemical industry clusters. Sulfuric acid can be a by‑product of metals or phosphate production; soda ash and lime are sourced from nearby integrated plants; freight distances are short; and intermediates may be transferred via pipelines or dedicated rail.

    In Western Australia, by contrast, critical reagents often travel long distances by truck or ship. Pricing reflects not only global commodity values but freight, handling, and storage in relatively small and dispersed markets. The result, as reflected in cost benchmarking, is reagent cost per kilogram of lithium hydroxide commonly 1.5–2 times the Chinese level—again, before considering any carbon penalties or environmental levies associated with reagent production and use.

    Scale and Cluster Effects: Why 20–50kt Western Trains Cannot Match 100–200kt Chinese Hubs

    Scale is the multiplier that magnifies all of the above. Chinese lithium hydroxide capacity is heavily concentrated in very large plants or clusters, with individual sites commonly designed or expanded to 100,000–200,000 MT/year or more. These hubs share utilities, maintenance infrastructure, effluent treatment, and sometimes workforce training and housing.

    Learning curves in chemical processing tend to be steep. As cumulative output increases, operators refine operating practices, debottleneck critical sections, and optimize reagent and energy consumption. Fixed overheads—from plant management to laboratory operations—are spread over more tonnage, and procurement can be negotiated on large annual volumes.

    Western plants such as Kemerton have been engineered more cautiously, often in 20,000–50,000 MT/year trains, sometimes with multi‑phase expansions that are delayed or reprioritized when markets turn volatile. In such configurations, fixed costs are locked in early, but the tonnage over which those costs are amortized remains modest. If utilization then drops below design—due to ramp-up issues, price cycles, or feedstock constraints—the unit cost spikes further.

    Material Dispatch’s reading of cost-curve analyses is that even if a Western refinery matches Chinese plants on process efficiency, the combination of smaller scale and higher-input costs keeps it outside the low-cost quartile. That is precisely the position Kemerton ended up in: technically operational, but too high on the global cost curve to run sustainably at mid‑cycle hydroxide prices.

    AI Data Centers as a New Lithium Load: Demand Rising into Structural Midstream Weakness

    While the midstream struggles, demand signals from downstream are strengthening. Fastmarkets’ 2026 scenarios point to global lithium demand growth in the range of 15–40% year-on-year. A notable share of that increment is expected to originate not only from electric vehicles, but from stationary energy storage supporting AI data centers and grid stability.

    Large-scale AI data centers consume vast quantities of power; operators increasingly pair these facilities with battery energy storage systems (BESS) for uninterruptible power supply (UPS), peak shaving, and participation in ancillary grid services. The scale is already measured in hundreds of gigawatt-hours per year of installed storage capacity across hyperscale cloud providers and major technology firms.

    In this application, lithium iron phosphate (LFP) chemistries are often favored for their safety profile, cycle life, and cost structure. that said, the lithium chemical feeding both LFP and many nickel-rich chemistries is increasingly lithium hydroxide, especially where tighter impurity specifications are required. AI data center BESS tend to demand high-purity hydroxide with low levels of sodium, calcium, and heavy-metal contaminants, to minimize degradation and ensure predictable performance over long duty cycles.

    Industry analyses referenced in the prior work suggest that, given the value density of AI workloads and the cost of downtime, these operators can absorb lithium hydroxide prices in the low-to-mid-teens dollars per kilogram without fundamentally derailing project economics. Hardware, construction, and power infrastructure dominate total cost of ownership; cathode chemicals are important but not decisive at the margin.

    This creates a paradox. On one hand, high-value AI storage demand is relatively price-inelastic in the ranges currently forecast for 2026. On the other, Western hydroxide plants priced well above the Chinese cost curve still cannot survive in that environment, because of competition from lower-cost imports. Rising demand does not rescue structurally uncompetitive refineries; it steers more volumes toward whichever midstream is structurally cheapest, which today remains overwhelmingly Chinese.

    2026 Market Balance: Fastmarkets Scenarios and the Midstream Bottleneck

    Fastmarkets’ 2026 lithium outlook sketches a market that is tight but not catastrophically short. In their scenarios, aggregate lithium demand reaches well into the million‑plus tonne LCE range, with growth of roughly 15–40% over 2025 depending on EV adoption trajectories and stationary storage buildout. Within that, hydroxide continues to grow share relative to carbonate as high-nickel cathode deployments persist and advanced LFP variants strengthen.

    On the price side, Fastmarkets indicates a band for 2026 lithium hydroxide spot assessments centered in the low-to-mid-teens dollars per kilogram. Carbonate prices remain somewhat lower but are influenced by the same underlying supply-demand fundamentals. Importantly, these price ranges are not high enough, under current Western cost structures, to shift Kemerton-like plants into the first half of the cost curve on a sustained basis.

    Supply on the mining side looks less constrained. Hard-rock projects in Australia and lepidolite or brine assets elsewhere can collectively support significant LCE volumes, at least under current forward plans. The choke point is the chemical conversion stage: taking spodumene or other feedstock and turning it into battery-grade hydroxide. This is precisely the stage where Western capacity such as Kemerton has struggled to compete.

    The result is a midstream bottleneck that is geographic rather than purely volumetric. Global conversion capacity exists and is expanding, but it is disproportionately located in China. Western closures remove non-Chinese conversion options just as AI and EV demand deepen reliance on high-purity hydroxide. For supply chain managers and policy analysts, this combination—strong demand growth plus regionally concentrated refining—defines the risk envelope more than any single year’s price forecast.

    Why Subsidies Have Not Closed the Gap: Capex Support vs Opex Reality

    Over the first half of the 2020s, Australia, the United States, and the European Union collectively directed many billions of dollars in grants, loans, and tax credits toward critical minerals processing. Kemerton itself benefited from Australian state and federal support; similar patterns are visible in North American and European projects targeting lithium, nickel, and other battery metals.

    Most of this support, however, has been structured around capital expenditure: partial funding of plant construction, accelerated depreciation, or subsidized debt. These mechanisms improve project financing metrics and can bring first production forward by a few years. They do not change the fundamental operating environment into which the plant is born.

    If an LHM refinery faces electricity prices several times higher than a Chinese counterpart, pays labor rates multiple times higher, purchases reagents from fragmented supply chains, and operates at half the scale, then a one‑time capital contribution may reduce the initial hurdle but leaves the long-term unit cost differential intact. Over a 20‑ to 30‑year asset life, that operating gap dominates the economics.

    Kemerton’s trajectory is emblematic. Despite the backing and strategic designation, the plant’s all‑in costs reportedly remained well above those of Chinese peers. Once prices normalized from the extreme spikes earlier in the decade, the refinery’s structural disadvantages were exposed. The decision to close was effectively an acknowledgment that subsidized capex cannot indefinitely carry an uncompetitive opex profile in a globally traded commodity.

    From an industrial policy standpoint, this underlines an uncomfortable reality: Western efforts that treat refining primarily as a political or security project, without aligning energy, chemical, and labor ecosystems around it, risk creating expensive, short-lived assets. The physics of power-intensive chemical processing does not bend easily to legislative timelines.

    Observed Responses Across the Value Chain: How Actors Are Adapting

    The Kemerton closure has not occurred in isolation. It forms part of a sequence of delays, mothballings, and scope reductions at Western midstream projects over the last several years. Across the lithium value chain, several patterns in behavior are already visible.

    First, there is an observable tilt toward upstream exposure. Hard-rock spodumene projects in resource-rich regions such as Western Australia retain attractive industrial positions. Their cost structures are dominated by mining and concentration rather than high-tariff power or complex reagent ecosystems. Industry commentary points to strong operating margins at established assets, making upstream supply less structurally vulnerable than midstream refining in high-cost jurisdictions.

    Second, battery and cathode producers have increasingly channeled conversion volumes through large Chinese hubs, sometimes via tolling arrangements or long-term offtake with integrated groups. Massive clusters in provinces such as Jiangxi or Guizhou, with hundreds of thousands of tonnes of LHM capacity, function as global service centers for both domestic and foreign cathode makers. The effective cost and scale advantages of these hubs remain difficult to replicate elsewhere.

    Third, some downstream actors are exploring a hybrid approach: partial diversification into non-Chinese refining for a minority of their volume, even at higher cost, while keeping the bulk of tonnage anchored in lower-cost Chinese supply. This approach accepts a premium for a “secure” tranche of material while recognizing that relying exclusively on high-cost Western refineries would erode competitiveness in price-sensitive EV markets.

    In parallel, AI data center and grid-storage developers appear, based on published specifications and procurement disclosures, to focus more on security of delivery and system integration than on shaving the last dollars per kilogram from LHM input prices. Where overall project economics can tolerate lithium hydroxide in the low-to-mid-teens per kilogram, the primary concern becomes physical availability and long-term contracts, not absolute minimal cost.

    For all these actors, Kemerton is less a surprise than an explicit data point: a case where a technically functional, well-funded Western refinery still exited because it was fundamentally misaligned with the global cost structure. That realization is beginning to filter into project design, contract strategy, and regulatory debates.

    Conclusion: Kemerton as a Structural Warning, Not a Cyclical Casualty

    Albemarle’s Kemerton closure, and the more than $4 billion effectively written off with it, is not an aberration caused by temporary market weakness. It is a case study in how midstream chemical assets behave when they are placed in structurally high-cost environments and asked to compete with deeply integrated, large-scale Chinese clusters.

    Fastmarkets’ projection of 15–40% lithium demand growth in 2026, amplified by AI data center storage requirements, confirms that the problem is not lack of customers for lithium hydroxide. The issue is where that hydroxide is most economically produced, and under what energy, reagent, labor, and regulatory regimes. At present, Western efforts have not altered the answer in their favor.

    For Materials Dispatch, Kemerton marks an inflection point in how Western lithium refining projects are evaluated. It underscores that structural cost position, not policy enthusiasm or short‑term price spikes, determines which plants survive a full cycle. Our team is actively tracking weak signals that could shift this equation: changes in Chinese export policies, new Western power-tariff regimes for electro-intensive industries, evolving AI data center storage specifications, and any credible moves toward integrated reagent and energy ecosystems around non-Chinese refineries.

    Note on Materials Dispatch methodology Materials Dispatch integrates continuous monitoring of regulatory texts, such as critical minerals strategies and trade rules, with granular market data from price reporting agencies and company disclosures. That is combined with technical analysis of process routes, energy and reagent intensity, and end-use performance specifications in sectors like EVs and AI data centers, to build a coherent picture of where along the value chain structural risks and advantages actually sit.

  • Missile Propellant Bottleneck: Ammonium Perchlorate and the Pentagon Supply Crunch

    Missile Propellant Bottleneck: Ammonium Perchlorate and the Pentagon Supply Crunch

    **Ammonium perchlorate oxidizer capacity – not warhead manufacturing or guidance electronics – now sets the hard ceiling on Western missile surge production. Pentagon multiyear contracts for fourfold Tomahawk and AMRAAM output run ahead of propellant precursor reality, while Chinese export controls, Utah environmental constraints, and rail bottlenecks converge into a single chokepoint. The U.S. Department of Defense has responded with an unprecedented $1B convertible equity injection into L3Harris Missile Solutions in January 2026, tied to an H2 2026 IPO, effectively turning a propulsion supplier into a quasi-public critical infrastructure platform. This is not a generic “munitions shortfall” story; it is a specific oxidizer, process, and financing constraint that now defines the outer limit of Western missile industrial capacity.**

    The Propellant Bottleneck in Western Missile Production

    In Western missile manufacturing, the loudest debates have focused on launchers, seekers, and guidance electronics. The actual industrial constraint is quieter and far more chemical: solid rocket motor (SRM) propellant, and specifically ammonium perchlorate (AP), now sets the upper bound on how many Tomahawk, THAAD, PAC‑3, and Standard Missiles can be produced in any given year.

    The Pentagon has explicitly identified solid rocket motor propellant production as a severe constraint on munitions surge capacity. This is not a generic “capacity” issue; it is a narrow, materials-and-process bottleneck centered on AP oxidizer output and its precursors, from sodium perchlorate and perchloric acid through to qualified composite propellant batches. When this chain stalls, SRM casings, guidance kits, and warheads queue up unused.

    The institutional response is equally unusual. In January 2026, the U.S. Department of Defense (DoD) executed a $1 billion convertible equity investment into L3Harris Missile Solutions, with an IPO planned for the second half of 2026. That structure breaks with decades of reliance on traditional cost‑plus and fixed‑price contracting, effectively turning missile propulsion capacity into a form of critical infrastructure financed via a hybrid public-private balance sheet.

    Materials Dispatch’s view is straightforward: AP precursor chemistry, environmental permitting, and logistics – not factory headcount or assembly tooling — are now the binding constraints on Western missile surge. The L3Harris convertible is best understood as an industrial resilience instrument aimed at that specific chokepoint, rather than as a financial innovation in search of a problem.

    Ammonium Perchlorate: Chemistry, Production, and Inflexible Demand

    Ammonium perchlorate (NH₄ClO₄) is the dominant oxidizer in composite solid propellants used across Western tactical and strategic missile fleets. In typical hydroxyl‑terminated polybutadiene (HTPB) formulations, AP accounts for the majority of the propellant mass. It provides the oxygen needed to burn the polymer binder and metallic fuel (often aluminum) at the pressure and temperature profile required for high‑thrust, high‑specific‑impulse SRMs.

    AP production follows a multi‑step chemical route:

    • Chlorate/chlorite production: Sodium chlorate or sodium perchlorate is produced by electrolyzing brine solutions. This is an energy‑intensive process requiring specialized cells, corrosion‑resistant materials, and stable electricity supply.
    • Perchloric acid synthesis: Sodium perchlorate is converted into perchloric acid (HClO₄), typically via ion‑exchange or reaction with mineral acids, under strict controls due to the strong oxidizing nature of the acid.
    • Ammonium perchlorate crystallization: Perchloric acid reacts with ammonia to form AP, which is then crystallized, washed, and sized to meet strict particle size distributions and purity specifications for propellant formulations.

    Each stage has distinct infrastructure requirements: electrolysis cells and power access at the front; glass‑lined or specialty‑metal reactors and advanced scrubbers in the middle; and crystallizers, dryers, and milling/classification systems at the back end. These facilities are subject to hazardous chemical regulations, environmental emissions limits, and explosive safety standards, making rapid greenfield build‑out difficult.

    Unlike many other inputs, AP is effectively non‑substitutable for the current generation of high‑performance tactical SRMs. Ammonium nitrate and other oxidizers can support lower‑energy propellants, but they change burn rate, temperature, and impulse to an extent that would force full missile redesign and requalification. For systems such as PAC‑3 or Standard Missile interceptors, that is not a near‑term option without accepting significant performance degradation.

    This is where the bottleneck becomes structural: demand for AP is relatively inelastic at the missile‑design level, while supply expansion runs into chemistry, permitting, and capital constraints simultaneously.

    Program-Level Dependence: Tomahawk, THAAD, PAC‑3, and Standard Missile

    The Pentagon’s concern is not abstract. The core U.S. and allied missile families that underpin both deterrence and day‑to‑day operations are all anchored on AP‑based SRMs, typically with multiple stages and, in some cases, divert and attitude control motors that further increase oxidizer demand.

    • Tomahawk cruise missile: Uses solid propellant for its booster phase, bringing the missile up to speed before the turbofan cruise engine takes over. Any fourfold increase in Tomahawk output, as targeted in recent multiyear procurement plans, translates directly into a proportional increase in SRM propellant demand for boosters.
    • THAAD (Terminal High Altitude Area Defense): Relies on a large single‑stage solid motor to accelerate a hit‑to‑kill interceptor to very high velocities. The motor’s propellant load is substantial, meaning even modest production increases consume significant AP tonnage.
    • PAC‑3 (Patriot Advanced Capability‑3): Uses dual‑pulse motors and additional divert thrusters, all based on composite propellant. Multiyear procurement arrangements aiming at around four times baseline production multiply AP requirements across several motor types per interceptor.
    • Standard Missile family (SM‑2, SM‑3, SM‑6): Incorporates solid boosters and, in some variants, solid second stages. Navy plans for expanded ship‑based air and missile defense capacity are, in practice, AP‑demand expansion plans in disguise.

    In aggregate, these families tie a large share of Western military AP consumption to a relatively small number of propellant producers and precursor facilities. When Pentagon planners talk about “4x Tomahawk and AMRAAM production” under multiyear contracts, those quantities imply AP requirements that move the entire Western oxidizer market. Production targets on paper outstrip the comfortable capacity envelope of existing AP infrastructure.

    The critical point is that AP demand is driven by per‑missile propellant mass and architecture, not by easily compressible overhead. No amount of assembly‑line optimization can compensate for a shortfall in oxidizer throughput; a missing guidance unit stops one missile, but a missing AP batch can stall an entire production lot.

    Where the Supply Chain Fails: Geopolitics, Regulation, Logistics

    Recent data on precursor sourcing and plant operations shows that three reinforcing factors — geopolitical exposure, environmental compliance, and transport frictions — are converging on AP to create a durable bottleneck.

    Geopolitical Exposure in Perchlorate Precursors

    AP production depends on a steady flow of perchlorate and chlorate intermediates. Market analysis indicates that roughly 30-40% of perchloric acid precursors used by Western oxidizer producers trace back to Chinese sodium perchlorate exports. That dependency was tolerable when trade was stable; it becomes a hard risk factor once export policy is weaponized.

    In 2025, China imposed export controls on perchlorate‑related chemicals that broadly mirror earlier restrictions on rare earth elements. While the affected HS codes differ, the logic is similar: prioritize domestic and aligned end‑uses, scrutinize defense‑adjacent flows, and retain policy leverage over competitors’ critical materials. For Western AP producers, this has translated into a potential shortfall on the order of 5,000-7,000 metric tonnes per year of precursors relative to planned missile surge profiles.

    In a market where total Western AP demand is only in the low tens of thousands of tonnes per year, losing several thousand tonnes of precursor capacity is not a marginal inconvenience; it is a systemic constraint that ripples through every missile program tied to solid propulsion.

    Environmental Regulation and Utah’s Oxidizer Hub

    On the domestic side, the main U.S. AP production hub sits in Utah, a state facing increasingly stringent air‑quality oversight. Utah’s designation as a Class I ozone non‑attainment area has direct implications for high‑emissions chemical plants, including oxidizer facilities where chloride‑ and nitrogen‑bearing exhaust streams require advanced treatment.

    Regulatory filings and industry disclosures indicate that Utah AP producers are planning scrubber and emissions‑control upgrades valued in excess of $150 million by the latter half of this decade. During retrofit windows, engineering schedules anticipate that approximately 20% of existing capacity will be idled. Even if upgrades ultimately enable higher throughput, the interim effect is fewer tonnes of qualified AP reaching SRM mixers at exactly the moment missile demand is surging.

    AP plants are not trivial to re‑site. They require specialized safety arcs, water and power access, and transport links for hazardous materials. Environmental reviews, community acceptance, and explosive safety siting constraints turn every greenfield oxidizer project into a multi‑year effort, even before the first reactor vessel is poured.

    Rail-Dependent Logistics and Vulnerable Corridors

    The physical flow from AP crystallizer to missile motor is also fragile. U.S. AP production in Utah feeds propellant mixing and motor assembly plants concentrated in Arkansas, Alabama, and other Southern manufacturing hubs. That path runs overwhelmingly by rail, both for cost and for hazardous materials regulations that restrict long‑haul road movements of oxidizers at relevant volumes.

    Typical lead times from Utah plants to SRM manufacturing centers run in the four‑to‑six week range for standard rail service. Those timings were manageable under peacetime procurement rhythms. Under surge conditions, they introduce a material delay between any change in oxidizer output and tangible relief at missile assembly lines.

    The vulnerability of this corridor was made visible in 2025, when Union Pacific derailments in the western United States delayed approximately 2,000 metric tonnes of critical chemical cargoes, including AP and related materials. Even when no product was lost, cars awaiting rerouting or inspection extended delivery timelines and forced SRM plants to re‑sequence production around missing lots.

    Because AP is both a strong oxidizer and an energetic material, re‑routing via ad hoc channels is rarely an option. Storage buffers mitigate these shocks only partially; a delay of a few thousand tonnes into a tightly scheduled SRM mixing calendar can translate into multi‑month gaps in downstream missile output.

    DPA Title III: Necessary but Not Sufficient for Propellant Capacity

    The U.S. government has not ignored the AP problem. Over several years, the Defense Production Act (DPA) Title III program has issued solicitations aimed at strengthening solid rocket motor and propellant capacity. These have supported plant modernizations, incremental capacity expansions, and in some cases new mixing and casting infrastructure.

    that said, Title III is structurally optimized for marginal improvements and risk‑sharing on specific projects, not for rewiring an entire precursor value chain. Several recurring friction points have emerged:

    • Project size versus cost‑share rules: Greenfield AP or chlorate plants are capital‑intensive. Title III support typically covers only a fraction of total project cost, leaving the remainder to be financed by firms that face commodity‑like pricing and concentrated offtake risk.
    • Permitting timelines: Even when funding is available, environmental reviews and local permitting can run into multi‑year timeframes, particularly for projects involving perchlorates, acids, and other hazardous chemicals.
    • Scope bias: Many solicitations have focused on downstream capacity (propellant mixing, motor case production, casting and cure facilities), assuming precursor supply could be managed through existing channels. The 2025 Chinese export controls and Utah regulatory tightening have shown that assumption to be fragile.

    Title III remains a useful tool, especially for debottlenecking specific stages or co‑funding modernization. But as AP moved from being a manageable risk to a hard constraint, the Pentagon was left with a gap: traditional grants and cost‑share mechanisms have struggled to mobilize the scale and speed of capital required for new precursor and oxidizer capacity.

    The Pentagon–L3Harris $1B Convertible: Structure and Industrial Logic

    Against this backdrop, the January 2026 $1 billion convertible equity investment into L3Harris Missile Solutions represents an explicit attempt to break out of the Title III cage. Instead of adding another layer of project‑by‑project cost‑sharing, the DoD has taken a direct capital stake in a propulsion‑centric business unit, with a clear path to an initial public offering planned for the second half of 2026.

    Public disclosures indicate that the instrument is structured as a convertible equity stake rather than a classic grant or loan. In practice, that means the DoD provides upfront capital in exchange for securities that convert into common equity under defined conditions, such as the planned IPO. The structure aligns several industrial‑base objectives:

    • Speed of capital deployment: Unlike procurement contracts, which release cash against delivered units or milestones, and unlike Title III awards, which often require extensive cost justifications, a large convertible equity infusion can move onto a company’s balance sheet rapidly and be deployed into capex according to an integrated industrial plan.
    • Risk distribution: Facility construction risk, cost overruns, and market risk are borne primarily by the corporate entity and future shareholders, not solely by the DoD. At the same time, the DoD retains leverage through its position as a major customer and convertible holder.
    • Signal to private capital: A government equity stake tied to a missile‑propulsion pure‑play slated for IPO signals that AP and SRM capacity are treated as critical operational infrastructure. That signal is designed to crowd in additional private capital alongside the government’s anchor position.
    • Governance access: Equity, even if structured with limited voting rights, provides more direct visibility into project pipelines, timelines, and risk than arm’s‑length contracts. That matters when AP precursor plants and motor lines become strategic assets in their own right.

    From an industrial resilience perspective, the move effectively reclassifies a portion of the solid propulsion base as a quasi‑public utility. Instead of relying solely on annual appropriations and contract vehicles, the DoD now sits on the cap table of a key SRM actor, with the explicit intent of accelerating oxidizer and motor capacity build‑out ahead of confirmed unit demand.

    It is also notable that the security is convertible, not perpetual common equity. That design allows eventual dilution and exit once the IPO market has absorbed the risk and once AP/SRM capacity has reached targeted levels, preserving flexibility for future policy shifts.

    Execution Constraints: From Equity Infusion to Qualified Propellant

    Injecting $1 billion in January 2026 does not immediately translate into more Tomahawk boosters in 2027. The solid propulsion value chain imposes real timelines between capital, concrete, and qualified propellant.

    • Site selection and permitting: Any new AP or precursor facility driven by the L3Harris Missile Solutions capital will still navigate local zoning, environmental impact assessments, and explosive safety siting. Even with political support, these processes introduce unavoidable lags.
    • Equipment lead times: Electrolysis cells, acid handling systems, crystallizers, and high‑energy milling equipment are specialized and often built to order. Lead times for some critical items can extend well beyond a year, especially when multiple projects compete for the same vendor capacity.
    • Process qualification: Propellant‑grade AP is not a generic commodity. Any new line or plant has to demonstrate consistent purity, particle size distribution, and thermal stability. That entails extended production trials and testing campaigns with SRM integrators before full‑rate supply.
    • Downstream integration: Additional AP volume only translates into missile throughput if propellant mixers, motor casting facilities, and test stands expand in parallel. DPA Title III solicitations have already targeted some of these stages, but they remain coupled to precursor availability.

    This is where the IPO timeline becomes relevant. With an H2 2026 listing planned, L3Harris Missile Solutions is effectively using the DoD’s convertible as bridge capital to fund early design, permitting, and long‑lead equipment commitments, while expecting public‑market proceeds and follow‑on debt to finance later construction phases and downstream integration.

    The critical execution risk is sequencing. If precursor plant projects slip due to permitting or equipment delays, while downstream mixing and motor lines come online on time, the system simply shifts the bottleneck further upstream. Conversely, if AP capacity is ready but shipping and storage constraints lag, oxidizer can accumulate at origin without reducing lead times into SRM plants.

    Scenarios 2026–2030: Surge, Shortfall, and Stockpile Tradeoffs

    Considering AP precursor risks, DPA initiatives, and the L3Harris convertible, three broad industrial scenarios frame the 2026–2030 window.

    1. Managed Surge: Incremental Debottlenecking and Staggered Capacity

    In a managed surge scenario, existing AP facilities in Utah complete environmental upgrades broadly on schedule, with only the anticipated 20% temporary capacity idling. Alternative precursor sources partly backfill the loss of Chinese sodium perchlorate, keeping the net shortfall closer to the lower end of the 5,000–7,000 tonne band.

    The L3Harris Missile Solutions capital programme brings incremental new AP and mixing capacity online toward the end of the decade, while DPA Title III projects deepen redundancy in SRM mixing and casting. Under this trajectory, fourfold missile production targets for Tomahawk and AMRAAM are not fully met, but output steps up substantially relative to the pre‑2022 baseline, with most delay attributable to qualification and logistics rather than absolute chemical scarcity.

    2. Hard Constraint: Regulatory Slippage and Precursor Shock

    A harder‑constraint scenario emerges if environmental permitting for expansions stretches out, local opposition slows new oxidizer projects, or if Chinese export controls tighten further or are mirrored by other precursor‑producing states. Under that pattern, the upper end of the 5,000–7,000 tonne precursor shortfall materializes or is even exceeded.

    In this case, the L3Harris convertible still underwrites critical new infrastructure, but the practical impact shifts into the 2029–2030 window. Missile programmes face binding AP rationing, with program offices trading production slots between fleets. Stockpiles of already‑cast motors become a key tool for buffering shocks, but replenishment cycles lengthen.

    From a technical standpoint, propellant formulators may be forced to explore higher‑risk substitutions or process adjustments to stretch available AP, but any such moves carry qualification and reliability implications that weapon‑system integrators treat with justified caution.

    3. Overbuild and Latent Capacity: Equity Pulls Forward the Curve

    A more optimistic scenario sees the $1 billion convertible acting as a catalyst that overbuilds oxidizer capacity relative to immediate procurement plans. If permitting proceeds smoothly and IPO markets accept L3Harris Missile Solutions at favorable terms, the company and its ecosystem could end the decade with substantial latent AP and SRM capacity.

    In that world, the structural bottleneck might migrate away from oxidizer to other inputs — for example, specific alloys for motor cases or nozzle components, or highly specialized test and inspection equipment. But even in that case, the AP constraint will not have vanished; it will have been displaced by concerted industrial policy and financing, not by organic market dynamics.

    Historical Echoes: From Shuttle Boosters to Today’s Industrial Base

    The present AP bottleneck has historical analogues. During the Space Shuttle era, solid rocket boosters relied on large composite propellant segments that concentrated oxidizer demand in very few facilities. Accidents, quality‑control issues, and local regulatory pressures highlighted how vulnerable a launch system could be to a single propellant line or plant.

    There is also a broader echo in other critical materials episodes, such as earlier depletion scares in hydrazine propellants or the post‑Cold War contraction of nitrate‑based explosives capacity. In each case, military programmes assumed the continued availability of legacy chemical infrastructures long after commercial markets had moved on or consolidated.

    What distinguishes the current AP situation is the combination of three factors rarely seen together:

    • Geopolitical contestation over upstream precursors, including export controls shaped explicitly with defense end‑uses in mind.
    • Domestic environmental tightening in precisely the regions where legacy oxidizer plants are located, forcing costly retrofits and threatening local social licence.
    • Financial innovation in the form of direct government convertible equity, taking the industrial base partly outside the traditional procurement and grant toolkit.

    This combination makes the AP case a template for how other defense‑critical chemicals and materials may play out in coming years: a small number of chokepoints, magnified by geopolitics and regulation, addressed via hybrid public–private capital structures rather than purely contractual remedies.

    Synthesis: What Really Constrains the Next Missile Surge

    For defense industry analysts, propulsion engineers, and munitions‑supply specialists, the core insight is that the limiting factor in Western missile surge capacity is no longer assembly‑line footprint or even warhead manufacturing. It is the ability to source, process, and deliver consistent, qualified batches of ammonium perchlorate and its precursors under tightening regulatory and geopolitical conditions.

    Tomahawk, THAAD, PAC‑3, and Standard Missile programmes are all effectively indexed to AP throughput. Multiyear procurement contracts targeting fourfold production increases represent an intention; AP and precursor capacity determine how much of that intention can translate into fielded hardware, and on what timeline.

    DPA Title III solicitations have played an important role in sustaining this ecosystem, but their design is inherently incremental. The Pentagon’s $1 billion convertible equity stake in L3Harris Missile Solutions, with an H2 2026 IPO in view, signals recognition that the oxidizer bottleneck is a structural industrial‑base issue requiring a different toolset.

    From Materials Dispatch’s perspective, three trade‑offs define the space over the next decade:

    • Speed versus governance: Direct equity accelerates capital deployment but draws the DoD closer to corporate decision‑making and market volatility.
    • Redundancy versus cost: Building surplus AP and SRM capacity enhances resilience but risks under‑utilization in peacetime and political scrutiny over “excess” capability.
    • Environmental compliance versus concentration: Upgrading and expanding legacy plants in regulated jurisdictions trades single‑site risk against the complexity of siting new facilities elsewhere.

    The outcome will depend less on abstract budget levels and more on the execution of specific chemical plants, rail corridors, and qualification programmes. Materials Dispatch is actively monitoring weak signals across these domains — from precursor export‑control notices and Utah air‑quality rulemakings to Title III solicitation language and L3Harris Missile Solutions’ pre‑IPO disclosures — because those are the levers that will ultimately determine how many missiles Western arsenals can credibly field under surge conditions.

    Note on Materials Dispatch methodology Materials Dispatch combines close reading of official industrial‑base reports, export‑control filings, and DPA Title III documentation with tracking of corporate disclosures from firms such as L3Harris, as well as technical specifications for missile propulsion systems. This triangulation between policy texts, market data, and end‑use engineering requirements underpins the assessment of where bottlenecks are truly emerging in AP and solid rocket motor supply chains.

  • India Rare Earth Reserves: Massive Potential, Decades Behind Processing

    India Rare Earth Reserves: Massive Potential, Decades Behind Processing

    India sits on some of the world’s most substantial rare earth reserves and yet contributes only a sliver of global production. For Materials Dispatch, this gap is not an academic curiosity; it is a concrete supply-chain risk. Over the past decade, every serious rare earth disruption-Chinese export curbs, Myanmar instability, opaque licensing changes-has translated into hard procurement problems for downstream users in magnets, motors, catalysts, and defense systems. Internal sourcing cycles have repeatedly run into the same roadblock: India appears on paper as a “sleeping giant” in rare earth geology, but on the ground it behaves like a marginal supplier.

    The 2025-2026 policy pivot in India, centered on monazite-based value chains and new manufacturing schemes, is the first credible attempt to close that gap. It deserves close, critical scrutiny because it has the potential to change sourcing options for magnets and refined oxides, while also introducing new regulatory and operational complexities around nuclear-linked minerals, coastal mining, and state-backed monopolies.

    • Change: India is moving from raw monazite extraction towards an integrated rare earth value chain, anchored by a new permanent magnet manufacturing scheme and planned rare earth corridors.
    • Scope: The focus is on monazite-based reserves, downstream processing, and rare earth permanent magnets, under a regime still dominated by state-owned IREL and atomic energy regulators.
    • What is covered: Geological endowment, institutional/regulatory framework, and headline policy measures (scheme outlays, capacity targets, corridor concepts).
    • What is not covered: Precise project-by-project economics, detailed pricing outcomes, and definitive timelines for all corridor elements, which remain either unpublished or fluid.
    • Operational angle: To the extent that these measures are executed, they could partially diversify supply away from China’s refining dominance, but only after navigating thorium regulations, community resistance to beach mining, and the constraints of a de facto monopoly.

    FACTS: Resource Base, Institutional Setting, and New Policies

    India’s rare earth reserves and monazite dominance

    According to public geological reporting and international comparisons, India holds the world’s third-largest rare earth oxide (REO) reserves at around 6.9 million tonnes. Annual rare earth production, however, has been estimated at only about 2,900 tonnes in 2024, which corresponds to less than 1% of global output. The contrast between reserves and production is the core structural fact behind the “sleeping giant” label widely applied to India in this sector.

    Unlike many other producing regions where bastnäsite or hard-rock deposits dominate, India’s rare earth endowment is heavily concentrated in monazite-bearing beach and inland placer sands along the coasts of states such as Andhra Pradesh, Kerala, Odisha, and Tamil Nadu, with additional occurrences in Gujarat, Maharashtra, Jharkhand, and West Bengal. Monazite typically contains both light rare earth elements and thorium, which brings the sector under India’s atomic energy and radiation safety framework.

    Exploration and resource estimation for these deposits fall primarily under the Atomic Minerals Directorate for Exploration and Research (AMD) and the Geological Survey of India (GSI), which have progressively upgraded estimates for total monazite-bearing sands and associated REO content. Public figures cited in recent years point to monazite reserves in the tens of millions of tonnes, with rare earth oxide content measured in several million tonnes, consistent with India’s ranking as third globally by reserves.

    Institutional and regulatory structure: IREL, DAE, and AERB

    Monazite and several related minerals are classified as atomic minerals in India. This classification places their mining, processing, and handling under the purview of the Department of Atomic Energy (DAE) and associated regulators, most notably the Atomic Energy Regulatory Board (AERB).

    The central industrial actor is Indian Rare Earths Limited (IREL), a DAE-owned entity that historically has held an effective monopoly over monazite processing and rare earth extraction. IREL operates facilities in coastal locations such as Odisha and Kerala, and has been involved in joint ventures, including with Japan’s Toyota Tsusho at Visakhapatnam, to process certain rare earth streams. Despite this footprint, total rare earth production remains modest relative to India’s geological potential.

    Regulatory oversight by AERB focuses on radiation protection, safe handling of thorium-bearing materials, and management of radioactive tailings. Environmental approvals, coastal zone regulations, and community consent processes add further layers of scrutiny, especially for beach sand mining projects that have attracted local opposition and political attention in several states.

    Strategic framing: Atmanirbhar Bharat and Net Zero 2070

    Rare earths have been explicitly linked in Indian policy discourse to the twin agendas of Atmanirbhar Bharat (self-reliant India) and the country’s declared Net Zero 2070 target. The logic is straightforward: rare earth permanent magnets and related materials are embedded in electric vehicles, wind turbines, advanced electronics, and defense platforms that are central to both decarbonization and strategic autonomy.

    In parallel, global developments have heightened the salience of rare earth security. China is estimated to control around 90% of global rare earth refining capacity, even as demand from EVs, renewables, and electronics continues to rise. Export controls, licensing changes, and geopolitical tensions have periodically disrupted flows, while policy frameworks such as the US Inflation Reduction Act and the EU Critical Raw Materials Act have explicitly sought diversification away from single-country dominance.

    Map showing proposed rare-earth corridors and major monazite deposit clusters in India.
    Map showing proposed rare-earth corridors and major monazite deposit clusters in India.

    Against this backdrop, India’s combination of substantial reserves and minimal production has increasingly been treated in official and industry narratives as a glaring vulnerability and a missed strategic lever.

    REPM manufacturing scheme: outlay and capacity targets

    In late 2025, the Indian government approved a dedicated Scheme to Promote Manufacturing of Sintered Rare Earth Permanent Magnets (REPM), under the Ministry of Heavy Industries. Public communications describe an outlay of approximately ₹7,280 crore and a target to support up to 6,000 tonnes per year of integrated permanent magnet manufacturing capacity.

    Key structural features of the scheme, as described in government and media summaries, include:

    • A focus on integrated projects spanning from rare earth oxide input through to finished sintered magnets.
    • Selection of up to five beneficiary entities, with individual caps intended to avoid concentration in a single player.
    • Incentive support linked to establishing domestic capability in magnet manufacturing, with an emphasis on applications in EVs, renewable energy, and defense.
    • Compatibility with India’s wider industrial policy framework, including localization, technology transfer, and employment objectives.

    Detailed operational guidelines, including exact eligibility criteria, incentive structures, and phasing, have been partially outlined but remain subject to implementation rules and subsequent clarifications.

    Emerging plan for rare earth corridors

    Budget and policy announcements in the 2026 timeframe have also trailed the concept of dedicated rare earth corridors, with geographic focus on coastal states where monazite-bearing sands are concentrated. These corridors are positioned as integrated ecosystems that would link:

    • Mining and beneficiation of monazite and associated heavy minerals.
    • Intermediate processing to mixed rare earth compounds and oxides.
    • Separation and refining steps for individual rare earth elements.
    • Downstream applications such as permanent magnets and other advanced materials.

    The corridor model is intended to combine infrastructure development, streamlined clearances, and co-location of suppliers and users. Operational details-such as specific sites, timelines for commissioning, and the balance between public and private participation—have been signaled but not comprehensively published in a single binding document.

    INTERPRETATION: From Geological Promise to Operational Reality

    Why India lags: structure, regulation, and incentives

    From a supply-chain practitioner’s standpoint, India’s rare earth lag is not mysterious. It is the predictable outcome of an institutional design that treats monazite primarily as a nuclear-adjacent material rather than as the backbone of a competitive industrial value chain.

    Value-chain diagram from monazite mining to finished sintered rare-earth permanent magnets.
    Value-chain diagram from monazite mining to finished sintered rare-earth permanent magnets.

    To the extent that IREL retains a de facto monopoly and operates under nuclear-sector governance, the incentive structure tends to prioritize compliance, control, and thorium stewardship over agility, scale, and downstream customer engagement. That conservatism has clear safety and non-proliferation benefits, but in practice it has translated into:

    • Limited throughput relative to reserves, with several deposits remaining underexploited or idle.
    • Slow movement into high-purity separation and advanced magnet manufacturing.
    • Reliance on exports of intermediate materials or concentrates, rather than capturing the full value chain domestically.

    On top of that, the beach sand mining context is politically sensitive. Environmental concerns, coastal erosion, and community resistance have led to periodic suspensions, investigations, and policy reversals in multiple states. For downstream users that Materials Dispatch has engaged with, that pattern has made Indian-origin rare earth feedstocks look administratively fragile compared with more conventional hard-rock sources elsewhere.

    Does the REPM scheme change the game?

    The REPM manufacturing scheme is the first serious attempt to push India beyond raw material extraction into magnet-level industrial capabilities. The size of the outlay and the explicit 6,000 tonnes per year capacity target indicate that the government is no longer content with a marginal role in the magnet supply chain.

    If the scheme is implemented as described, several implications follow:

    • For domestic OEMs in automotive, renewables, and defense, there is a pathway—over time—to source at least part of their rare earth permanent magnet needs from within India, reducing exposure to external refining and magnet supply disruptions.
    • For global supply chains, India becomes a potential secondary pole, especially for applications seeking to avoid magnets produced in China while still managing cost and logistics constraints.
    • For IREL and other state-linked entities, there is pressure to evolve from a primarily mining-and-basic-processing posture to more customer-facing, performance-sensitive business models.

    The critical caveat is that successful magnet manufacturing depends not only on capital and policy support but also on consistent access to separated rare earth oxides, reliable process know-how, and sustained quality control. India’s track record in high-purity separation at scale is limited. Without robust technology partnerships and process learning, the risk is a set of partially utilized plants that remain dependent on imported oxides, which would blunt the scheme’s geopolitical and supply-security ambitions.

    Rare earth corridors: integration or new bottleneck?

    The proposed rare earth corridors are conceptually attractive. Co-locating mining, separation, and manufacturing has repeatedly proven its value in other jurisdictions: reduced logistics friction, easier coordination between stages, and a clearer regulatory perimeter. In India’s case, the corridor model could also provide a vehicle to reconcile atomic energy oversight with industrial policy goals, through dedicated project structures and standardized approval pathways.

    However, several execution risks are visible from past experience with industrial corridors and coastal projects:

    • Land and community issues: Beach and coastal deposits intersect with dense populations and environmentally sensitive zones. If corridor planning treats these as purely technical siting decisions, resistance and litigation could delay or derail projects.
    • Regulatory layering: Even with corridor-level facilitation, projects will need to navigate atomic energy, radiation safety, environmental, coastal zone, and state-level industrial approvals. Without genuine streamlining, corridors can simply aggregate bottlenecks.
    • Governance of joint ventures: To attract global magnet and materials specialists, corridor projects will likely rely on JVs. The balance of control between state entities like IREL and private or foreign partners will shape both performance and risk perception.

    If these issues are handled pragmatically, corridors could accelerate India’s transition from reserves holder to meaningful player in refining and magnets. If not, they risk becoming another layer of planning rhetoric that leaves India fundamentally dependent on imported magnets and separated oxides.

    Illustration of a monazite processing and thorium containment facility on a coastal site.
    Illustration of a monazite processing and thorium containment facility on a coastal site.

    Geopolitics and friendshoring: India’s window of relevance

    Global rare earth supply chains are increasingly shaped by friendshoring logics rather than pure cost optimization. For defense-linked and high-performance applications in particular, the combination of China’s refining dominance and rising geopolitical tension has pushed policymakers and OEMs to search for alternative anchor countries.

    India’s rare earth vector intersects with this in three ways:

    • Quad and allied frameworks: Partnerships with Japan, the US, and Australia have already produced joint ventures and technical cooperation around critical minerals. Successful corridors and REPM plants could be natural candidates for expansion of these arrangements.
    • Compliance with Western industrial policies: To the extent that India demonstrates transparent, traceable, and environmentally compliant rare earth supply, its materials may fit within rules that distinguish “trusted” supply from others, particularly in EV and defense supply chains.
    • Signaling effect: A visible ramp-up in India’s rare earth production and magnet output, even from a low base, changes the bargaining landscape. It provides a counterweight in discussions about supply security, even if absolute volumes remain modest relative to China.

    The flip side is that unrealized promises carry their own cost. India has already spent years being cited in strategy decks as a potential alternative that rarely materializes in procurement contracts. If the current wave of schemes and corridors underdelivers, future claims about Indian rare earth capacity will likely be discounted more aggressively by global offtakers and policymakers.

    Downstream sectors: EVs, wind, and defense under pressure

    From the vantage point of OEMs and tier-1 suppliers in India and allied markets, the operational question is simple: can Indian rare earth projects become reliable, specification-compliant, and politically acceptable sources of magnets and oxides within realistic planning horizons?

    EV manufacturers, wind turbine producers, and defense contractors have already had to cope with supply shocks and policy-driven sourcing constraints. In internal reviews that Materials Dispatch has been involved with, many such entities treat India more as a future option than a present pillar in their rare earth sourcing strategies. The REPM scheme and corridors, if executed with credible partners and stable regulation, could over time shift that perception.

    However, until concrete plants are built, ramped, and proven over several years of consistent output, India’s role will remain largely prospective. The harsh lesson from past disruptions is that paper reserves and policy announcements do not move the needle in procurement risk models until they translate into dependable shipments that meet tight technical and compliance specifications.

    WHAT TO WATCH: Signals That Will Confirm or Contradict the Pivot

    • Final REPM scheme guidelines and award outcomes: Publication of detailed rules, selection of beneficiaries, and clarity on how integrated the awarded projects really are (from ores/oxides to magnets).
    • Concrete announcements on rare earth corridors: Identification of specific sites, SPV structures, and timelines, plus evidence of coordinated infrastructure and regulatory facilitation rather than purely declarative zoning.
    • Regulatory evolution around monazite and thorium: Any amendments, clarifications, or new guidelines from DAE and AERB that affect how monazite mining, processing, and tailings are managed in an industrial, not purely nuclear, frame.
    • Role and behavior of IREL: Whether IREL remains the sole operational gatekeeper, moves into more partnership-based models, or sees partial opening of the value chain to other qualified entities under regulatory oversight.
    • Joint ventures and technology partnerships: New or expanded collaborations with foreign magnet producers, separation technology suppliers, or end-use OEMs that bring in process expertise and credible offtake anchors.
    • Environmental and community responses: Local resistance, litigation, or, conversely, examples of negotiated agreements around coastal and inland projects that signal a stable social license to operate.
    • Export and import statistics: Shifts in India’s rare earth oxide and magnet trade flows over the next several years, indicating whether domestic capacity is genuinely displacing imports or is primarily re-exporting intermediate materials.

    Conclusion

    India’s rare earth sector is finally moving from rhetorical asset to policy target. The combination of large monazite-based reserves, a state-backed incumbent in IREL, and new schemes for magnet manufacturing and corridors creates a framework that could, if executed, alter the geography of rare earth refining and magnet supply over the next decade. At the same time, the very features that have held India back—atomic mineral regulation, environmental sensitivity of beach sands, and state-heavy governance—have not disappeared.

    Material progress will be measured not in press releases but in commissioned plants, consistent throughput, and verifiable compliance with both radiation safety and environmental standards. For now, India remains simultaneously a major geological holder of rare earths and a minor industrial player. Materials Dispatch will continue active monitoring of regulatory and industrial weak signals that will determine whether India’s rare earth ambition resolves into durable supply-chain reality.

    Note on Materials Dispatch methodology Materials Dispatch integrates continuous monitoring of official releases from entities such as the Ministry of Heavy Industries, DAE, AERB, and geological agencies with structured tracking of market behavior in relevant end-use sectors. This is combined with close reading of technical specifications in magnets, motors, alloys, and catalysts to assess whether emerging projects align with real-world performance and compliance requirements across strategic and critical materials.

  • China’s Rare Earth Dominance: It’s Not the Reserves, It’s the Processing

    China’s Rare Earth Dominance: It’s Not the Reserves, It’s the Processing

    **China’s rare earth power rests far more on midstream chemistry than on geology. With roughly two‑thirds of global mining and close to 90% of refining and separation capacity, China has converted significant-but not unique-rare earth reserves into a systemic choke point from ore to magnet. Export controls, licensing, and industrial policy convert this technical lead into strategic leverage over EVs, wind, defense, and electronics supply chains. Replicating reserves outside China without replicating processing infrastructure leaves the underlying dependency largely intact.**

    China’s Rare Earth Dominance: The Operational Question Behind the Headlines

    China’s position in rare earth elements (REE) often appears, at first glance, to be a story about geology. Headlines emphasize China rare earth reserves and large-scale deposits like Bayan Obo. Yet the operational reality is different. Control is anchored less in the rock and far more in the chemical plants, solvent extraction circuits, and magnet factories that surround those deposits.

    International data from bodies such as the USGS and the IEA indicate that China accounts for a significant share of global rare earth mining and an even higher share of processing. Mining shares are generally estimated at well above half of global output, while processing shares have been repeatedly assessed near, and in some cases above, 85-90% of global refining and separation capacity. That asymmetry is the core of China’s rare earth dominance.

    For operators dependent on rare earth permanent magnets, polishing powders, catalysts, or specialty alloys, this translates into a structural question: how does a supply chain function when one jurisdiction effectively hosts almost all midstream processing capacity? The answer is not purely geological or financial. It is deeply tied to chemical engineering capability, environmental tolerances, and deliberate policy choices that convert processing strength into leverage over china rare earth exports.

    Reserves vs. Processing: Why Geology Does Not Equal Control

    China holds a substantial portion of known global rare earth reserves, but the distribution is far from exclusive. USGS assessments in recent years have typically placed China’s share of identified reserves at roughly one‑third to a bit more of global totals, with large endowments also identified in the United States, Australia, Russia, Brazil, Vietnam, and several African states. In other words, China rare earth reserves are significant, but not uniquely dominant in absolute geological terms.

    China rare earth reserves: Bayan Obo and beyond

    The core of the Chinese reserve base lies in a handful of very large deposits anchored by Inner Mongolia’s Bayan Obo, one of the world’s largest known rare earth deposits. Bayan Obo hosts bastnäsite and monazite mineralization rich in light rare earth elements (LREE) such as neodymium, praseodymium, lanthanum, and cerium, alongside iron and niobium. This multi-commodity nature enables cost sharing across product streams but also complicates waste management and processing flows.

    Beyond Bayan Obo, southern ionic clay deposits in provinces such as Jiangxi and Guangdong are especially important for heavy rare earth elements (HREE) like dysprosium, terbium, and yttrium. These clays can often be leached in situ or via relatively low‑grade mining methods, reducing blasting and crushing requirements but creating diffuse, large‑surface‑area environmental footprints. Additional hard-rock deposits in Sichuan and Shandong round out the china rare earth reserves picture across both LREE and HREE domains.

    By themselves, these reserves do not explain China’s grip on the market. Comparable-grade rare earth-bearing deposits are being advanced in Australia, North America, and parts of Africa. The critical distinction lies in what happens after ore leaves the pit: beneficiation, cracking, separation, and finishing.

    Why reserves alone do not confer supply chain power

    Rare earth ores rarely exceed a few percent REO (rare earth oxide) content, and often fall closer to the low single-digit range. Once mined, ore requires grinding, flotation, or gravity separation to produce a concentrate. From there, it must be “cracked” chemically and then processed through long chains of solvent extraction or ion exchange stages to separate individual elements. This midstream phase is capital-intensive, chemically complex, and environmentally demanding.

    Other jurisdictions can host the same minerals in the ground, but without a mature processing ecosystem-hundreds of mixer-settlers, reliable reagent supply, engineering teams familiar with multi-stage SX (solvent extraction) control, and regulatory regimes willing to tolerate waste streams—the ore remains trapped in an upstream bottleneck. Reserves become stranded assets rather than market power.

    That is the critical structural insight: China’s rare earth power is built less on geology than on decades of unglamorous chemical engineering and a policy decision to internalize the environmental and social cost of that midstream processing.

    China Rare Earth Processing: Chemistry as the True Chokepoint

    Processing is where the china rare earth story becomes a systemic choke point. Multiple independent analyses, including from the IEA, have highlighted that China handles a dominant share of global rare earth refining and separation—often assessed at close to 90% of separated oxide production. This dominance is not a single plant or company; it is a dense network of facilities organized into regional clusters.

    From ore to separated oxides: process architecture

    At a high level, the rare earth processing chain within China follows a multi-step pathway:

    • Beneficiation: Crushed ore from deposits such as Bayan Obo passes through grinding mills and flotation circuits to upgrade REE content into concentrates, often from low single-digit grades to substantially higher percentages suitable for chemical treatment.
    • Chemical cracking: Concentrates are digested using acid (e.g., sulfuric or hydrochloric) or alkaline processes (e.g., sodium hydroxide), depending on mineralogy. This dissolves rare earth elements into solution and leaves a residue that can contain radioactive thorium and uranium, as well as other metals.
    • Solvent extraction (SX) and ion exchange: The mixed rare earth solution is fed through long trains of mixer-settlers or extraction columns. Dozens, sometimes hundreds, of stages are required to progressively separate elements that are chemically very similar. Slight differences in ionic radius and complexation behavior are exploited through carefully tuned extractants, pH, and phase ratios.
    • Oxide precipitation and calcination: Individual or grouped elements are precipitated (often as carbonates or oxalates) and then calcined to produce high-purity rare earth oxides.
    • Metals, alloys, and magnets: For downstream applications, oxides are reduced (for example by molten salt electrolysis or metallothermic processes) to metals, which are then alloyed and processed into materials such as NdFeB or SmCo permanent magnets, polishing powders, or catalyst formulations.

    In each of these steps, China’s processing clusters have optimized throughput, reagent sourcing, and waste handling over multiple decades. Plants in Inner Mongolia, Sichuan, Jiangxi, and elsewhere operate at throughputs measured in tens of thousands of tonnes of REO-equivalent per year, with highly standardized process configurations.

    Solvent extraction density and tacit know-how

    Solvent extraction is the heart of China rare earth processing. The technology itself is not proprietary; mixer-settler units and extraction reagents are available globally. What is difficult to replicate is the combination of:

    • Plant-level integration of hundreds of stages configured for specific feed chemistries.
    • Operational expertise in maintaining phase continuity, preventing crud formation, and managing degradation of organic phases over long campaigns.
    • Process control systems tuned for subtle shifts in ore composition that impact equilibrium behavior.
    • Waste and raffinate management that keeps production within regulatory limits while controlling costs.

    This tacit knowledge, built up across state-owned enterprises and private processors, is a major barrier to rapid replication elsewhere. It is common in Chinese complexes for ore mined by one entity to be processed by another and then converted into magnets or alloys by a third, all within a single industrial park. These shared clusters allow specialization while keeping logistics distances short.

    Every tonne of NdFeB magnets leaving China embodies thousands of discrete solvent extraction equilibria that hardly any other jurisdiction has replicated at comparable scale. That reality anchors China’s grip on separated oxides and finished rare earth products, far more than the tonnage of ore in its pits.

    Vertical integration into magnets and advanced materials

    China’s processing lead extends into the downstream magnet and materials segment. Multiple industry assessments indicate that Chinese producers account for a very large majority—often cited in the 80-90% range—of sintered NdFeB magnet production globally. This includes both commodity-grade magnets for small motors and high-performance grades for EV traction motors, wind turbine generators, robotics, and defense applications.

    Key rare earth metals and alloys, including neodymium, praseodymium, dysprosium, and terbium-based compositions, are produced at scale by integrated groups that control everything from concentrate imports to magnet machining. This creates a mine-to-magnet ecosystem where internal coordination reduces lead times, compresses margins between stages, and allows rapid response to policy shifts such as export licensing or quota changes.

    Global map showing concentration of rare-earth processing in China vs mining locations worldwide (no text).
    Global map showing concentration of rare-earth processing in China vs mining locations worldwide (no text).

    The net effect is stark. Ore mined in other jurisdictions—including concentrates from operations in the United States or Australia—often flows back into this Chinese midstream for separation and magnet production. Attempts to diversify mining supply without building equivalent processing capacity so risk recreating the same structural dependency, simply with more international shipping legs in between.

    China Rare Earth Exports and Policy: From Quotas to Strategic Leverage

    The interplay between china rare earth processing dominance and china rare earth exports policy has been evident for more than a decade. Rare earths have moved from being treated as a niche industrial commodity to being explicitly framed as a strategic resource in Chinese planning documents.

    From the 2010 quota shock to 2020s dual-use framing

    In 2010, export quotas and customs enforcement actions reduced shipments of rare earth products—most visibly to Japan—triggering price spikes and supply anxieties in downstream industries. This episode pushed rare earths onto defense and industrial policy agendas across OECD economies. Subsequent World Trade Organization rulings led China to formally remove some explicit export quotas around 2015, but the underlying lesson persisted on all sides: control of processing capacity is a latent policy instrument.

    During the 2020s, Beijing increasingly integrated rare earths into a broader “dual circulation” and national security narrative. While formal export quotas became less prominent, other policy tools emerged, including:

    • Consolidation of producers into a smaller number of state-guided groups, making coordination easier.
    • Stricter environmental inspections that could selectively constrain output.
    • Value-added tax adjustments and rebate policies that favor higher-value downstream exports (such as magnets) over raw oxides.
    • Licensing and disclosure requirements geared toward tracking end-use sectors, especially where defense applications are involved.

    Parallel actions on other critical materials—such as export controls applied to gallium, germanium, and graphite in 2023—demonstrated that Beijing was prepared to use licensing regimes and documentation requirements as tools of statecraft. Market participants increasingly treated rare earths as being on a similar trajectory, even where formal measures lagged behind rhetoric.

    Licensing regimes and heavy rare earth leverage

    Analysts tracking MOFCOM notices, industrial plans, and press reports describe a policy trend toward categorizing certain rare earth products as “dual-use” or otherwise sensitive. In such a framework, heavy rare earth elements (HREE) used in high-temperature magnets—dysprosium and terbium in particular—are natural candidates for tighter oversight. The market view reflected in 2025-2030 scenario work is that licensing or enhanced due diligence for these exports would be consistent with prior patterns in other strategic materials.

    Under such scenarios, china rare earth exports would not stop; rather, they would become more selectively available. Long-term offtake contracts, alignment with Chinese downstream joint ventures, and participation in Belt and Road-related industrial projects might see preferential treatment, while shipments into competing defense ecosystems could face greater friction. This would not necessarily appear as a single headline ban, but as a layered combination of paperwork, quota windows, and compliance ambiguity.

    From an operational risk standpoint, the critical point is that policy risk in rare earths is concentrated in the midstream where China’s processing dominance is greatest. Export controls on ore concentrate or upstream mining would matter less globally than targeted friction at the separated oxide, alloy, or magnet level, where alternative suppliers are rare.

    Sectoral Exposure: Where the Chokepoints Are Most Acute

    Not all sectors are equally exposed to china rare earth processing and export risks. The degree of exposure depends on which elements are required, in what purity, and whether design alternatives exist.

    EVs and wind: NdPr magnets at the center

    Electric vehicles and modern wind turbines have become emblematic downstream users of rare earth permanent magnets. Traction motors in many EV designs use high-coercivity NdFeB magnets based on neodymium and praseodymium (NdPr), sometimes with dysprosium additions for high-temperature stability. Direct-drive wind turbines use similar magnet systems in much larger volumes per unit.

    Multiple demand studies project that NdPr requirements for EVs and wind could drive total rare earth oxide demand to multiples of current levels by the mid-2030s. In this context, dependence on China for separated NdPr oxide, metal, and magnets becomes a central operational vulnerability. Alternative motor designs—induction motors, switched reluctance machines, or ferrite-based systems—can reduce or avoid rare earth use, but typically at the cost of efficiency, weight, or performance envelope.

    Midstream separation/refining facility interior illustrating solvent extraction operations.
    Midstream separation/refining facility interior illustrating solvent extraction operations.

    China’s ability to price and allocate NdPr magnets, rather than merely ore, is therefore deeply consequential. Contract disputes, export licensing delays, or sudden environmental inspections at magnet plants can translate directly into missed EV or turbine delivery schedules in distant markets.

    Defense and aerospace: heavy rare earths as irreplaceable inputs

    Defense and aerospace applications typically require the most demanding magnet grades—high coercivity, thermal stability, and radiation resistance. Achieving these properties often depends on heavy rare earth additions, especially dysprosium and terbium, to grain boundaries in NdFeB or related magnet systems. HREE availability is far more constrained globally than LREE such as cerium or lanthanum.

    China’s ionic clay deposits and associated processing plants represent the primary large-scale source of these heavy rare earths. Reserves exist elsewhere, but many are not yet in production or lack processing facilities capable of cost-effective, environmentally compliant separation at scale. As a result, the defense sector in multiple countries has historically relied, directly or indirectly, on materials that originated from Chinese HREE processing.

    Substituting away from dysprosium and terbium in high-end magnets is technically possible in some designs through grain boundary engineering, nanostructuring, or alternative magnetic materials, but these approaches are not yet universally mature or qualified across all mission-critical platforms. In this segment, even modest disruptions in china rare earth exports of HREE-bearing products can have disproportionate impact.

    Electronics, catalysts, and polishing: diffuse but inescapable

    Consumer electronics, petrochemical catalysts, and glass polishing compounds rely heavily on cerium, lanthanum, and other rare earths that are more abundant than NdPr or HREE, but still highly concentrated in the Chinese processing system. Cerium oxide polishing powders for semiconductor wafers and optical glass, for instance, largely originate from Chinese plants even when final polishing occurs elsewhere.

    In these applications, impacts from china rare earth processing constraints are often less visible but still material. A tightening in exports of certain grades can delay production of high-end lenses, semiconductor substrates, or catalytic converters. Because these uses are often embedded further up the supply chain, disruptions may be recognized only when finished component deliveries slip.

    Unlike with magnets, design substitution options are more varied in some of these segments, but qualification cycles are long and performance tradeoffs significant. As a result, industrial operators frequently accept a degree of dependency on the Chinese midstream while searching for ways to diversify incrementally.

    Barriers to Replicating China’s Processing Ecosystem

    There is broad recognition among governments and industrial actors that reducing dependence on china rare earth processing is strategically desirable for supply chain resilience. However, practical efforts to build competing midstream capacity face a cluster of reinforcing constraints.

    Environmental and permitting headwinds

    Rare earth processing generates several challenging waste streams: radioactive residues from thorium- and uranium-bearing minerals; large volumes of acidic or alkaline liquors; and solvent extraction organics that require careful handling. China’s early-stage development of this industry occurred under comparatively lenient environmental regimes, allowing plants to scale with limited opposition. Over time, regulations have tightened domestically, but legacy facilities and established industrial zones provide a degree of continuity.

    Outside China, new processing plants encounter far stricter permitting environments from the outset. Environmental impact assessments scrutinize tailings storage, water use, and potential radiation pathways. Local opposition can delay or halt projects, especially where prior industrial contamination has created distrust. These dynamics do not make such plants impossible, but they extend timelines and increase capital intensity.

    As a result, several high-profile rare earth projects have either been forced to export concentrates to China for processing or to consider siting chemical plants in jurisdictions with more accommodating regulatory frameworks, even if ore is mined elsewhere. This underscores the gap between securing mining licenses and closing the loop on fully integrated non-Chinese supply.

    Technical workforce, IP, and tacit process knowledge

    Engineering teams capable of designing, commissioning, and optimizing multi-thousand-tonne-per-year SX and ion exchange plants for rare earth separation are not widely available. China’s domestic universities, research institutes, and state-owned enterprises have trained multiple generations of such specialists. By contrast, much of this expertise in other countries atrophied when rare earth processing shifted to China in the 1990s and 2000s.

    Process intellectual property is often not limited to patents. It lives in control logic, standard operating procedures, troubleshooters’ notebooks, and informal knowledge networks among plant operators. Reconstituting this ecosystem elsewhere involves more than importing equipment; it demands long-term investment in people and iterative learning cycles, often under tighter environmental and financial scrutiny than earlier Chinese plants faced.

    Magnet production close-up showing sintered NdFeB magnets and manufacturing steps.
    Magnet production close-up showing sintered NdFeB magnets and manufacturing steps.

    This is one reason why projects that plan to move from ore to separated oxides in a short timeframe frequently encounter delays or restructuring. Engineering, procurement, and construction (EPC) contractors with strong generic chemical plant experience still need rare earth-specific partners to navigate the subtleties of SX design for LREE versus HREE streams, impurity control, and product spec alignment with downstream users.

    Logistics, clustering, and scale economics

    China’s rare earth industrial base benefits from geographic clustering. In Inner Mongolia, for example, mining at Bayan Obo links directly to beneficiation plants, cracking units, SX lines, and alloy or magnet fabrication within a relatively compact area. The same pattern is evident in southern provinces where ionic clays are leached and processed near regional SX hubs.

    This clustering reduces logistics costs, shortens feedback loops between processing stages, and allows shared infrastructure for reagents, waste treatment, and energy. In contrast, many diversification concepts outside China envision separated facilities: mines in remote regions, chemical plants near ports, and magnet production clusters close to end-use industries. Such spatial separation introduces additional transport costs and interfaces, each of which can become a failure mode under stress.

    Attempts to diversify supply without replicating midstream processing density tend to reproduce dependency in a different form: ore flows change direction, but separation bottlenecks do not. This is the central scale-economics challenge confronting rare earth policy in the United States, Europe, and allied jurisdictions.

    2026–2030 Scenarios: Structural Features That Are Unlikely to Change Quickly

    Scenario work undertaken by industry groups, research institutes, and governments for the 2026–2030 period tends to converge on a few structural features, even if specific numbers and timelines differ.

    First, most projections anticipate China retaining the majority of global rare earth processing capacity through at least the early 2030s, even under aggressive diversification strategies. New plants in Australia, North America, and elsewhere can reduce the share of global separation happening in China, but replicating multiple decades of cumulative investment within a single planning cycle is improbable.

    Second, heavy rare earths are consistently identified as the most persistent bottleneck. Even as projects targeting light rare earths (particularly NdPr) advance outside China, HREE-bearing ionic clay deposits remain heavily concentrated in southern China, and alternatives are earlier in the development curve. This keeps defense, aerospace, and high-end magnet segments particularly exposed to shifts in china rare earth exports policy.

    Third, export control risk is increasingly seen as multi-layered. Rather than sudden, all-encompassing bans, the more likely pattern involves incremental measures—enhanced licensing for sensitive end-uses, periodic tightening framed as environmental campaigns, and targeted tax or rebate adjustments. Industrial operators therefore face a regime of chronic friction and episodic disruption rather than a single defining crisis.

    Finally, recycling appears in most scenarios as a growing, but not near-term dominant, source of supply. End-of-life magnets from wind turbines, EVs, and industrial motors will gradually provide a secondary stream of material, and a number of Chinese and non-Chinese entities are piloting hydrometallurgical and pyrometallurgical recycling processes. However, given the rapid growth in primary demand, recycling is unlikely to eliminate the need for newly mined and processed material during the 2026–2030 window.

    Note on Materials Dispatch methodology Materials Dispatch integrates policy documents (such as Chinese five-year plans and MOFCOM notices), technical literature on rare earth processing, and market data from agencies including the USGS, IEA, and trade statistics on china rare earth exports. This cross-referencing with end-use performance requirements in EVs, wind, defense, and electronics enables an assessment focused on operational feasibility and systemic risk, rather than headline volumes alone.

    Conclusion: Trade-offs, Constraints, and Signals to Watch

    The core reality of the rare earth sector is that China’s dominance is structurally rooted in processing capacity, not only in reserves. Significant china rare earth reserves underpin this position, but it is the dense mesh of beneficiation plants, cracking units, solvent extraction lines, alloy foundries, and magnet factories that converts geological endowment into strategic leverage.

    Efforts to diversify supply faces three hard constraints: environmental and permitting barriers to building new processing complexes; the scarcity of experienced engineering and operational teams outside China; and the scale advantages of China’s existing industrial clusters. These factors interact with policy choices in Beijing, where export licensing, dual-use framing, and producer consolidation can all modulate how china rare earth processing power translates into market and geopolitical influence.

    For industrial systems that depend on rare earths, the key trade-off lies between accepting continued exposure to a highly efficient but politically concentrated supply base and bearing higher costs, longer lead times, and technical risk to build parallel capacity elsewhere. Rare earths therefore illustrate a broader pattern in strategic materials: the true leverage point often resides in midstream chemical engineering and policy, not simply in mine mouth tonnages.

    Materials Dispatch will continue to monitor weak signals that reshape this landscape: incremental changes in Chinese environmental enforcement at processing hubs; new MOFCOM classifications for rare earth products; commissioning progress and technical performance at non-Chinese separation plants; and shifts in EV, wind, and defense design choices that alter element-specific demand. These are the levers that will determine how far, and how fast, China’s rare earth grip can be loosened—or reinforced—through 2030 and beyond.

  • US Rare Earth Reserves: 1.9M Tonnes America Still Can’t Process

    US Rare Earth Reserves: 1.9M Tonnes America Still Can’t Process

    **The United States holds an estimated 1.9 million metric tonnes of rare earth reserves yet lacks integrated separation and magnet-making capacity, turning a geological advantage into a strategic vulnerability across defense, clean energy, and advanced manufacturing.**

    US Rare Earth Reserves 1.9M MT: The Mountain of Minerals America Can’t Process

    The United States sits on a substantial rare earth endowment-around 1.9 million metric tonnes of identified reserves by U.S. Geological Survey (USGS) estimates-yet still imports most of the refined rare earth oxides, metals, and magnets required for critical technologies. This disconnect between geological potential and processing reality defines the current rare earth problem: ore is domestic, but value-add and strategic leverage are largely offshore.

    Recent market data underlines the paradox. US rare earth mine production has increased, with output on the order of tens of thousands of metric tonnes of concentrate per year, while imports of rare-earth compounds and metals reportedly surged in volume by well over 100% in a single year, even as the total import bill edged down slightly to around $165 million. In parallel, world production has been estimated in the hundreds of thousands of tonnes, with the US capturing only a modest share despite its reserve position. The result is a structural reserve-to-production gap that has direct implications for defense readiness, energy transition timelines, and industrial resilience.

    Materials Dispatch’s assessment is straightforward: the binding constraint in US rare earths is no longer geology, but midstream and downstream process infrastructure. Mountain Pass and similar deposits provide ore; the bottleneck lies in separation, refining, and magnet manufacturing capacity that can compete technically, economically, and environmentally with entrenched Asian producers.

    1. Reserve Position vs. Production Reality

    USGS data places US rare earth reserves at about 1.9 million metric tonnes, roughly 2% of the estimated global total of just over 90 million metric tonnes. China holds an order of magnitude more, with reserves around 44 million tonnes, while Brazil, India, Australia, Russia, and Vietnam collectively account for the majority of the remainder. On paper, the United States is not a marginal player; it occupies a solid mid-tier position in the global rare earth reserve hierarchy.

    These reserves are not concentrated in a single district. The Mountain Pass mine in California, operated by MP Materials, is the flagship deposit and currently the only major producing rare earth mine in the country. Additional prospective resources exist in Wyoming, Texas, Alaska, and other states, spanning carbonatites, ion-adsorption clays, and by-product streams from phosphate and titanium operations. Many of these remain in the resource or early feasibility stage and are highly sensitive to processing route economics and permitting expectations.

    On the production side, USGS reporting has cited US rare earth mine output in the range of roughly 50,000 metric tonnes per year in recent years, against an estimated global production of about 390,000 tonnes. That puts the US around a low double-digit percentage share of global mine supply, which appears respectable until contrasted with processing and end-product capacity, where US participation is markedly lower. The apparent reserve life, if calculated naively as reserves divided by annual production, seems comfortable-but this metric is misleading when the choke point lies further down the value chain.

    The core mismatch is this: US rare earth mining capacity is approaching strategic relevance, while US rare earth processing capacity remains strategically negligible. The ore is there, and some of it is already being dug, crushed, and concentrated. What is missing is domestic conversion of that concentrate into separated oxides, metals, and magnets at meaningful scale.

    2. How Rare Earths Move Through the US Value Chain Today

    In operational terms, the contemporary US rare earth value chain is best visualized as a two-stage loop. Stage one is domestic: ore extraction and concentration at sites such as Mountain Pass. Stage two is offshore: separation and alloying in Asia, followed by re-import of refined oxides, metals, and magnet components into the US. This out-and-back flow is the structural vulnerability at the heart of the system.

    At Mountain Pass, MP Materials mines bastnäsite ore, then crushes, grinds, and beneficiates it through flotation to produce a rare earth concentrate. That concentrate undergoes roasting and leaching on site, yielding a mixed rare earth carbonate or oxide intermediate. Historically, the majority of this intermediate material has been exported—primarily to China—for full separation into individual rare earth oxides and subsequent conversion into metals and magnets. While MP Materials has been re-establishing separation capabilities at Mountain Pass, the US as a whole still relies heavily on foreign separation and downstream processing.

    This pattern is visible in trade statistics. Despite domestic mine output, US imports of rare-earth compounds and metals reportedly increased by about 169% in volume in a recent year, even as the total dollar value slipped modestly from roughly $168 million to $165 million. That combination—a sharp rise in physical volumes with a flat-to-lower import bill—indicates two simultaneous dynamics: price compression in the global market and increased dependency on external processors to satisfy growing domestic demand.

    From an industrial systems lens, this arrangement embeds three distinct risks. First, it exposes domestic manufacturers of electric vehicle motors, wind turbines, electronics, and defense systems to foreign policy and export control decisions over which they have no influence. Second, it erodes process know-how: the US loses feedback loops between end-user technical specifications and process optimization that tend to cluster where separation and magnet-making occur. Third, it anchors the cost structure of US rare-earth-intensive products to offshore environmental and labor arbitrage rather than domestic process optimization.

    Aerial view of a U.S. open-pit rare-earth mine, illustrating scale and geology.
    Aerial view of a U.S. open-pit rare-earth mine, illustrating scale and geology.

    3. Processing Technologies and the US Infrastructure Deficit

    Rare earth processing is complex, chemistry-intensive, and unforgiving of shortcuts. This is where the US deficit is most acute. The typical midstream chain from concentrate to separated oxide includes several steps: calcination or roasting of concentrate, acid leaching, impurity removal, separation of individual rare earths (usually by solvent extraction or ion exchange), precipitation of purified products, and calcination to oxides, followed by metal making and alloying where required.

    The separation stage is the technical and capital heart of the process. Light rare earths (lanthanum, cerium, praseodymium, neodymium) are chemically similar and require dozens, sometimes hundreds, of solvent extraction stages to achieve high purity. Heavy rare earths (dysprosium, terbium, yttrium, etc.) often demand even more intricate circuits. Each stage requires mixer-settler tanks, organic and aqueous phases, pH control, and extensive process monitoring. Throughput is high-volume, low-grade chemistry, with operating windows that are narrow if product purity in the range of 99.9% or higher is expected.

    Building such a plant in the US involves several categories of capital outlay: large-scale SX (solvent extraction) banks or ion exchange columns; reagent storage and handling systems; high-density polyethylene or lined steel tanks for corrosive solutions; effluent treatment facilities; and tailings management infrastructure capable of handling both chemical and radiological hazards. Sector analyses often place required upfront capital in the hundreds of millions of dollars for medium-scale facilities, with project economics highly sensitive to plant utilization, reagent costs, and environmental compliance measures.

    Regulation is a further structural factor. Many rare earth ores, especially those rich in monazite, contain elevated levels of thorium and sometimes uranium. Once processed, these can trigger Nuclear Regulatory Commission (NRC) oversight, with stringent requirements for storage, monitoring, and potential disposition of radioactive by-products. The Environmental Protection Agency (EPA) and state authorities regulate air emissions (notably fluorine-bearing species and acid mists), water discharge, and solid waste. As a result, permitting timelines for a greenfield separation facility can extend several years, with open-ended risk around additional conditions imposed during review.

    Contrast this with China’s southern and northern rare earth clusters, where solvent extraction facilities sit adjacent to mines, magnet plants, and component factories in integrated industrial zones. Shared infrastructure, existing tailings management systems, and experience curves from decades of operation compress both capital and operating costs. This asymmetry is the core of China’s enduring advantage in rare earths: not just reserves, but accumulated process infrastructure and institutional learning.

    4. Sectoral Exposure: Defense, Clean Energy, and Electronics

    The gap between US rare earth reserves and domestic processing has direct implications for high-stakes sectors. Rare earths are not simply another industrial input; they sit at the heart of performance-critical components that are difficult to redesign around on short timelines.

    In defense, neodymium-iron-boron (NdFeB) and samarium-cobalt (SmCo) permanent magnets are embedded in precision-guided munitions, radar systems, actuators, sonar, and electric drive systems for naval vessels and aircraft. Europium, terbium, and yttrium phosphors underpin night-vision and display technologies. Yttrium-aluminum-garnet (YAG) laser systems rely on rare earth dopants. For many of these applications, substitution pathways are either technologically immature or performance-degrading.

    Recognizing this, the US government has been building a limited buffer via the National Defense Stockpile. Procurement documentation has cited acquisitions in the range of hundreds of tonnes of neodymium-praseodymium oxide and several hundred tonnes of NdFeB magnet block, alongside smaller volumes of other strategic materials. These quantities are meaningful for specific defense programs but equate to only a few months of consumption at current or projected demand levels. They mitigate acute short-term shocks; they do not fundamentally resolve midstream structural dependence.

    Diagrammatic illustration of the reserve-to-processing gap in the U.S. rare-earth supply chain.
    Diagrammatic illustration of the reserve-to-processing gap in the U.S. rare-earth supply chain.

    In clean energy and electrification, exposure is even larger in absolute tonnage. A single wind turbine using a direct-drive generator can require hundreds of kilograms of NdFeB magnet material. Battery electric vehicles typically contain on the order of a kilogram of rare earth magnets in traction motors and auxiliary systems, depending on design choices. Scaling EV production into the millions of units per year and deploying thousands of large wind turbines implies continuing growth in US rare earth demand, particularly for neodymium, praseodymium, dysprosium, and terbium.

    Consumer and industrial electronics add another layer: hard disk drives, audio systems, sensors, and robotics all rely on compact high-performance magnets and specialty alloys. While per-unit consumption can be small, aggregate demand is significant, and redesigning entire product lines around alternative technologies is slow, costly, and often constrained by physics (for example, energy product limits for ferrite magnets).

    From an operational risk standpoint, the conclusion is clear: the US rare earth processing gap is not an abstract supply chain issue; it is a direct constraint on industrial policy objectives in defense, energy transition, and advanced manufacturing. Any disruption in offshore separation capacity would rapidly manifest as shortages of magnet materials and high-purity oxides, long before domestic reserves became relevant.

    5. Emerging US Responses and Their Execution Constraints

    Over the past several years, a series of initiatives has begun to address the US midstream gap. These efforts cluster around three themes: re-integration of the Mountain Pass complex, parallel development of alternative domestic projects and recycling, and targeted public funding framed as critical minerals and industrial resilience policy.

    First, MP Materials and Mountain Pass represent the clearest attempt to rebuild an integrated rare earth value chain on US soil. The company has reinvested in on-site processing, moving beyond simple concentrate exports toward mixed rare earth carbonate and oxide production, and has announced and begun constructing separation capacity intended to produce individual light rare earth oxides at commercial scale. In parallel, MP Materials has moved downstream with a magnet manufacturing facility in Texas focused on supplying neodymium-iron-boron magnets for automotive and other applications. This is a deliberate attempt to capture more of the value chain domestically and reduce the need to export intermediate products.

    The execution challenges are non-trivial. Achieving consistent oxide purity within tight impurity specifications for magnet-grade neodymium and praseodymium requires stable solvent extraction performance, reagent control, and effective removal of elements such as iron, calcium, and non-lanthanide contaminants. Magnet plant operations add their own constraints: strip casting, hydrogen decrepitation, jet milling, pressing, and sintering steps must all be tightly controlled to meet coercivity and remanence requirements. Scaling both ends of this chain concurrently raises coordination risks; bottlenecks in oxide supply or quality will propagate into the magnet facility, and vice versa.

    Second, a cohort of new and revived US projects targets varied ore types and process routes. Some focus on heavy rare earths in clay-like deposits, seeking to replicate ion-adsorption clay leaching methods used in southern China—albeit under stricter environmental controls. Others look to by-product recovery from phosphates, titanium, or coal ash. There is also growing emphasis on recycling of end-of-life magnets and industrial scrap using hydrometallurgical and direct re-use routes. The advantage of recycling is clear: higher feed grades and fewer radioactivity issues. that said, scaling magnet collection systems, dismantling infrastructure, and specialized recycling plants remains a multi-year effort.

    Third, federal agencies have deployed tools oriented around industrial resilience rather than financial return. These include Defense Production Act (DPA) authorities, loan guarantees, grants for demonstration-scale separation facilities, and offtake contracts aimed at underpinning demand visibility. In several cases, public funding has targeted early-stage processing technology (such as alternative solvent systems, membrane separations, or novel ion exchange media) alongside more conventional solvent extraction plants. While the capital amounts in individual awards are often modest relative to total project needs, they can de-risk early engineering and permitting phases.

    The common constraint across these tracks is execution under regulatory, social, and technical scrutiny. Rare earth processing has a legacy reputation for environmental damage, largely rooted in poorly managed operations in earlier decades and in jurisdictions with weaker enforcement. US projects must demonstrate not only economic viability but also credible, auditable control over emissions, effluents, and tailings. Any misstep risks reinforcing community opposition and tightening regulatory expectations for the entire sector.

    Interior view of a rare-earth separation facility showing solvent-extraction columns and process equipment.
    Interior view of a rare-earth separation facility showing solvent-extraction columns and process equipment.

    6. Scenarios, Trade-offs, and Failure Modes

    Looking ahead, the interplay between reserves, processing infrastructure, and policy produces a limited but consequential set of scenarios for US rare earths. None eliminate dependence on global trade; the question is how much strategic leverage the United States gains or forfeits in each case.

    Scenario 1: Upstream growth without midstream breakthrough. In this path, mining and concentrate production expand—at Mountain Pass and potentially at new US deposits—but separation and magnet manufacturing capacity remain constrained by capital, permitting, or technology bottlenecks. The US becomes a larger exporter of intermediate products while still importing most of its finished rare earth materials. The reserve-to-production gap narrows at the mine level but persists, or even widens, at the processing level. This scenario maintains geological relevance but leaves industrial policy objectives heavily exposed to offshore processing decisions.

    Scenario 2: Successful light rare earth integration, persistent heavy rare earth dependence. In this configuration, projects such as Mountain Pass plus associated magnet plants achieve reliable, competitive processing of light rare earths—neodymium, praseodymium, lanthanum, cerium—and can supply a material share of domestic demand for EV and wind magnets. However, heavy rare earths (notably dysprosium and terbium), which are essential for high-temperature magnets, remain largely sourced from imports due to the geological distribution of ore types and slower progress on clay and by-product projects. US manufacturing gains partial insulation from shocks but remains dependent on a narrow set of foreign suppliers for critical heavy rare earths.

    Scenario 3: Technology shift toward alternative processing and materials. Advances in separation technologies (membrane-based systems, new extractants, or solid-phase sorbents) could lower the capital and environmental barriers to domestic processing, while materials science continues to push magnet designs that reduce or partially substitute rare earth content. Under this scenario, US projects could deploy less waste-intensive separation routes, easing permitting and operating constraints, while end-users redesign products for lower dysprosium or terbium intensity. This would not remove reliance on rare earths, but it would reshape the risk landscape by reducing the most acute single-element exposures.

    Across all scenarios, there are common failure modes that recur in project histories:

    • Process scale-up gaps: Laboratory or pilot-scale separation flowsheets that fail to translate to commercial throughput due to phase separation issues, crud formation in solvent extraction, or unanticipated impurity behavior.
    • Reagent and consumable risk: Dependence on specific extractants, acids, or neutralizing agents whose cost or availability shifts, undermining operating assumptions.
    • Tailings and effluent mismanagement: Underestimation of residue volumes or radioactivity leading to overruns on storage facilities, community pushback, or regulatory intervention.
    • Social license erosion: Inadequate engagement with local communities and tribal nations, especially where water use and landscape disturbance intersect with existing concerns.
    • End-market misalignment: Failure to produce material that meets the exacting specifications of magnet makers or catalyst producers, leading to discounts, reprocessing, or loss of offtake.

    Industrial resilience logic therefore revolves less around any single flagship project and more around systemic redundancy: multiple ore types, multiple processing routes, diversified geographic footprints, and continuous feedback between end-user requirements and process design. Reserves alone do not confer security; it is the configuration and robustness of the processing network that determines practical autonomy.

    7. Conclusion: From Ore to Autonomy

    The phrase “US rare earth reserves” often conjures images of vast untapped mineral wealth waiting to be brought online. The operational reality is less straightforward. The United States does hold around 1.9 million metric tonnes of identified rare earth reserves and operates a globally significant mine at Mountain Pass. Yet, because separation, refining, and magnet manufacturing capacity remain limited, this endowment has not translated into strategic autonomy in critical minerals.

    There is progress: MP Materials’ reintegration efforts, emerging projects in non-traditional ore types and recycling, and targeted government support framed around US critical minerals and industrial resilience rather than short-term financial metrics. Still, the risk structure remains defined by a fundamental asymmetry with Chinese and other Asian processing clusters that benefit from existing infrastructure, clustered expertise, and established supply relationships.

    For Materials Dispatch, the key analytical signal is no longer whether the US has enough ore. It does. The decisive weak signals lie in permitting decisions for separation projects, demonstrated performance of new processing technologies at scale, long-term offtake contracts that bridge mines to magnet makers, and the evolution of environmental and radiological compliance frameworks. Monitoring these will determine whether US rare earth reserves remain a latent geological statistic—or become the foundation of a robust, domestically anchored rare earth value chain.

    Note on Materials Dispatch methodology Materials Dispatch integrates continuous monitoring of technical standards and policy documents (for example, USGS critical minerals reports and Defense Logistics Agency procurement data), market behavior in rare earths and allied metals, and end-use performance requirements in sectors such as EVs, wind, and defense electronics. This triangulation enables a process-first view of US critical minerals security that connects upstream reserves, midstream processing realities, and downstream engineering specifications.

  • Greenland Rare Earths: 1.5 Million Tonnes Underground, Zero Production

    Greenland Rare Earths: 1.5 Million Tonnes Underground, Zero Production

    Greenland Rare Earths: Huge Resources, Operational Standstill

    Materials Dispatch has followed the Greenland rare earth story through several supply shocks: export quota tightenings from China, scramble purchasing for dysprosium and terbium, and repeated Western promises that “the Arctic will save us.” The core tension has not changed: Greenland holds a globally significant heavy rare earth endowment, yet delivers precisely zero commercial rare earth tonnage in 2026. For supply-chain, compliance, and policy teams, this gap between geological potential and operational reality is no longer just a curiosity; it is a structural risk factor.

    Over the past decade, Greenland has moved from speculative footnote to recurring item in board-level discussions on strategic materials. The experience has been sobering. Several counterparties quietly pencilled in Kvanefjeld and Tanbreez as diversification anchors in internal planning around 2018-2020. Regulatory reversals, community opposition, and basic infrastructure gaps have since forced repeated timeline rewrites and contingency planning. That operational history frames this briefing.

    • The change: Greenland is now widely recognised as holding around 1.5 million metric tons of proven rare earth reserves, and potentially up to 38.5 million metric tons including resources, while still having no commercial REE mine in operation as of 2026.
    • What is covered: Southern Greenland’s flagship Kvanefjeld and Tanbreez projects, the uranium ban and permitting regime, and the logistics/processing constraints that shape any rare earth Greenland scenario.
    • What is not covered: Detailed project economics, contracts, or price forecasts; these remain highly uncertain and project‑specific.
    • Operational implication: To the extent that Greenland eventually contributes to supply, it is likely to do so on multi‑year timelines, with high regulatory and infrastructure friction but strong potential leverage in heavy rare earths (HREEs).
    • Reading limits: Figures from project studies and policy initiatives are subject to revision; no single Greenland project presently has a final investment decision or construction underway.

    FACTS: Resource Base, Projects, and Regulatory Setting

    1. Greenland’s rare earth resource base in numbers

    As of 2026, publicly available geological and policy assessments converge on several key data points for greenland rare earth minerals:

    • Greenland holds around 1.5 million metric tons of proven rare earth reserves, with estimates of up to 38.5 million metric tons when broader resources are included.
    • This places Greenland roughly in the global top ten by rare earth endowment, with especially strong concentrations in heavy rare earth elements (HREEs) such as dysprosium and terbium.
    • Despite this geological position, Greenland’s commercial rare earth production in 2026 is zero. No REE mine is permitted and operating at industrial scale.

    The resource base is concentrated in southern Greenland’s Gardar Province, with additional carbonatite and alkaline complexes in the west and south that are less advanced in the project pipeline.

    2. Flagship projects: Kvanefjeld and Tanbreez

    Two projects dominate any realistic discussion of rare earth Greenland development: Kvanefjeld and Tanbreez. Both are located in southern Greenland, with fjord access and relative proximity to existing settlements, but share exposure to the same regulatory and logistical environment.

    Kvanefjeld (Kuannersuit)

    • Located near Narsaq in southern Greenland, Kvanefjeld has been promoted as one of the world’s largest undeveloped rare earth deposits.
    • Project studies describe resources that include roughly 370,000 metric tons of heavy rare earths and envisage processing ore at around 500,000 metric tons per year to produce approximately 25,000 metric tons per year of total rare earth oxides (TREO).
    • The resource is associated with uranium and other by‑products; uranium content is central to the project’s regulatory challenge.
    • The project has been led by Greenland Minerals (now Energy Transition Minerals / Greenland Resources Inc., depending on corporate restructuring and branding), with historical links to Chinese strategic partner Shenghe Resources.

    Tanbreez

    • Also in southern Greenland’s Gardar Province, Tanbreez is an eudialyte‑hosted deposit that is heavily skewed toward HREEs.
    • Public technical disclosures have cited resources of roughly 28.2 million metric tons of mineralised material, with rare earth grades in the range of ~0.38% TREO and heavy rare earths representing around 27% of the rare earth mix.
    • A preliminary economic assessment (PEA) was completed around 2025 under Critical Metals Corp, following earlier ownership and partnership structures that included Shenghe Resources.
    • As of 2026, the project remains at study stage, with no full construction decision or operating mine.

    Both projects are positioned as future suppliers of HREEs critical for high‑performance permanent magnets used in defense systems, electric vehicle traction motors, and wind turbines, but neither contributes physical material to the market today.

    3. Other relevant Greenland rare earth and associated projects

    Beyond Kvanefjeld and Tanbreez, several earlier‑stage or multi‑commodity projects contribute to the strategic picture of greenland mining:

    • Motzfeldt (southern Greenland): Rare earth-niobium project, historically with TREO grades around 0.2-0.3%. Controlled by Rainbow Rare Earths, with activity largely paused after the uranium policy shift.
    • Sarfartoq (western Greenland): Carbonatite‑hosted rare earth prospect associated with Neo Performance Materials, focused more on light rare earths, with some higher‑grade drill intercepts reported.
    • Gronnedal‑Ika and other alkaline complexes in the south: Exploration‑stage REE‑bearing systems, with no advanced development plans in 2026.
    • Multi‑metal projects such as Disko‑Nuussuaq (nickel‑copper‑PGM) and Citronen (zinc‑dominant, with rare earth traces) exist but are primarily relevant for other critical materials.

    None of these additional projects has reached a construction decision or commercial production, and most are constrained by similar environmental, permitting, and infrastructure considerations.

    4. Uranium ban and regulatory framework

    A decisive regulatory inflection point occurred in 2021, when Greenland’s parliament adopted a ban on uranium mining and exploration above a low concentration threshold. This decision followed an election in which the Inuit Ataqatigiit (IA) party campaigned explicitly against development of Kvanefjeld due to uranium and environmental concerns.

    Key factual consequences for rare earth Greenland projects:

    • The uranium ban effectively blocks advancement of Kvanefjeld in its original configuration because the ore hosts uranium as a significant co‑product.
    • Several other southern Greenland projects with uranium‑bearing mineralisation face similar legal constraints, depending on measured concentrations and ore handling plans.
    • As of 2026, the ban remains in force. Political debates continue, with some parties advocating revision or nuanced thresholds, but no legislative reversal has been enacted.

    The mining regime is administered by the Government of Greenland (Naalakkersuisut) under Danish sovereignty, with Denmark retaining control over foreign policy and defence. Licencing decisions are formally local, but international partners (EU, U.S., Nordic states) have signalled strong interest in critical minerals cooperation.

    5. Infrastructure, climate, and operational baselines

    From an operational standpoint, several facts consistently appear across project documentation and government briefings:

    • Outside a few towns, no integrated road or power grid exists. Major mining projects would be required to build dedicated port, road, and power infrastructure.
    • Many prospective sites are accessible only seasonally due to ice and weather conditions; southern Greenland is more accessible than the far north but still faces winter constraints.
    • Greenland’s total population is on the order of tens of thousands, with limited local mining workforce and engineering capacity, implying substantial reliance on imported labour and services.
    • Existing mining activity on the island is limited to a small number of non‑rare‑earth operations (for example, gold or industrial minerals), underlining the lack of current large‑scale mine operating experience in this jurisdiction.

    6. Global context: China’s processing dominance and Greenland’s relative position

    International surveys and industry analyses align on several broad points about the global rare earth landscape:

    • China controls a very large share of known rare earth reserves (on the order of tens of millions of metric tons) and an overwhelming share of global processing capacity, often cited around 95% of refining and separation.
    • Non‑Chinese supply comes primarily from projects such as MP Materials’ Mountain Pass (United States) and Lynas (Australia), which are relatively light‑rare‑earth‑heavy and less focused on HREEs.
    • Heavy rare earth supply, especially dysprosium and terbium, is structurally tight and closely tied to Chinese assets in China and Myanmar.
    • On a pure geological basis, Greenland’s endowment of HREEs places it among the most strategically relevant future sources outside China, even though it currently contributes no production.

    Several policy reports and think‑tank analyses have warned of emerging supply deficits in HREEs for defense and clean‑energy applications in the second half of the 2020s, using Greenland as a hypothetical backstop in many scenarios.

    INTERPRETATION: Strategic Reading and Operational Consequences

    1. Greenland as paradox: central in strategy decks, absent in warehouses

    From an operational vantage point, Greenland sits in an uncomfortable middle ground. On paper, it offers one of the few sizeable heavy rare earth alternatives to China. In practice, the combination of uranium politics, infrastructure scarcity, and limited institutional mining experience has kept it out of every real‑world supply chain.

    To the extent that planners have treated Greenland as a near‑term diversification source, that has already proven costly. Internal sourcing roadmaps developed in the late 2010s projected first tonnage from Kvanefjeld and possibly Tanbreez well before 2025. Those projections have slipped repeatedly, and the 2021 uranium ban transformed them from optimistic to implausible in the near term. This experience has hardened scepticism toward “resource‑rich but rule‑fluid” jurisdictions among downstream industrial buyers.

    2. Kvanefjeld: strategically huge, politically radioactive

    In any sober ranking of strategic projects, Kvanefjeld remains a top‑tier HREE deposit by size and potential output. If it were permitted and built broadly along the lines of its pre‑feasibility planning, it could provide a meaningful share of non‑Chinese heavy magnet material by the early 2030s.

    However, under the current uranium ban, this potential is locked. The political cost of reversing a ban won on the back of a clear electoral mandate is high. Even if a future coalition in Nuuk decides to soften or nuance the law, the process of legislative change, revised environmental impact assessments, and renewed community consultation would likely add multiple years before any shovel hits the ground.

    There is ongoing technical discussion about whether advanced separation technologies or altered mine plans could isolate or export uranium in a way that satisfies both the law and local concerns. To the extent that such options are technically and commercially viable, they still face the hurdle that trust is currently low between parts of the local community and the Kvanefjeld operator. In the Greenland context, social licence is not a box‑ticking exercise; it is the primary gating factor.

    3. Tanbreez: premium HREE geology, infrastructure grind

    In contrast, Tanbreez carries less uranium baggage and clearer alignment with the prevailing political narrative of “green transition minerals.” Its eudialyte mineralogy, high HREE proportion, and gallium and zirconium co‑products give it both strategic appeal and metallurgical complexity.

    The main friction here is not a single regulatory veto but cumulative operational drag: remote location, lack of grid power, need for bespoke port and road infrastructure, challenges in processing eudialyte at scale without defaulting to Chinese know‑how. In practice, those obstacles translate into longer lead times and higher execution risk. Even if permitting aligns, turning Tanbreez into a stable supplier will likely be a decade‑scale project, not a three‑year sprint.

    Experience from other new‑build mining jurisdictions suggests that early‑stage promises of rapid commissioning tend to under‑estimate the delays associated with Arctic construction seasons, supply‑chain congestion, and workforce turnover. To the extent that Tanbreez emerges as Greenland’s first serious rare earth mine, its performance will shape external perceptions of the entire jurisdiction.

    4. Multi‑year timelines and HREE deficits

    Several scenario studies have modelled HREE deficits in dysprosium and terbium in the second half of the 2020s if demand from electric vehicles, offshore wind, and advanced defense systems continues to grow while China tightens export conditions. Some of those studies assume that Greenland could relieve 20–30% of projected annual shortfalls by the early 2030s if one or both of Kvanefjeld and Tanbreez come onstream at scale.

    Under current conditions, that remains aspirational. Realistically, Greenland is better understood as a potential second‑wave supplier, emerging after first‑wave expansions in places like Australia, North America, and possibly Sweden. If political and technical bottlenecks ease, Greenland could then tilt the balance in the 2030s and beyond, especially in HREEs. Until that happens, any reliance on Greenland to plug near‑term deficits carries material execution risk.

    5. Compliance and ESG: uranium, Indigenous rights, and external partners

    From a compliance perspective, Greenland combines attractive macro features-rule of law, Danish/EU alignment, low corruption-with dense project‑level sensitivities:

    • Uranium and dual‑use concerns: Kvanefjeld’s uranium content engages nuclear‑related scrutiny on top of mining regulation. Even if legal obstacles are reduced, downstream buyers would likely need robust traceability and assurances about handling of radioactive by‑products.
    • Indigenous rights and local consent: Inuit communities and political parties have already demonstrated their ability to stop projects perceived as environmentally or culturally unacceptable. Any attempt to bypass or minimise this dimension is likely to trigger new opposition.
    • Non‑Western technical partners: Historical and, in some cases, current Chinese corporate involvement (for example via Shenghe) raises questions in Washington, Brussels, and some corporate boardrooms about technology transfer, dependence, and sanctions exposure.

    To the extent that companies and states frame Greenland as a “clean” alternative to China, failure to take these ESG and geopolitical layers seriously would create reputational and regulatory liabilities rather than diversification.

    6. How Greenland reshapes sourcing conversations-if it ever turns on

    In procurement and risk‑review cycles observed by Materials Dispatch, Greenland has already altered the structure of discussions even without shipping a single tonne. Teams no longer ask only “Is there a non‑Chinese source?” but rather “Is the non‑Chinese source real, bankable, and on a credible timeline?” Greenland is often cited as the example of how geology alone is not enough.

    If Kvanefjeld or Tanbreez progresses materially—clear permits, funded infrastructure, visible construction—this would likely change how Western OEMs and governments negotiate with Chinese suppliers. Even a credible future alternative can influence bargaining dynamics. Conversely, continued stagnation will reinforce the perception that Arctic headline numbers are more mirage than mitigation, pushing more attention toward incremental expansions in less challenging jurisdictions.

    WHAT TO WATCH: Signals That Greenland Is Moving From Hype to Supply

    Several observable indicators can help distinguish rhetorical support from concrete progress in Greenland rare earth development:

    • Legislative movement on the uranium ban: Any draft bill, official consultation, or coalition agreement explicitly addressing modification of the 2021 uranium law would materially change the outlook for Kvanefjeld and similar deposits.
    • Definitive feasibility studies (DFS) and bankable engineering for Tanbreez: Transition from PEA‑level narratives to detailed engineering and environmental baselines would indicate that the project is entering a more serious execution phase.
    • Binding infrastructure commitments: Announcements of financed port, road, and power projects dedicated to mining in southern Greenland, whether public, private, or blended, would reduce a central execution risk for all rare earth Greenland assets.
    • Processing strategy clarity: Clear decisions on whether concentrates will be shipped to third‑country refineries (EU, U.S., elsewhere) or processed partially in Greenland, and with which technical partners, will signal how much of the value chain can realistically move out of China.
    • Community agreements and benefit‑sharing frameworks: Publicly disclosed impact‑benefit agreements or similar structures with local Inuit communities will show whether social licence issues are being addressed or deferred.
    • Security and export‑control positioning: Inclusion of Greenland projects in EU, U.S., or allied critical mineral funding instruments and security frameworks will indicate how central policymakers consider these deposits to be in long‑term strategy.

    Conclusion

    Greenland’s rare earth story is no longer simply about untapped potential. It is a live case study in how resource endowment, domestic politics, Indigenous rights, and Arctic logistics can combine to keep world‑class deposits out of the supply chain for a generation. For heavy rare earths in particular, the island sits at the intersection of Western strategic anxiety and very local concerns about land, health, and control.

    On current trajectories, Kvanefjeld and Tanbreez are unlikely to offer rapid relief to looming dysprosium and terbium tightness, but they remain among the few plausible pathways to structurally reduce China’s dominance in the 2030s. Whether that promise turns into tonnage depends less on geology and more on law, infrastructure, and trust. Materials Dispatch will continue active monitoring of regulatory and industrial weak signals from Nuuk, Copenhagen, Brussels, Washington, and the project sites themselves that will define how this story evolves.

    Note on Materials Dispatch methodology Materials Dispatch integrates continuous monitoring of decisions, consultations, and technical releases from Greenland and Danish authorities with international critical‑minerals policy documents and company‑level disclosures. This is combined with cross‑checking against observed supply‑chain behaviour and the technical specifications of end‑use applications in defense, energy, and advanced manufacturing to test whether narrative claims align with operational realities.

  • DRC Cobalt Mining: 75% of Global Supply, Zero Pricing Power

    DRC Cobalt Mining: 75% of Global Supply, Zero Pricing Power

    Materials Dispatch has tracked cobalt mining in Congo for more than a decade, and the pattern has become uncomfortably familiar: supply chains depend structurally on the Democratic Republic of Congo (DRC), yet every regulatory move from Kinshasa turns into a new layer of operational risk rather than a lever of pricing power. When export bans hit, refineries scramble, compliance teams panic, and procurement committees re-open sourcing maps that were supposedly “locked in” for years. The recent export ban and subsequent congo cobalt export quota regime do not read like a confident resource superpower strategy; they read like a system betting on scarcity while still leaking artisanal cobalt into the market at scale.

    • Change: DRC replaced a 2025 cobalt hydroxide export ban with a quota regime for Q4 2025 and 2026-2027, including volumes earmarked for a national strategic stockpile.
    • Scope: Quotas cover industrial cobalt exports from DRC; artisanal cobalt remains only partially captured, with significant leakage via informal and cross-border channels.
    • Operational impact: Structural bottlenecks for compliant hydroxide feedstock, longer lead times, and increased reliance on Indonesian and recycled cobalt heading into the cobalt market outlook 2026.
    • Paradox: Despite controlling more than two-thirds of global mine output, DRC has limited and unstable pricing power because policy constraints collide with artisanal oversupply and buyer diversification.
    • Limits: Quota parameters, ASM volumes, and alternative supply growth remain uncertain and subject to policy, project execution, and enforcement quality.

    FACTS: DRC cobalt supply, quotas, and parallel artisanal flows

    DRC’s dominant role in global cobalt mining

    The starting point is clear: cobalt mining in Congo dominates global supply. DRC accounts for over 70% of global mined cobalt, with recent estimates placing its share around 73-75% of total mine production. This concentration is structurally embedded in the global battery and superalloy value chains.

    Most of this drc cobalt supply is exported as intermediate products, primarily cobalt hydroxide from large industrial operations in Lualaba and Haut-Katanga. DRC does not yet have operational large-scale refining capacity for battery-grade cobalt salts. A domestic refinery project targeting cobalt sulfate production has been signaled for around 2030, but as of the mid-2020s the country exports raw or semi-processed feedstock rather than finished chemicals.

    From export ban to congo cobalt export quota (2025-2027)

    In early 2025, the DRC government introduced a temporary export suspension targeting cobalt hydroxide, officially framed as a response to oversupply and depressed prices. Shipments were halted from February 21, 2025, creating an immediate disruption in feedstock flows to refineries, particularly in China.

    On September 21, 2025, the authorities pivoted from a full ban to a quota-based regime. The key elements reported for this regime are:

    • A quota of 18,125 metric tons (MT) of contained cobalt for the last quarter of 2025, largely reflecting backlog volumes accumulated during the export suspension.
    • Annual export quotas of 96,600 MT for 2026 and 2027, of which 87,000 MT are available for export and 9,600 MT are reportedly earmarked for a national strategic stockpile.
    • Quotas administered on a quarterly basis, with the government retaining flexibility to adjust allowances in response to market conditions, including the possibility of rolling over part of the Q4 2025 backlog into early 2026.

    These export ceilings represent a substantial reduction versus DRC’s prior export volumes, which had been estimated well above 100,000 MT of contained cobalt in 2024. In effect, the regime constrains formal exports to a bit less than half of recent production estimates.

    The quota system is administered through licenses granted by the Ministry of Mines. Reports from cargoes stranded in mid-2025 indicate that administrative clearances have lagged, with some shipments still undelivered into early 2026 despite nominal quota availability.

    Artisanal cobalt: scale, informality, and traceability gaps

    Alongside large industrial operations, artisanal and small-scale mining (ASM) plays a major role in cobalt mining in Congo. Estimates suggest that ASM accounts for roughly 15–30% of DRC’s cobalt output, translating into tens of thousands of metric tons per year. This artisanal cobalt is typically extracted from shallow pits, tailings, or informal “artisanal zones” around industrial concessions, with Lualaba and Haut-Katanga acting as focal provinces.

    Key characteristics of this ASM segment include:

    • High ore grades in some zones, but wide variability in quality and impurity profiles.
    • Weak or absent formal traceability, with material changing hands multiple times before reaching traders or small depots.
    • Documented human rights concerns, including reports of child labor and unsafe working conditions.
    • Porous borders enabling smuggling via neighboring countries such as Zambia or Angola, often outside the scope of DRC’s formal export statistics.

    Despite regulatory initiatives and pilot traceability schemes, large amounts of artisanal cobalt still enter regional trade networks in ways that are difficult to reconcile with Western ESG requirements. This is particularly sensitive for supply chains governed by instruments such as the EU Battery Regulation or expanded due diligence rules in North America and Europe.

    Price effects and early quota impact

    The 2025 export suspension and subsequent quotas triggered a sharp tightening in officially traded cobalt hydroxide feedstock, particularly for Chinese refiners reliant on DRC-origin material. Reported assessments indicate that cobalt hydroxide prices on a CIF China basis increased by close to 70% between the onset of the disruption and early December 2025, reaching levels above $50,000 per metric ton of contained cobalt.

    Artisanal and industrial cobalt extraction side-by-side in the DRC.
    Artisanal and industrial cobalt extraction side-by-side in the DRC.

    Analysts projected a global cobalt market deficit for 2026 on this basis. One widely cited set of forecasts referenced demand figures around 292,300 MT for 2026, with a deficit in the order of roughly 10,700 MT once the DRC quota cap and incremental Indonesian supply were factored in. Recycling output was projected to cover part of this gap, with on the order of several tens of thousands of metric tons per year of recovered cobalt expected in 2026.

    Alternatives to DRC: Indonesia, recycling, and diversified mines

    Several non-DRC sources of cobalt are expanding, though none individually replicate the scale of drc cobalt supply.

    • Indonesia: High-pressure acid leach (HPAL) projects producing mixed hydroxide precipitate (MHP) with nickel and cobalt content are ramping up. Indonesian output is expected to grow significantly through the mid-2020s, with some forecasts placing 2026 cobalt volumes in the tens of thousands of metric tons.
    • Recycling: Facilities in Europe, North America, and Asia are scaling recovery of cobalt from spent lithium-ion batteries and industrial scrap. Projections for 2026 suggest recycled cobalt output in the range of several tens of thousands of metric tons, rising further towards 2030.
    • Other mining jurisdictions: Australia, Canada, and a small number of other countries host primary cobalt or cobalt-by-product operations. These assets are materially smaller than leading DRC mines but are relevant for strategic diversification, particularly for defense and aerospace uses.

    Despite this diversification, DRC remains the indispensable supplier for global cobalt, and the congo cobalt export quota system therefore acts as a global bottleneck for compliant feedstock.

    INTERPRETATION: Why supply dominance has not delivered pricing power

    A resource nationalism experiment colliding with ASM reality

    From Materials Dispatch’s vantage point, DRC’s latest policy cycle looks like a textbook illustration of how export controls can backfire when the informal sector is larger and more agile than the state’s enforcement capacity.

    On paper, capping exports at around 96,600 MT in 2026–2027, with 9,600 MT diverted to a strategic stockpile, appears to be an attempt to restore pricing power after years of oversupply. In practice, several constraints undermine that ambition:

    • Industrial exports are rationed, but artisanal cobalt continues to leak out via informal or semi-formal channels.
    • Administrative delays mean that even within the official quota limits, realized shipments fall short of ceiling volumes, creating artificial tightness for compliant buyers.
    • Global buyers, particularly those facing strict ESG rules, accelerate diversification toward Indonesia, recycling, and non-DRC origins whenever DRC governance risk spikes.
    • At the same time, less regulated segments and regions continue absorbing ASM-linked material, blunting the intended price effect of the quotas.

    The net result is paradoxical: the DRC government has enough leverage to inject volatility and cause sharp price swings in formally traded cobalt hydroxide, but not enough control over production and export channels to anchor a stable, long-term pricing premium.

    Visualized global supply flows and alternatives to DRC cobalt.
    Visualized global supply flows and alternatives to DRC cobalt.

    The two-track market: compliant vs opaque flows

    Materials Dispatch’s work with compliance-heavy supply chains has highlighted a hard split in cobalt flows:

    • Track 1: Industrial, traceable material destined for battery and alloy supply chains exposed to Western regulation. This track is bound by the congo cobalt export quota regime and subject to long lead times, customs scrutiny, and ESG audits.
    • Track 2: Opaque or partially traceable material, heavily weighted toward artisanal cobalt, flowing into less regulated markets. This track operates with more flexible logistics and often weaker documentation.

    To the extent that export quotas tighten only Track 1 while Track 2 remains largely unconstrained, the policy outcome is skewed. Compliant buyers experience scarcity, volatility, and reputational risk, while other actors continue accessing significant volumes at terms that reflect local bargaining power rather than global constraints.

    This duality helps explain why, even after reported price spikes in late 2025, DRC has not achieved the kind of consistent, premium pricing that might be expected from a jurisdiction commanding such a large share of global mine output.

    Operational consequences across the supply chain

    For refineries and cathode producers that rely heavily on drc cobalt supply, the practical effects of the quota regime and its implementation delays are tangible:

    • Longer and more variable lead times between mine gate and refinery, due to licensing, customs clearances, and logistical congestion when quotas reopen.
    • Increased need to qualify alternative feedstocks (Indonesian MHP, recycled black mass, non-DRC hydroxide), which introduces technical complexity and quality management requirements.
    • Higher exposure to regulatory and reputational risk when sourcing from regions where artisanal cobalt may be mixed into industrial streams.
    • Greater internal pressure from risk committees and boards to reduce single-jurisdiction exposure, even when DRC material remains technically and chemically optimal.

    Materials Dispatch has seen procurement teams rewrite multi-year sourcing plans in a matter of quarters when prior DRC policy shifts stranded cargoes or delayed export permits. The current quota framework consolidates that sense of fragility: it signals that policy levers will continue to be used actively, and that operational predictability is a secondary consideration.

    Cobalt market outlook 2026: tight balance with substitution pressure

    Heading into 2026, most credible forecasts point to a cobalt market that is neither in comfortable surplus nor in catastrophic deficit, but in an uneasy tight balance. On the supply side, the DRC quota cap, administrative frictions, and the non-trivial role of ASM all reduce the effective availability of traceable hydroxide. On the demand side, battery manufacturers continue to expand capacity, but chemistry choices are evolving.

    Several dynamics stand out for the cobalt market outlook 2026:

    • Chemistry shifts: The rise of lower- or zero-cobalt chemistries (e.g., LFP for some EV segments) places a ceiling on how much sustained tightness is tolerable before customers and OEMs accelerate substitution away from cobalt-rich cathodes.
    • Indonesian ramp-up: As HPAL plants stabilize and deliver more consistent MHP volumes, refiners gain a credible, if not fully fungible, alternative to DRC hydroxide, particularly for NMC and NCA cathodes willing to absorb higher nickel shares.
    • Recycling impact: Growth in end-of-life battery flows begins to matter at scale. While still smaller than primary mining, recycled cobalt is no longer a rounding error; it shapes marginal supply, particularly in regulated markets eager to showcase circularity.
    • Stockpiling behavior: Both DRC’s own strategic stockpile and any quiet inventory accumulation by downstream states or industrial groups add a layer of opacity to the balance, potentially amplifying perceived scarcity.

    Under these conditions, DRC retains the capacity to trigger sharp but potentially short-lived squeezes in officially priced material. However, persistent high-price conditions would likely accelerate the shift to alternative chemistries and to non-DRC supply, ultimately eroding the very pricing power the quotas are intended to build.

    Stockpiled cobalt hydroxide at a port illustrating export bottlenecks and feedstock staging.
    Stockpiled cobalt hydroxide at a port illustrating export bottlenecks and feedstock staging.

    The structural paradox: supply dominance, governance drag

    Materials Dispatch’s core reading is that the “Congo cobalt paradox” is not geological but institutional. Ore bodies and output give DRC enormous leverage on paper; governance, enforcement, and parallel ASM channels erode that leverage in practice.

    • Export quotas signal scarcity but are partially offset by smuggling and informal flows.
    • Formal buyers internalize high regulatory and ESG risk premiums that do not translate into stable state revenue or community benefits.
    • Policy volatility incentivizes diversification rather than loyalty among refineries and OEMs.
    • The absence of large-scale domestic refining keeps DRC locked at the lower end of the value chain, limiting the ability to shape downstream margins.

    As long as this structure remains, the likely result is weak, unstable pricing power despite overwhelming resource dominance, with cobalt mining in Congo acting as both the backbone and the Achilles’ heel of the global cobalt system.

    WHAT TO WATCH: Policy, enforcement, and alternative supply signals

    Several indicators will show whether the congo cobalt export quota regime evolves into a more coherent strategy or settles into a chronic source of volatility. Materials Dispatch tracks at least the following signals:

    • Quota adjustments and renewals: Any mid-cycle changes to the 96,600 MT annual cap, especially shifts between exportable volumes and the 9,600 MT strategic stockpile component.
    • License processing times: Evidence that export permits move from months to weeks would indicate a shift toward more predictable implementation; persistent backlogs would confirm that administrative scarcity remains part of the policy mix.
    • ASM enforcement and formalization: Concrete data on artisanal production captured in traceable schemes versus estimates of smuggled volumes will determine whether quotas bind the market or simply redirect flows.
    • Indonesian project ramp-up: Actual output from key HPAL and MHP facilities compared with nameplate capacity, alongside any environmental or social pushback that could slow expansions.
    • Recycling build-out: Commissioning timelines and throughput data from major recycling facilities in Europe, North America, and Asia, especially those serving EV and energy storage segments.
    • Regulatory tightening on cobalt sourcing: Implementation milestones for EU Battery Regulation, US due diligence requirements, and any new regional rules that explicitly reference DRC or artisanal cobalt.
    • Cathode chemistry mix: Market share shifts between cobalt-intensive chemistries (NMC, NCA) and low- or zero-cobalt alternatives (LFP, emerging sodium-ion systems).

    The interaction between these signals will decide whether DRC can gradually convert its resource base into more stable influence, or whether the current pattern of episodic crises and workarounds becomes a semi-permanent feature of cobalt supply chains.

    Conclusion

    The DRC’s attempt to regain control over cobalt through export bans and quotas has laid bare a structural tension at the heart of the market: enormous geological advantage combined with fragmented governance and a large, hard-to-regulate artisanal sector. Formal export constraints have indeed tightened supply for traceable cobalt hydroxide and triggered significant price reactions, but they have not produced durable pricing power commensurate with DRC’s share of global mine output.

    Instead, the system increasingly resembles a two-track market: one constrained, regulated, and ESG-exposed; the other opaque, flexible, and difficult to influence with official policy tools. In this environment, alternative sources in Indonesia and from recycling become less a hedge and more a structural feature of cobalt planning, even though they cannot yet fully replace drc cobalt supply.

    For Materials Dispatch, the implication is clear: the Congo cobalt paradox is unlikely to resolve quickly, and the next phase will be defined at least as much by enforcement quality, ASM dynamics, and downstream chemistry choices as by the headline quota numbers. This justifies active monitoring of regulatory and industrial weak signals that will shape how the cobalt system recalibrates beyond 2026.

    Note on Materials Dispatch methodology Materials Dispatch integrates continuous monitoring of official texts and communications from mining ministries, trade authorities, and environmental regulators with systematic tracking of production, project, and logistics data where available. This is cross-referenced against downstream technical specifications for battery, alloy, and chemical applications to understand how regulatory moves interact with real-world material requirements. The result is a grounded reading of where policy, geology, and industrial practice actually meet.

  • EU Critical Raw Materials Act: 2030 Targets, No Mines, and the 25% Recycling Gap

    EU Critical Raw Materials Act: 2030 Targets, No Mines, and the 25% Recycling Gap

    Europe’s Critical Raw Materials Act sets ambitious 2030 supply targets, but permitting delays, funding gaps and extreme China/DRC dependence mean the EU is unlikely to close its strategic materials deficit without accelerated project execution, aggressive recycling and deeper third‑country partnerships.

    Europe’s Critical Raw Materials Act: Big Targets, No Mines

    Executive Summary

    The EU Critical Raw Materials Act (CRMA) entered into force in May 2024 with non-binding 2030 benchmarks that 10% of annual consumption of strategic raw materials be extracted, 40% processed, and 25% recycled domestically, and that no more than 65% of any strategic raw material come from a single non-EU country by 2030. [1][4] Despite this, the European Court of Auditors (ECA) now warns that the EU “risks falling short of key supply targets” because it remains heavily import-dependent and has made only limited progress in scaling mining, refining and recycling capacity. [4][26]

    Of 47 strategic projects approved under the CRMA within the EU, only five are fully funded and just 10 have received permits, leaving 37 still in the approval process and an estimated €22.5 billion capital requirement largely unmet. [2][8][9] A further 13 “strategic projects” outside the bloc will need around €5.5 billion to come online. [3] Against this, the ReSourceEU Action Plan provides only €3 billion of immediate EU funding, and the European Investment Bank (EIB) has pledged about €2 billion per year for critical mineral projects. [5][9]

    Meanwhile, Europe still obtains 97% of its magnesium, all of its heavy rare earths, 85% of its light rare earths and 98% of its rare-earth magnets from China, while 63% of global cobalt supply comes from the DRC, three-quarters of which historically flowed to China. [19][20][21][22] Disruptions such as the DRC’s cobalt export suspension and quota system, which more than doubled refined cobalt prices to $25/lb by October 2025, and China’s stop-start rare earth export controls underscore the vulnerability of European supply chains in EVs, renewables, and defense. [6][7]

    For procurement, trading, and strategy teams, the implementation gap in the EU Critical Raw Materials Act is no longer a regulatory abstraction; it is a concrete supply, price and geopolitical risk likely to intensify from 2026 through 2030.

    Immediate action items

    • By end of this week: Map Tier 1-2 suppliers against the 47 EU and 13 non‑EU CRMA strategic projects; flag exposure to unfunded or unpermitted assets in lithium, cobalt, nickel, manganese and graphite. [2][3][9]
    • Within 30 days: Establish internal price and policy triggers anchored to DRC cobalt quota developments, Chinese export control timelines (through November 2026), and current lithium price levels in Europe and China. [6][7][11][12]
    • By end-Q2 2026: Prioritise offtake, pre‑financing or JV discussions with EIB‑backed and CRMA‑designated projects (e.g., Barroso and Cinovec) and leading battery recyclers positioned to meet 2030 recovery targets. [9][10][13][18][24]

    Risk / Impact / Timing

    Risk Indicative Impact Timing Horizon
    Failure to meet CRMA 2030 extraction/processing/recycling benchmarks; continued >65% single‑source dependence for key materials Material cost escalation across EV, storage and defense value chains; multi‑hundred‑million‑euro exposure per large OEM under high‑price scenarios, given projected EU demand of 540,000 t lithium, 418,000 t graphite and 45,000 t cobalt by 2030. [4][14] Structural risk building through 2026-2030, with lithium market deficits emerging from 2028 under ambitious climate pathways. [17]
    Geopolitical disruption from DRC quotas and potential reinstatement or tightening of Chinese export controls Price spikes as seen in cobalt’s move from $10/lb to $25/lb in 2025, and rapid lithium price swings; risk of physical supply interruptions to EU cathode, magnet, and alloy producers. [6][7][11][12] Acute event risk 2025–2027 (DRC quotas and China control window to November 2026), with knock‑on contract and inventory implications thereafter. [6][7]
    Permitting, social licence and financing delays for EU mining and processing projects Under‑delivery of CRMA pipeline: only 10 of 47 EU projects permitted and just five fully funded today, limiting new domestic supply despite rising demand and available EIB support. [8][9][18] Chronic drag on capacity build‑out this decade; most new EU mines beyond 2027 production start, misaligned with 2030 targets. [2][18]

    The Problem

    The core problem is a widening gap between the EU Critical Raw Materials Act’s ambitions and on‑the‑ground execution in mining, processing, and recycling.

    CRMA sets headline 2030 benchmarks that at least 10% of annual EU consumption of each strategic raw material should be mined domestically, 40% processed inside the EU, and 25% sourced from recycling, while no more than 65% of any strategic raw material at any processing stage should originate from a single non‑EU country. [1][4] These targets were designed to reduce the economic and security risks of Europe’s current import dependence. The ECA, however, concludes that the EU “risks falling short of key supply targets under the CRMA because it remains heavily reliant on imports and has made limited progress in scaling domestic production, refining and recycling.” [4][26]

    Strategic project delivery is the principal bottleneck. The Commission has granted “strategic” status to 47 projects within the EU and 13 in partner countries, covering lithium, nickel, cobalt, manganese, graphite and other CRMs vital for batteries, renewables and defense. [2][3][18] Yet only five of the 47 EU projects are fully funded, and just 10 have received permits, leaving 37 still somewhere in the permitting or approval pipeline and implying a capital requirement of roughly €22.5 billion just for the EU projects. [2][8][9] The 13 non‑EU strategic projects together require about €5.5 billion in investment before they can begin operations. [3]

    Funding tools exist but are modest relative to needs. The ReSourceEU Action Plan announced in December 2025 provides €3 billion in immediate EU funding for alternative CRM supplies and establishes a European Critical Raw Materials Centre. [5] The EIB has committed to around €2 billion per year in financing for critical mineral projects and has begun signing technical assistance agreements with CRM developers such as Andrada Mining and EcoGraf as part of a broader EIB Group financing push. [9][10] Against the €22.5 billion EU project requirement and €5.5 billion for non‑EU projects, this leaves a large reliance on private and third‑country capital. [3][8][9]

    Meanwhile, Europe’s exposure to highly concentrated external supply chains remains extreme. China controls around 60% of global rare earth production and about 90% of refining capacity, while the EU sources all of its heavy rare earths and 85% of its light rare earths from China, along with 98% of its rare‑earth magnets. [19] The EU also obtains around 97% of its magnesium from China and relies on Chinese refining for 100% of its rare‑earth permanent magnets. [21][22] On the cobalt side, roughly 63% of global supply is mined in the Democratic Republic of Congo (DRC), and prior to new quotas about 75% of DRC output went to China, reinforcing a dual dependency. [20]

    The DRC’s suspension of cobalt exports in early 2025 and subsequent quota system, which limited Q4 2025 exports to 18,125 mt and is projected to reduce DRC cobalt exports 48% in 2026–2027 versus 2024, demonstrates how policy in a single supplier can trigger global price and availability shocks. [6] Refined cobalt prices more than doubled from around $10/lb in early 2025 to about $25/lb by October 2025. [6]

    At the same time, EU demand for critical minerals is set to surge. Commission projections indicate lithium demand could rise 12‑fold by 2030 and 21‑fold by 2050, while rare earth demand may increase six‑fold by 2030 and seven‑fold by 2050, driven by electromobility and renewable energy. [22] Fastmarkets estimates that by 2030 the EU will require approximately 540,000 mt of lithium (LCE), 418,000 mt of graphite and 45,000 mt of cobalt annually. [14]

    This combination of rapidly growing demand, entrenched dependence on China and the DRC, and under‑delivering domestic project pipelines creates clear downside risk for EU industrial competitiveness and energy transition timelines – particularly for OEMs and defense/aerospace firms that cannot easily relocate production or redesign material inputs.

    Current State

    The implementation trajectory of the EU Critical Raw Materials Act and related policies from 2024 through early 2026 reveals a pattern: high‑level ambition, growing project pipelines, but slow conversion into bankable, permitted assets and only partial mitigation of external supply risks.

    2024–early 2025: CRMA enters into force and first project wave

    The CRMA, formally Regulation (EU) 2024/1252, entered into force on 23 May 2024. [1] It set benchmark targets (10% extraction, 40% processing, 25% recycling, maximum 65% single‑country dependence) and introduced accelerated permitting timelines: 27 months for extraction projects and 15 months for processing and recycling projects designated as strategic. [1]

    On 25 March 2025, the European Commission approved 47 strategic projects across 13 member states covering mining, processing, and recycling of key materials including lithium, nickel, cobalt, manganese and rare earths. [2][18] These projects require an estimated €22.5 billion in capital investment. [8] The portfolio includes 22 lithium projects, 12 nickel, 10 cobalt and seven manganese assets, indicating a strong focus on battery materials. [18]

    At the same time, the EU moved to externalise some of its raw material strategy. By mid‑2025, the Commission had concluded 15 strategic partnerships with resource‑rich countries including Argentina, Australia, Canada, Chile, the DRC, Kazakhstan, Namibia, Norway, Rwanda, Serbia, Ukraine and Zambia, supported by the €300 billion Global Gateway infrastructure investment framework. [23] These partnerships are intended to underpin the 13 non‑EU strategic projects identified later in 2025. [3][23]

    Mid–late 2025: External shocks and ReSourceEU

    In early 2025, the DRC suspended cobalt exports, moving in October 2025 to a quota system that capped Q4 exports at 18,125 mt and is projected to lower exports by 48% in 2026–2027 compared to 2024. [6] The result was a sharp tightening of the refined cobalt market and a price surge from roughly $10/lb in early 2025 to about $25/lb by October. [6] Analysts estimate that if domestic production does not fall, more than 100,000 mt of cobalt per year could require storage in the DRC due to restricted exports, creating further market distortions. [6]

    On 4 June 2025, the Commission recognised 13 additional strategic projects located outside the EU in countries including Canada, Brazil, Ukraine, Kazakhstan, Norway and South Africa, with an estimated capital need of around €5.5 billion. [3] Ten of these are focused on EV and battery materials such as lithium, cobalt, nickel, manganese and graphite. [3] The Commission stated that these non‑EU projects “will contribute to the competitiveness of EU’s industry and in particular sectors such as electromobility, renewable energy, defense and aerospace.” [3]

    Domestic project implementation, however, began to encounter the familiar headwinds of permitting complexity and social opposition. In Romania, for example, the Rovina copper‑gold project – the EU’s largest mining development – faced legal challenges from NGOs and community organisations over environmental and social impacts. [18] In the Czech Republic, Jaromír Starý of the Czech Geological Survey argued that the CRMA’s 10% domestic extraction target was unrealistic for some critical raw materials because they are simply not found in sufficient quantities in Europe, stating that “at present it is impossible to say that some of the critical raw materials will be handled in quantities of up to 10% of European consumption.” [16]

    On 3 December 2025, the Commission launched the ReSourceEU Action Plan, pledging €3 billion in near‑term funding to secure alternative CRM supplies and establish the European Critical Raw Materials Centre. [5] Executive Vice‑President Stéphane Séjourné framed it as Europe “asserting its independence regarding critical raw materials.” [15] Yet industry voices stressed how far the EU had to go. Anne Lauenroth of the Federation of German Industries noted that “Europe outsourced part of the mining and processing capacity and expertise in the last decades; there was a big underinvestment in these areas.” [15]

    On 7 November 2025, China announced a temporary suspension of the second wave of its rare‑earth and critical‑mineral export controls until 10 November 2026, easing immediate fears but underscoring Beijing’s willingness to wield its dominant position. [7][19] China currently accounts for about 60% of global rare earth production, around 90% of refining, and supplies the EU with all of its heavy rare earths, 85% of light rare earths and 98% of rare‑earth magnets. [19]

    Early 2026: Auditors’ warning and market tightness

    In February 2026, the European Court of Auditors released Special Report 04/2026, concluding that the EU’s diversification efforts and CRMA implementation were unlikely to deliver the targeted supply security on their current trajectory. [4][26] The report argued that the EU “does not monitor the effect of these initiatives on supply” and that “the CRMA’s impact is further weakened by gaps in the underlying data and by targets that are not always supported by robust evidence — limitations that make it harder to track progress and guide investment.” [4]

    The auditors highlighted the underdevelopment of domestic processing and refining capacity, noting that European metals and refining facilities have been shrinking and that the lack of technology and unfavorable economics deter new investments. [26] This aligns with broader assessments that EU processing capacity for battery metals and rare earths is significantly lagging CRMA aspirations. [4][19][22]

    On the demand and price side, early 2026 data signalled renewed tightness. S&P Global Platts assessed February 2026 CIF Europe lithium carbonate and hydroxide prices in the $17,800–$18,500/mt range. [11] In China, lithium spot prices reached about 159,000 CNY/t as of 11 March 2026, up 112.28% year‑on‑year. [12] Wood Mackenzie forecasts that the global lithium market is heading into a supply crunch much sooner than many expect, with deficits emerging from 2028 under ambitious climate scenarios. [17]

    Battery recycling, a pillar of the CRMA’s 25% recycling benchmark, also lags. EU regulations foresee recovery targets of 70% for lithium and 95% for cobalt, lead, nickel, and copper from EV batteries by 2030. [13] Yet the ECA notes “limited progress in scaling domestic production, refining and recycling,” suggesting that current and planned facilities are not yet on a trajectory to meet those recovery targets at scale. [4][26]

    Europe at the center of a global critical-raw-materials supply network.
    Europe at the center of a global critical-raw-materials supply network.

    Against this backdrop, CRMA‑designated flagship projects such as Savannah Resources’ Barroso lithium project in Portugal – targeting 200,000 t/year of spodumene concentrate by 2027 – and the Cinovec lithium project in the Czech Republic – the EU’s largest hard‑rock lithium resource, targeting a definitive feasibility study by mid‑2025 and EIA submission by end‑2025 – remain in the development phase. [18][24] Their eventual commissioning is crucial to EU battery material self‑sufficiency, but their timelines mean that most new EU lithium supply will materialise only in the latter half of this decade, if projects can overcome permitting and social‑licence challenges. [18][24]

    Key Data & Trends

    The implementation gap in the EU Critical Raw Materials Act is best understood through four data lenses: the scale of the targets, the shape of projected demand, the status of the project pipeline, and the depth of Europe’s external dependencies.

    1. CRMA 2030 benchmarks codify an aggressive reshaping of supply

    The CRMA’s non‑binding benchmarks quantify how radically the EU aims to alter its supply structure by 2030. [1][4]

    This chart shows the CRMA’s 2030 targets: 10% of annual EU consumption of each strategic raw material to be mined domestically, 40% to be processed within the EU, and 25% to come from recycling. [1][4]

    For operators, the key takeaway is that the EU is not merely seeking incremental diversification; it is attempting to re‑anchor a large fraction of supply chains within its borders in less than a decade. Achieving 25% recycling implies massive investment in collection, dismantling and processing infrastructure, aligned with stringent 2030 recovery targets (70% lithium; 95% cobalt, nickel, copper, lead) for EV batteries. [1][13]

    2. Demand growth is dominated by lithium and graphite

    Projected EU 2030 demand indicates where supply bottlenecks will bite hardest.

    Fastmarkets projects that by 2030, the EU will require around 540,000 mt of lithium (LCE), 418,000 mt of graphite and 45,000 mt of cobalt annually. [14]

    Strategically, this underscores why CRMA pipelines are heavily weighted towards lithium and graphite assets and why lithium market dynamics (including China’s 112% year‑on‑year price increase as of March 2026) are likely to be the primary driver of battery cost risk for European OEMs. [12][14][17] Cobalt demand growth is smaller in tonnage terms, and some of it may be offset by shifts to cobalt‑free chemistries such as LFP, where China accounts for 70% of the domestic market and 99% of global cathode and cell production. [17][25]

    3. Project pipeline: a large portfolio with thin funding and slow permitting

    The EU’s 47‑project strategic pipeline appears impressive on paper but is constrained in practice by capital and permitting bottlenecks.

    Of 47 EU strategic projects approved under the CRMA, only 10 have permits, 37 remain in the approval process, and just five are fully funded. [2][8][9]

    For corporate strategists, this means that most “strategic” projects should currently be treated as optionality rather than firm supply. Anchor customers and financiers will be decisive in determining which projects advance. The EIB’s commitment of roughly €2 billion per year and the EU’s €3 billion ReSourceEU envelope are meaningful but insufficient to de‑risk the full €22.5 billion project slate plus €5.5 billion for non‑EU assets. [3][5][8][9]

    Moreover, community and NGO opposition, exemplified by the Rovina project, increase execution risk even for technically sound projects, and may lead to further delays despite the CRMA’s 27‑ and 15‑month permitting caps. [1][18]

    4. Structural dependence on China remains extreme

    Outside the battery complex, CRMA faces an even steeper uphill battle in rare earths and magnesium, where the EU is almost entirely dependent on Chinese supply.

    The EU sources about 97% of its magnesium from China and relies on China for 100% of heavy rare earths, 85% of light rare earths and 98% of rare‑earth magnets. [19][21][22]

    This concentration far exceeds the CRMA’s 65% single‑supplier benchmark and leaves Europe acutely exposed to Chinese export policy, environmental inspections, and domestic demand cycles. [4][19][22] European Central Bank economists estimate that over 80% of large European firms are no more than three intermediaries away from a Chinese rare‑earth producer, underlining the depth of embedded dependence. [19]

    Given that 34 materials are on the EU’s critical list – including lithium, cobalt, graphite, magnesium, silicon metal, gallium, nickel and rare earths – the combination of limited domestic geology (for some materials), decades of underinvestment in mining and refining, and entrenched third‑country concentration represents a structural challenge rather than a short‑term gap. [15][16][21][22]

    Risks & Scenarios

    Available evidence supports three broad scenarios for CRMA implementation and Europe’s critical material security to 2030. The research base does not allow for robust quantification of probabilities, so what follows is a structured, qualitative assessment rather than a numerical forecast.

    From extraction to processing and recycling — the stages the CRMA aims to scale.
    From extraction to processing and recycling — the stages the CRMA aims to scale.

    Scenario 1 – Managed shortfall: partial success, structural dependence persists

    In this most plausible scenario, the EU makes measurable progress but falls short of its 2030 benchmarks.

    Under this path, a subset of the 47 EU strategic projects reaches funding and permitting milestones by the late 2020s, supported by EIB financing and ReSourceEU, with lithium flagships such as Barroso and Cinovec entering production close to or shortly after 2027. [5][9][18][24] Several of the 13 non‑EU strategic projects advance, particularly in jurisdictions with strong governance (Canada, Norway, Australia), contributing additional diversified supply for EV and battery metals. [3][23]

    However, permitting delays, social‑licence challenges, and limited private capital appetite mean that many projects slip beyond 2030. The ECA’s concerns about data gaps, weak monitoring of diversification outcomes, and underdeveloped processing capacity remain only partially addressed. [4][26] The EU edges closer to, but does not fully achieve, the 10/40/25 extraction‑processing‑recycling benchmarks, and dependence on China and the DRC remains above the 65% threshold for several key materials, especially magnesium, rare earths and some battery precursors. [19][21][22]

    Implications: supply is available but at structurally higher prices and under continued geopolitical risk. OEMs and defense contractors must navigate periodic price spikes (similar to the cobalt surge in 2025 and recent lithium volatility) and carry higher strategic inventories. [6][11][12][17]

    Scenario 2 – Escalation: geopolitical shocks collide with implementation delays

    In a more adverse scenario, external shocks coincide with under‑delivery of CRMA projects.

    This would involve tighter or extended DRC cobalt quotas beyond the 2026–2027 window already projected to cut exports by 48% compared to 2024, reinforcing high cobalt prices and periodically constraining physical availability. [6] Simultaneously, China could reinstate and broaden rare‑earth and critical‑mineral export controls after the current suspension expires in November 2026, potentially covering additional downstream products such as magnets or key battery precursors. [7][19]

    Under this scenario, progress on EU mining and refining remains slow: community opposition stalls projects like Rovina, and only a handful of new EU assets reach production before 2030. [18] Recycling capacity scales but fails to hit the 70% lithium and 95% cobalt/nickel/copper targets, limiting the contribution of secondary supply. [4][13][26] Global lithium deficits from 2028 under ambitious climate scenarios materialise, amplifying the effect of supply disruptions on prices. [17]

    Implications: This scenario would see recurring, potentially severe supply squeezes in lithium, cobalt and rare earths, with downstream curtailments in EU EV and battery manufacturing, elevated hedging costs, and a greater likelihood of direct state intervention (e.g., strategic stockpiles, export restrictions on EU‑produced technologies).

    Scenario 3 – Accelerated adjustment: funding and policy alignment narrow the gap

    In a more benign scenario, the EU responds decisively to the ECA’s 2026 warning and accelerates implementation.

    Under this path, the Commission strengthens monitoring of diversification outcomes, addresses data gaps, and further streamlines permitting beyond the CRMA’s current timelines. [1][4][26] Additional EU and member‑state capital is mobilised alongside the EIB’s €2 billion per year and existing €3 billion ReSourceEU funding, enabling a larger share of the 47 EU and 13 external projects to achieve bankability and reach construction within the decade. [3][5][8][9]

    Battery recycling capacity ramps up more quickly, helping the EU converge towards 70% lithium and 95% cobalt/nickel/copper recovery from EV batteries by 2030, thereby partially insulating the bloc from primary market deficits. [13] Meanwhile, technology shifts – such as increased adoption of LFP chemistries and material thrifting in cathodes and magnets – reduce demand pressure for the scarcest inputs, particularly cobalt and some heavy rare earths. [17][25]

    Implications: Even in this optimistic scenario, the EU is unlikely to attain full autonomy; geology, historical underinvestment and entrenched Chinese strength in processing limit the scope for reshoring. [15][19][22][26] But supply risks would be more manageable, price volatility somewhat reduced, and Europe’s bargaining position in global markets improved.

    Risk matrix: timing and impact

    Across scenarios, two timing axes matter:

    • 2025–2027 (acute shock window): Dominated by DRC cobalt quotas, potential re‑tightening of Chinese export controls after November 2026, and emerging lithium market tightness. [6][7][11][12][17]
    • 2028–2030 (structural balance window): Determined by how many CRMA strategic projects reach operation, the maturity of recycling infrastructure, and whether demand growth follows the EU’s high‑ambition pathway (12x lithium, 6x rare earths by 2030) or a slower track. [14][17][22]

    For risk managers, this suggests focusing near‑term on shock absorption (inventory, flexible offtake, diversification) and medium‑term on structural repositioning (equity stakes, JV refining, and deep recycling integration).

    Actionable Intelligence

    The following checklists translate the CRMA implementation gap and associated market risks into concrete actions for procurement directors, supply chain strategists, and trading desks.

    Do Now (next 4–6 weeks)

    • Map exposure to CRMA‑dependent supply – Build a cross‑functional map linking Tier 1–2 suppliers and critical components (cathodes, anodes, magnets, high‑performance alloys) to the 47 EU and 13 non‑EU CRMA strategic projects. Classify each exposure by project status (permitted vs. in approval), funding status, material (lithium, cobalt, nickel, manganese, graphite, rare earths) and geography. [2][3][9][18] Ownership: Strategic sourcing. Deadline: 30 days.
    • Anchor risk metrics to current market and policy reference points – Define internal alert thresholds using documented benchmarks: cobalt prices doubling to $25/lb in 2025 under DRC quotas; current lithium CIF Europe prices ($17,800–$18,500/mt); Chinese spot at 159,000 CNY/t; and the current suspension window of Chinese export controls (to November 2026). [6][7][11][12] Ownership: Risk/treasury. Deadline: 2 weeks.
    • Re‑paper offtake and supply contracts – Review key raw material and intermediate offtake contracts to ensure pricing and force‑majeure clauses explicitly account for export quota regimes, export controls, and regulatory changes linked to CRMA implementation. Prioritise contracts covering cobalt, lithium and rare earths, where policy risk is already visible. [6][7][11][12][19] Ownership: Legal & procurement. Deadline: Contract review plan within 4 weeks.
    • Identify priority recycling and circularity partners – Given the 25% recycling benchmark and 70%/95% recovery targets for lithium and other metals, undertake a shortlisting of EU‑based and allied‑market recyclers with credible scaling plans to 2030. [1][13] Ownership: Sustainability & supply chain. Deadline: Initial longlist in 6 weeks.
    • Stress‑test production plans against 2028 lithium deficit scenarios – Use publicly available Wood Mackenzie scenarios to test the sensitivity of your 2028–2032 production plans to lithium supply deficits and price spikes, given EU lithium demand projections. [14][17][22] Ownership: Corporate planning. Deadline: Initial stress test in 6 weeks.

    Do in Q2–Q4 2026 (medium term)

    • Engage early with strategic projects as an anchor customer – For materials where dependence is most acute (lithium, graphite, rare earths, magnesium), initiate structured dialogues with developers of CRMA strategic projects (e.g., Barroso, Cinovec) and EIB‑backed external projects to explore long‑term offtake, pre‑payment, or equity participation. [3][9][10][18][24] Early commitments can improve project bankability and give buyers preferential access.
    • Design a multi‑jurisdiction sourcing portfolio – Leverage the EU’s 15 strategic partnerships (e.g., Canada, Australia, Norway, Namibia, Chile, Argentina, Ukraine) to diversify away from single‑country exposure that violates the CRMA’s 65% benchmark. [4][20][21][22][23] Build procurement scenarios that incorporate a minimum of three non‑EU source regions per critical material at the processing stage.
    • Co‑develop refining and processing capacity – The ECA underlines the underdevelopment of domestic processing; consider joint ventures, tolling arrangements or long‑term commitments with emerging refining projects in the EU or allied countries. [4][21][22][26] Focus on battery precursors, rare‑earth separation, and magnesium alloying, where Chinese dominance is strongest. [19][21][22]
    • Integrate recycling into procurement strategy – Treat secondary material flows as a strategic “source country.” Map anticipated scrap and end‑of‑life volumes across product lines and align with recycling partners to meet or exceed 2030 recovery targets. [13] For OEMs, include recycled content requirements in supplier scorecards.
    • Establish a CRMA implementation taskforce – Create an internal working group to track regulatory updates (including implementing acts, delegated acts and guidance), permitting developments for key projects, and EIB/Global Gateway financing opportunities. [5][8][9][23] This taskforce should feed directly into sourcing and capex decisions.

    Do by 2026 and beyond (strategic positioning)

    • Take strategic equity stakes in upstream and midstream assets – For large energy, automotive, and aerospace groups, minority equity stakes in CRMA‑aligned projects (both mining and refining) can secure long‑term supply, provide visibility into project execution risk, and align incentives with project financiers and host governments. [2][3][8][9][18]
    • Invest in design and material substitution to reduce exposure – Use the 2026–2030 window to scale technologies that reduce dependency on the scarcest inputs: cobalt‑lean or cobalt‑free batteries (e.g., LFP), rare‑earth‑light or rare‑earth‑free motors, and alternative alloys for magnesium‑intensive components. [17][19][21][22][25] This aligns with the observed shift in the critical minerals debate from purely decarbonisation to defense and security concerns. [15]
    • Shape permitting and social‑licence frameworks – Engage constructively with EU and member‑state authorities to support predictable, robust permitting regimes that reconcile speed with environmental and social safeguards. [1][18][26] Corporate participation in community benefit schemes and transparent ESG reporting can help reduce the risk of Rovina‑type challenges for projects critical to your supply chain.
    • Develop strategic inventories and storage solutions – Given the DRC’s likely need to store over 100,000 mt of cobalt annually under the quota regime, and Europe’s high import dependency, assess the economics and logistics of holding higher critical material inventories, either individually or via shared industry stockpiles. [6][20]
    • Integrate CRMA metrics into enterprise risk management – Incorporate CRMA benchmarks (10/40/25 and 65% single‑country limit) as internal risk KPIs for critical materials. [1][4] Regularly report to the board on deviations from these benchmarks in your procurement profile and progress on remediation.

    Signals to Watch

    To manage CRMA‑related risks proactively, operators should track a focused set of weekly indicators and treat specific thresholds or events as triggers for tactical action.

    • Cobalt price and DRC policy trajectory – Monitor refined cobalt prices relative to the October 2025 level of around $25/lb and watch for announcements on adjustments to the DRC’s export quotas, currently projected to cut exports by 48% in 2026–2027 versus 2024. [6] Sustained moves materially above that price, coupled with stricter quotas, should prompt inventory and contract reviews.
    • Lithium price differentials (China vs. CIF Europe) – Track Chinese spot prices – 159,000 CNY/t as of 11 March 2026, up 112% year‑on‑year – alongside CIF Europe carbonate and hydroxide prices (~$17,800–$18,500/mt in early February 2026). [11][12] Widening or persistent differentials can signal logistical or policy frictions affecting European buyers.
    • Chinese export control announcements – Follow developments regarding the current suspension of China’s second wave of rare‑earth and critical‑mineral export controls, valid until 10 November 2026. [7] Any move to reinstate or broaden controls to magnets or battery precursors should trigger scenario updates and accelerated diversification efforts.
    • Permitting milestones for key EU projects – Watch for EIA approvals, mining licences and construction decisions on Barroso, Cinovec and other large CRMA strategic projects, as well as resolution of legal challenges at Rovina. [18][24] Each major permit materially changes the medium‑term supply outlook for specific materials.
    • EU recycling capacity announcements and regulation – Track new investment decisions and policy updates related to battery recycling and CRM recovery targets (70% lithium; 95% cobalt, nickel, copper, lead by 2030). [13] Evidence of lagging investment or regulatory delays would strengthen the case for securing primary supply and developing in‑house circular solutions.

    Sources

    [1] European Parliament – “European Critical Raw Material Act (Regulation EU 2024/1252)” – https://www.europarl.europa.eu/legislative-train/theme-a-europe-fit-for-the-digital-age/file-european-critical-raw-material-act

    [2] European Commission – “Commission approves 47 strategic projects under the Critical Raw Materials Act” (Press materials), 25 March 2025 — https://ec.europa.eu/commission/presscorner/detail/en/ip_25_864

    [3] S&P Global Commodity Insights (Energy) — “EU identifies 13 new strategic critical mineral projects located outside bloc,” 4 June 2025 — https://www.spglobal.com/energy/en/news-research/latest-news/metals/060425-eu-identifies-13-new-strategic-critical-mineral-projects-located-outside-bloc

    [4] S&P Global Commodity Insights (Energy) — “EU faces uphill battle to meet critical raw materials targets – auditors report,” 4 February 2026 — https://www.spglobal.com/energy/en/news-research/latest-news/metals/020426-eu-faces-uphill-battle-to-meet-critical-raw-materials-targets-auditors-report

    [5] European Commission — “New measures to secure raw materials and strengthen the EU’s economic security” (ReSourceEU Action Plan), 3 December 2025 — https://commission.europa.eu/news-and-media/news/new-measures-secure-raw-materials-and-strengthen-eus-economic-security-2025-12-03_en

    [6] S&P Global Market Intelligence — “DRC cobalt export quotas to support cobalt prices though challenges loom,” October 2025 — https://www.spglobal.com/market-intelligence/en/news-insights/research/2025/10/drc-cobalt-export-quotas-to-support-cobalt-prices-though-challenges-loom

    Visual schematic of the CRMA pipeline and capacity benchmarks (visual proportions only).
    Visual schematic of the CRMA pipeline and capacity benchmarks (visual proportions only).

    [7] Clark Hill — “China hits pause on rare earth export controls and what it means for supply chains,” 7 November 2025 — https://www.clarkhill.com/news-events/news/china-hits-pause-on-rare-earth-export-controls-and-what-it-means-for-supply-chains/

    [8] UNCTAD Investment Policy Monitor — “Streamlines permitting and enhances access to finance for 47 strategic projects under the Critical Raw Materials Act,” March 2025 — https://investmentpolicy.unctad.org/investment-policy-monitor/measures/5127/streamlines-permitting-and-enhances-access-to-finance-for-47-strategic-projects-under-the-critical-raw-materials-act-

    [9] Hatch — “47 European Strategic Projects,” blog, 2026 — https://www.hatch.com/About-Us/Publications/Blogs/2026/01/47EUR-Projects

    [10] European Investment Bank — “EIB Global backs sustainable critical raw material projects in Africa,” 2026 — https://www.eib.org/en/press/all/2026-050-eib-global-backs-sustainable-critical-raw-material-projects-in-africa

    [11] S&P Global Platts / Commodity Insights — Lithium carbonate and hydroxide CIF Europe price assessments, 3 February 2026 — (referenced in S&P coverage) — https://www.spglobal.com/energy/en/news-research/latest-news/metals/020426-eu-faces-uphill-battle-to-meet-critical-raw-materials-targets-auditors-report

    [12] Trading Economics — “Lithium” commodity price data, 11 March 2026 — https://tradingeconomics.com/commodity/lithium

    [13] Battery Tech Online — “EU boosts EV battery recycling for clean energy transition” — https://www.batterytechonline.com/ev-batteries/eu-batteries/eu-boosts-ev-battery-recycling-for-clean-energy-transition

    [14] Fastmarkets — “EU Critical Raw Materials Act: demand outlook and implications,” (EU CRM Act feature) — https://www.fastmarkets.com/metals-and-mining/eu-critical-raw-materials-act/

    [15] Fastmarkets — “EU’s critical minerals strategy: €3 billion boost amid industry risks,” December 2025 — https://www.fastmarkets.com/insights/eus-critical-minerals-strategy-e3-billion-boost-amid-industry-risks/

    [16] Euronews — “From lithium to rare earths: Europe’s strategy to power its future energy,” 4 June 2025 — https://www.euronews.com/my-europe/2025/06/04/from-lithium-to-rare-earths-europes-strategy-to-power-its-future-energy

    [17] Mining.com / Wood Mackenzie — “Lithium demand to top 13m tonnes by 2050 – WoodMac,” — https://www.mining.com/lithium-demand-to-top-13m-tonnes-by-2050-woodmac/

    [18] Mining Magazine — “47 European strategic projects announced,” 2025 — https://www.miningmagazine.com/europe/news-analysis/4411420/47-european-strategic-projects-announced

    [19] European Parliament Research Service — “EU dependence on critical raw materials,” 2025 briefing (includes rare earths and supply chain analysis) — https://www.europarl.europa.eu/RegData/etudes/ATAG/2025/779220/EPRS_ATA(2025)779220_EN.pdf

    [20] Modern Diplomacy — “Congo’s cobalt curbs expose China’s critical metals vulnerability,” 25 February 2026 — https://moderndiplomacy.eu/2026/02/25/congos-cobalt-curbs-expose-chinas-critical-metals-vulnerability/

    [21] European Commission — “Critical raw materials” (Single Market Economy) — https://single-market-economy.ec.europa.eu/sectors/raw-materials/areas-specific-interest/critical-raw-materials_en

    [22] European Commission — “European Critical Raw Materials Act and Green Deal Industrial Plan” overview pages — https://commission.europa.eu/topics/competitiveness/green-deal-industrial-plan/european-critical-raw-materials-act_en

    [23] European Commission — “Raw materials diplomacy and Global Gateway” — https://single-market-economy.ec.europa.eu/sectors/raw-materials/areas-specific-interest/raw-materials-diplomacy_en

    [24] Crux Investor — “Europe’s strategic lithium player targeting 2027 production” (Savannah Resources, Barroso Project) — https://www.cruxinvestor.com/posts/europes-strategic-lithium-player-targeting-2027-production

    [25] Cobalt Institute — “Cobalt Market Report 2024,” May 2025 — https://www.cobaltinstitute.org/wp-content/uploads/2025/05/Cobalt-Market-Report-2024.pdf

    [26] European Court of Auditors — Special Report 04/2026 on EU critical raw materials (processing capacity, data gaps, implementation risks) — https://www.eca.europa.eu/ECAPubli

  • Rare Earth Recycling: Why the EU’s 15% Target Is Still Out of Reach

    Rare Earth Recycling: Why the EU’s 15% Target Is Still Out of Reach

    Materials Dispatch cares about rare earth recycling for very pragmatic reasons: repeated supply shocks, tightening regulation, and direct exposure of critical value chains to a narrow set of suppliers. Over the last decade, procurement and compliance teams that Materials Dispatch has observed were forced to manage through export controls, multi-quarter NdPr price spikes, and last-minute supplier failures in NdFeB magnet and battery metals. Each episode pushed internal risk thresholds lower and made one conclusion inescapable: without credible rare earth and broader critical minerals recycling capacity, policy targets and industrial strategies are built on sand.

    The EU Critical Raw Materials Act (CRMA) takes this tension to an extreme by turning recycling into a binding compliance benchmark. The law’s 15% per-material recycling target for strategic raw materials, including rare earths, is not an aspirational slogan; it is designed as a hard requirement with enforcement tools attached. Yet on the ground, rare earth recycling in Europe is still at pilot scale. Facilities evaluated by Materials Dispatch in France, Belgium and Germany look impressive on paper but collectively remain an order of magnitude away from the capacities implied by the 2030 target.

    • The change: The CRMA introduces a binding 15% domestic recycling capacity target by 2030 for each strategic raw material, including all rare earth elements.
    • Current reality: Reported EU rare earth recycling rates are below 1%, and NdFeB magnet collection rates are often quoted below 5%, creating a structural capacity gap.
    • Scope: The target covers per-material recycling capacity, not only for batteries but also for magnets and other rare earth applications, with potential penalties for large SRM users.
    • Operational impact: If current trajectories persist, rare earth supply chains for EVs, wind turbines and electronics face a compliance cliff rather than a smooth transition to circularity.
    • Limits of this reading: Capacity figures, timelines and geopolitical developments remain uncertain and unevenly disclosed; all extrapolations here are conditional on those imperfect data points.

    FACTS: CRMA Recycling Architecture and the Rare Earth Baseline

    The CRMA’s 15% Recycling Target and Legal Mechanics

    The EU Critical Raw Materials Act, adopted in 2024, establishes quantitative benchmarks often summarised as the “10-15-40” framework: a share of extraction, a share of recycling, and a share of processing to be achieved domestically. The recycling pillar is particularly stringent: at least 15% of annual EU consumption of each listed strategic raw material is expected to be met by domestic recycling capacity by 2030. This applies per material and covers an expanded list of strategic raw materials, including all rare earth elements (REEs) as well as lithium, cobalt, nickel and other inputs crucial for permanent magnets and batteries.

    The CRMA creates a category of “Strategic Projects” in recycling, eligible for streamlined permitting and priority funding access. Legal texts outline maximum permitting timelines significantly shorter than legacy mining and industrial projects, with the explicit intent of de-bottlenecking recycling capacity. In parallel, enforcement provisions indicate that large users of strategic raw materials-such as automotive manufacturers and wind turbine OEMs-can be exposed to fines of up to a small single-digit percentage of global turnover if they fail certain critical raw materials obligations, including those linked to domestic sourcing and capacity benchmarks.

    The Act also explicitly links to other EU instruments. Battery regulations set minimum recycled content thresholds for cobalt, lithium and nickel in new batteries from the second half of this decade, combined with high recovery-efficiency requirements. The CRMA framework, digital product passports for key value chains, and evolving waste shipment rules are designed to reinforce each other, including for rare earth-bearing products such as NdFeB magnets.

    Recycling Benchmarks vs. Today’s Rare Earth Reality

    Publicly stated figures cited in European policy debates are stark: rare earth recycling rates in the EU are placed below 1% of consumption. For NdFeB magnets-the workhorse of EV motors, wind turbines and many electronics—end-of-life magnet collection rates are often reported in the low single digits, sometimes under 5%. That means most retired motors, drives and devices currently leave the system as mixed scrap, exported waste, or non-recovered material.

    For neodymium-praseodymium (NdPr), central to high-performance magnets, expert assessments used in Brussels discussions frequently converge on a required EU recycling capacity in the low thousands of tonnes per year by 2030 to align with the 15% target, while current operational or near-operational capacity is described in the low hundreds of tonnes at most. This gap is corroborated by project-level disclosures from companies attempting rare earth recycling at scale.

    Several names recur in this space. Solvay’s activities in France, Umicore’s facilities in Belgium, and Urban Mining Company’s magnet-focused work in Europe are routinely cited as leading rare earth or magnet recyclers. However, public statements and project status updates indicate that these are still pilot or demonstration-scale for rare earths, not yet fully-fledged industrial plants capable of materially changing the EU-wide balance for NdPr or other rare earths.

    Funding, Timelines and Complementary Instruments

    On the funding side, the ReSourceEU initiative and upcoming Horizon Europe calls reportedly earmark several hundred million euros—around €593 million has been cited specifically for 2026-2027 recycling-related R&D. The focus areas include rare earth magnet recycling and recovery of battery-critical materials. Additional funding lines such as the European Innovation Council are targeting advanced process development and scale-up.

    Europe-wide map visualizing recycled feedstock flows and infrastructure concentration
    Europe-wide map visualizing recycled feedstock flows and infrastructure concentration

    Timelines across instruments interact. The CRMA’s 2030 benchmark coexists with:

    • Battery Regulation recycled-content requirements for cobalt, lithium and nickel, with efficiency standards for recovery processes.
    • Forthcoming national circularity and collection plans, where member states are expected to define targets for strategic raw materials-containing waste streams.
    • Digital product passports scheduled to become mandatory for certain product groups later this decade, embedding traceability of recycled content and material provenance.
    • Emerging restrictions on waste and scrap exports, including magnet-containing waste, intended to retain feedstock within the EU for domestic recyclers.

    Externally, policy drafts from China framing rare earth scrap exports as a matter of national security have been discussed since the mid-2020s, with proposed curbs on scrap and intermediate exports that contain rare earths. Market reporting in the same period highlighted spikes in neodymium-praseodymium oxide prices and widening premiums for NdFeB scrap delivered into European ports, as recyclers and magnet makers competed for limited material. While exact figures vary by source, the direction is consistent: geopolitical uncertainty has translated into higher volatility and tighter margins for error.

    INTERPRETATION: A Compliance Cliff Built on a Thin Recycling Base

    Why the 15% Target Looks Structurally Misaligned

    On Materials Dispatch’s reading, the 15% per-material recycling target creates a structural mismatch between legal obligation and industrial reality for rare earths. If the statements cited in policy documents and industry briefings are directionally accurate— below-1% current recycling for rare earths, low single-digit collection rates for magnets, and sub-200 tonne NdPr recycling capacity versus thousands of tonnes required—then the trajectory to 2030 under existing projects is inadequate.

    Three elements make the target feel more like a compliance cliff than a gradual ramp:

    • Per-material stringency: The 15% figure applies to each strategic raw material individually, not as an aggregate across a basket. That matters because rare earths are structurally harder to collect and separate than, for example, nickel or cobalt in large-format EV batteries.
    • Feedstock reality: Low magnet and device collection rates mean even perfectly efficient recycling plants would be starved of input. In several procurement cycles examined by Materials Dispatch, recyclers openly acknowledged that the bottleneck was access to consistent magnet-rich scrap rather than process chemistry.
    • Scale of capital deployment: Public funding is significant at the R&D level but still biased toward pilots and demonstrations. Rare earth hydrometallurgy, magnet-to-magnet direct recycling and advanced sorting need gigafactory-scale deployment, not just lab validation, for the 15% target to become credible.

    If these conditions hold, then the only ways the target is met by 2030 would be: an unexpected surge in collection and feedstock availability; a series of accelerated scale-up decisions for large recycling plants; or a reinterpretation of what counts as “domestic recycling capacity” in enforcement practice. None of those are impossible, but none currently look like the base case.

    Feedstock and Collection: The Invisible Ceiling

    Across multiple supply chain investigations, Materials Dispatch repeatedly encounters the same hard limit: very low capture of magnet-containing products at end of life. EV motors, wind turbines and industrial drives have long service lives; much of the rare earth demand growth to 2030 comes from new installations, not from assets approaching retirement. Consumer electronics magnets are light, dispersed and often end up in residual waste streams.

    Collection rates below 5% for end-of-life NdFeB magnets, as cited in several technical and policy documents, imply that even a massive build-out of separation capacity could still underperform the 15% target. Without dense, predictable scrap streams, facilities cannot run at design capacity. That is exactly what project data from frontrunner plants suggest: utilisation rates well below nameplate for rare earth lines, because the right type of scrap is not arriving at the gate in sufficient quantity or quality.

    Magnet scrap and hydrometallurgical separation setup
    Magnet scrap and hydrometallurgical separation setup

    This is particularly acute for offshore wind and EV motors. Several developers have privately indicated to Materials Dispatch that long-term contracts for magnet scrap are either not in place or are subordinated to more pressing issues like turbine installation schedules or vehicle deliveries. In other words, circularity logistics are still an afterthought compared with primary deployment targets, despite the CRMA’s ambitions.

    Permitting, Local Opposition and the Scale-Up Bottleneck

    The CRMA’s Strategic Project designation is supposed to compress permitting timeframes, but on-the-ground reality remains messy. In several jurisdictions, local opposition to new metallurgical facilities—whether hydrometallurgical or pyrometallurgical—has added years of delay through legal challenges, environmental impact debates and zoning disputes. References to delayed rare earth and battery-metal recycling projects in France, Germany and the Nordics all share the same pattern: technically promising concepts stuck in planning limbo.

    In practice, this means the EU is leaning on a handful of retrofitted legacy sites and a pipeline of projects that are not yet past final investment decision, let alone construction. Solvay’s rare earth initiatives, Umicore’s expansions and Urban Mining Company’s magnet plants are all stepping into this space, but they do so against a clock that does not wait for permitting lawyers and municipal councils.

    To the extent that Strategic Project fast-tracks are used more aggressively in the next two to three years, some of this bottleneck could ease. Yet that would require political willingness to accept industrial installations with the associated traffic, waste and emissions in communities that have grown used to cleaner, service-oriented economies. Industry-facing narratives about “critical minerals sovereignty” have not yet translated into stable local social licence for rare earth recycling sites.

    Funding Focus: Pilots vs. Gigafactories

    Funding allocations under ReSourceEU and Horizon Europe, particularly the cited €593 million for recycling-related calls in 2026-2027, are material in R&D terms. However, Materials Dispatch’s work tracking project pipelines indicates a strong skew toward pilot plants, demonstrators and process-optimisation projects rather than large-scale commercial facilities for rare earths.

    Battery recycling is an exception. There, large integrated facilities run by actors such as Umicore, Hydrovolt joint ventures and OEM-linked recyclers are already processing substantial volumes of black mass and meeting early regulatory thresholds for cobalt, nickel and lithium. Yet even in those complexes, rare earth lines are usually either non-existent, in pilot mode, or marginal in volume. The technical and economic hurdles for extracting dilute rare earths from mixed streams remain higher than for battery metals.

    The consequence is a two-speed circular economy: one track where battery-critical materials have a clear path to meeting or approaching regulatory recycled-content requirements, and another where rare earths lag far behind. Treating these as equivalent in compliance planning or policy communication risks obscuring the specific gap on NdFeB magnet recycling.

    Collection bottlenecks versus planned large-scale recycling facilities
    Collection bottlenecks versus planned large-scale recycling facilities

    Market Volatility and Geopolitics: Stress Testing the System

    Price reporting from late 2025 and early 2026, which flagged a jump in NdPr oxide prices from a lower baseline to significantly higher levels and a roughly quarter-on-year increase in NdFeB scrap prices delivered into Northwest Europe, is more than just a trading anecdote. It is a live stress test of the CRMA’s underlying assumption that domestic recycling can buffer Europe from external shocks.

    If Chinese authorities proceed with tighter controls on rare earth scrap exports, and if the US maintains a focus on battery metals in its own subsidies while largely ignoring REEs, then European recyclers will be bidding for a smaller pool of international feedstock at higher prices. Without domestic collection and processing capacity scaled in advance, the 15% target turns from a risk mitigant into a source of additional compliance pressure at precisely the moment when markets are most strained.

    From the vantage point of Materials Dispatch’s engagements with OEM procurement and compliance teams, the signal is clear: internal governance already treats rare earth sourcing as a key risk domain, yet the tools available for genuinely diversifying away from primary Chinese refining remain limited. Recycling is supposed to be the third leg of that stool, alongside diversification and substitution; so far, it is not carrying its share of the weight.

    WHAT TO WATCH: Indicators of Whether the Gap Can Close

    Several concrete signals will indicate whether the 15% rare earth recycling target is moving from paper to practice or drifting into symbolic territory:

    • Strategic Project designations for rare earths: The number, scale and geographic spread of CRMA Strategic Projects explicitly focused on rare earth or NdFeB magnet recycling, and whether they reach final investment decision on credible timelines.
    • Collection rate data: Updated statistics on collection of magnet-containing products (motors, turbines, electronics) in member-state circularity plans, especially whether magnet-specific targets and logistics schemes appear.
    • Permitting outcomes: The success rate and duration of permitting for hydrometallurgical and direct magnet recycling facilities, including the resolution of legal challenges and local opposition.
    • Corporate recycled-content commitments: Public commitments by automotive, wind and electronics OEMs to specific recycled rare earth content in magnets, going beyond what current regulation explicitly requires.
    • Technology demonstrations at scale: Evidence that hydrometallurgical rare earth processing or direct magnet-to-magnet recycling processes have run reliably at multi-thousand-tonne-per-year levels, with performance acceptable for demanding end-uses.
    • Trade and export-control developments: Final form and enforcement of any Chinese rare earth scrap export restrictions, EU waste shipment rules affecting magnet scrap, and any transatlantic arrangements touching REE recycling.
    • Regulatory recalibration: Signs that the European Commission is preparing delegated acts, guidance or future revisions that clarify enforcement of the 15% target, define “recycling capacity” more flexibly, or sequence obligations by material.

    Conclusion

    In its current form, the CRMA’s 15% per-material recycling target sets an exacting benchmark that aligns with Europe’s rhetoric on strategic autonomy but collides with the practical state of rare earth recycling capacity. NdFeB magnets and other rare earth-bearing components remain poorly collected, sparingly processed, and weakly integrated into the circular economy compared with battery metals. The flagship projects on the table—Solvay’s rare earth lines, Umicore’s expansions, Urban Mining Company’s magnet initiatives—are meaningful, yet they do not, collectively, close the structural gap implied by the law.

    Unless collection, permitting and industrial-scale funding accelerate in a sustained and coordinated way, the 2030 rare earth recycling benchmark risks becoming a compliance problem more than a resilience solution. For Materials Dispatch, the key question is no longer whether the target is ambitious, but whether it is being treated as a planning constraint in regulatory practice and corporate governance, or as a negotiable aspiration. Active monitoring of regulatory and industrial weak signals around rare earth recycling, from project pipelines to export controls, will define how that tension resolves in the years ahead.

    Note on Materials Dispatch methodology Materials Dispatch combines continuous monitoring of official texts, consultations and technical outputs from relevant authorities with systematic tracking of disclosed project pipelines, capacity announcements and market behaviour in critical raw material value chains. That regulatory and market reading is then cross-checked against end-use technical specifications in sectors such as EVs, wind, defence and electronics to assess how realistic policy targets are for the materials and processes that actually exist today.